[h2]Symptom
During the running and verification of the operator NPU, the operator precision is compared in modes such as md5sum. The actual data is inconsistent with the true data, and the operator precision problem occurs. In this example, md5sum is used for accuracy comparison. The printed true value is different from the MD5 value of the actual output data. The detailed information is as follows:
md5sum:
45e17ee4c068a655be2af4d8c3a1f191  output/golden.bin
6a99e41a84b14dd04f32730ceb9a3988  output/output_y.bin
[h2]Root Cause
Generally, an operator precision problem occurs because of the incorrect implementation logic.
[h2]Troubleshooting Procedure
Ascend C provides the twin debugging function to locate the implementation logic problem of an operator through function verification in the CPU, GDB step-by-step debugging, and printf value printing. This example shows only the possible scenarios to facilitate the demonstration of the fault locating procedure. During actual use, debug the code based on the actual situation.
Verify the functions in the CPU and check whether any error is reported in logs.
Write the running verification code on the CPU and verify the running. For details, see Project-based Operator Development. The accuracy comparison result of the CPU is as follows:
md5sum:
45e17ee4c068a655be2af4d8c3a1f191  output/golden.bin
5d6e1aec686b28bd3839dbcd5caaa8b2  output/output_y.bin
The precision of the CPU domain is also inconsistent. Check whether an error is reported in the log. You can search for the keyword failed. For example, as shown in the error message below, the issue occurs at the point in the code where the LeakyReLU API is called.
leakyrelu_custom_cpu: /home/workdir/AscendC/ddk/tikcpp/tikcfw/interface/kernel_operator_vec_binary_scalar_intf.h:447: void AscendC::LeakyRelu(const AscendC::LocalTensor<T>&, const AscendC::LocalTensor<T>&, const T&, const int32_t&) [with T = float16::Fp16T; int32_t = int]: Assertion `false && "check vlrelu instr failed"' failed
Generally, only the code line where the error is reported instead of the specific error can be located based on the preceding error logs. Use the GDB debugging mode or printf printing mode to further locate the fault.
Perform GDB debugging. The following example shows how to start the leakyrelu operator runtime program on the CPU, and the sample program directly throws an exception. Run the program with GDB and view the call stack information to analyze and locate the fault. In other scenarios, you can perform debugging using basic operations such as GDB breakpoint setting. For details about how to use GDB to debug Ascend C programs, see GDB Debugging.
- Use the GDB to start the program to be debugged and access the GDB interface for debugging.
gdb leakyrelu_custom_cpu
- Debug a subprocess separately.
(gdb) set follow-fork-mode child
- Run the program.
(gdb) r
- Run the bt command to view the program call stack.
(gdb) bt
- View the stack information of a specific layer and print the values of specific variables. In this example, the value of tileLength is 1024. In this program, 1024 half-type numbers need to be processed, and the size is 1024 x sizeof(half) = 2048 bytes. Input the value of Tensor xLocal. dataLen indicates that the size of the LocalTensor is 1024 bytes and only 1024-byte data can be computed. The preceding information indicates that the lengths of the two parameters do not match. Therefore, the fault can be located.
(gdb) f 5
 #5  0x000055555555d364 in KernelLeakyRelu::Compute (this=0x7fffffffd7d0, progress=0) at /root/AscendC_DemoCode-master/precision-error/vector/leakyrelu_custom.cpp:59
 59              LeakyRelu(yLocal, xLocal, scalar, tileLength);
 (gdb) p tileLength
 $1 = 1024
 (gdb) p xLocal
 $1 = {<AscendC::BaseTensor<float16::Fp16T>> = {<No data fields>}, address_ = {logicPos = 9 "\t", bufferHandle = 0x7fffffffd930 "\003\005\377\377", dataLen = 1024,bufferAddr = 0,absAddr = ...}}
- Use the GDB to start the program to be debugged and access the GDB interface for debugging.
Use printf to print logs. Add variable printing in a proper position. The sample code is as follows:
printf("xLocal size: %d\n", xLocal.GetSize());
printf("tileLength: %d\n", tileLength);
In the following log, tileLength is 1024. In this program, 1024 half-type numbers need to be processed. The size of Tensor xLocal is 512, indicating that only 512 half-type numbers can be computed. The preceding information indicates that the lengths of the two parameters do not match. Therefore, the fault can be located.
xLocal size: 512
tileLength: 1024
[h2]Symptom
An operator is used to add PRINTF printing to the kernel implementation code, but the tiling information obtained by the kernel is incorrect.
The added printing code is as follows:
PRINTF("tiling_data.totalLength: %d tiling_data.tileNum: %d.\n", tiling_data.totalLength, tiling_data.tileNum); The printed tiling data is all 0s:
tiling_data.totalLength: 0 tiling_data.tileNum: 0.
[h2]Root Cause
The possible causes are as follows:
The logic for computing tiling on the host is incorrect.
The parameters of the kernel function on the kernel are not set in the correct sequence.
[h2]Solution
Print TilingData and check whether it is correctly serialized on the host as follows. If the printed value is incorrect, the tiling computation logic may be incorrect. In this case, check the tiling implementation code on the host to check whether the computation logic is correct.
// Print the first parameter value of TilingData based on the actual data type. To verify other values, offset the value pointer backward.
std::cout<<*reinterpret_cast<uint32_t *>(context->GetRawTilingData()->GetData())<<std::endl;
If TilingData printed in the previous step is correct, check whether the parameters of the kernel function on the kernel are set in the correct sequence.
When you use the msOpGen tool to create an operator project and develop operators in the kernel based on the project, the definition template of the kernel function has been automatically generated by the msOpGen tool. The parameters are arranged in the sequence of "input, output, workspace, tiling". Check whether the parameter sequence is changed.
#include "kernel_operator.h"
extern "C" __global__ __aicore__ void add_custom(GM_ADDR x, GM_ADDR y, GM_ADDR z, GM_ADDR workspace, GM_ADDR tiling) {
    GET_TILING_DATA(tiling_data, tiling);// Obtain tiling parameters.
    // TODO: Implement the user kernel.
}
[h2]Symptom
The project-based operator development mode is used based on the custom operator project. The operator fails to be compiled, and the following error is reported:
[ERROR] [ascendxxxx] PowerCustom_88a695f03edfbc0af76b9eaae9e4556c error: out of jump/jumpc imm range
[h2]Root Cause
The cause of the compilation error is that the code of the operator kernel is too large. As a result, the offset value of the jump instruction exceeds the specified value (value range of int16_t) during compilation. You can add the compilation option -mllvm -cce-aicore-jump-expand=true to avoid this problem and ensure that the compiler can function properly.
[h2]Solution
In CMakeLists of the kernel, use add_ops_compile_options to add the compilation option -mllvm -cce-aicore-jump-expand=true for the operator that reports the error. The following is an example:
add_ops_compile_options(PowerCustom OPTIONS -mllvm -cce-aicore-jump-expand=true)
For details about how to use add_ops_compile_options, see Customizing Build Options.
Recompile the operator. The compilation is normal and no error is reported.
When there are optional inputs, the operator fails to be compiled, and an error message is displayed indicating that DTYPE_XX cannot be found.
[h2]Symptom
When tilingkey is used to set the code branch, the corresponding .omc file cannot be generated. For example, the ONNX model has two inputs, and the operator has four inputs x, y, m, and n, with two required and two optional. The tiling key is set to 2.
class KernelAddCustom_omc2 {
// ... ...
};

class KernelAddCustom_omc3 {
// ... ...
};

class KernelAddCustom_omc4 {
public:
    __aicore__ inline KernelAddCustom_omc4() {}
    __aicore__ inline void Init4(GM_ADDR x, GM_ADDR y, GM_ADDR m, GM_ADDR n, GM_ADDR z, uint32_t totalLength, uint32_t tileNum)
    {
        ASSERT(GetBlockNum() != 0 && "block dim can not be zero!");
        this->blockLength = totalLength / GetBlockNum();
        this->tileNum = tileNum;
        ASSERT(tileNum != 0 && "tile num can not be zero!");
        this->tileLength = this->blockLength / tileNum / BUFFER_NUM;

        xGm.SetGlobalBuffer((__gm__ DTYPE_X*)x + this->blockLength * GetBlockIdx(), this->blockLength);
        yGm.SetGlobalBuffer((__gm__ DTYPE_Y*)y + this->blockLength * GetBlockIdx(), this->blockLength);
        mGm.SetGlobalBuffer((__gm__ DTYPE_M*)m + this->blockLength * GetBlockIdx(), this->blockLength);
        nGm.SetGlobalBuffer((__gm__ DTYPE_N*)n + this->blockLength * GetBlockIdx(), this->blockLength);
        zGm.SetGlobalBuffer((__gm__ DTYPE_Z*)z + this->blockLength * GetBlockIdx(), this->blockLength);
        pipe.InitBuffer(inQueueX, BUFFER_NUM, this->tileLength * sizeof(DTYPE_X));
        pipe.InitBuffer(inQueueY, BUFFER_NUM, this->tileLength * sizeof(DTYPE_Y));
        pipe.InitBuffer(inQueueM, BUFFER_NUM, this->tileLength * sizeof(DTYPE_M));
        pipe.InitBuffer(inQueueN, BUFFER_NUM, this->tileLength * sizeof(DTYPE_N));
        pipe.InitBuffer(outQueueZ, BUFFER_NUM, this->tileLength * sizeof(DTYPE_Z));
    }
// ... ...
private:
    TPipe pipe;
    TQue<QuePosition::VECIN, BUFFER_NUM> inQueueX, inQueueY, inQueueM, inQueueN;
    TQue<QuePosition::VECOUT, BUFFER_NUM> outQueueZ;
    GlobalTensor<DTYPE_X> xGm;
    GlobalTensor<DTYPE_Y> yGm;
    GlobalTensor<DTYPE_M> mGm;
    GlobalTensor<DTYPE_N> nGm;
    GlobalTensor<DTYPE_Z> zGm;
    uint32_t blockLength;
    uint32_t tileNum;
    uint32_t tileLength;
};


extern "C" __global__ __aicore__ void add_custom_omc(GM_ADDR x, GM_ADDR y, GM_ADDR m, GM_ADDR n, GM_ADDR z, GM_ADDR workspace, GM_ADDR tiling) {
    GET_TILING_DATA(tiling_data, tiling);
    if (TILING_KEY_IS(2)){
        KernelAddCustom_omc2 op;
        op.Init2(x, y, z, tiling_data.size, 4);
        op.Process2();
    } else if (TILING_KEY_IS(3)){
        KernelAddCustom_omc3 op;
        op.Init3(x, y, m, z, tiling_data.size, 4);
        op.Process3();
    }else if (TILING_KEY_IS(4)){
        KernelAddCustom_omc4 op;
        op.Init4(x, y, m, n, z, tiling_data.size, 4);
        op.Process4();
    }
}
The .omg model fails to be converted, and the following error message is displayed:
ddk/ascendc/ops/impl/custom/add_custom_omc.cpp:165:37: error: unknown type name "DTYPE_N"
        nGm.SetGlobalBuffer((__gm__ DTYPE_N*)n + this->blockLength * GetBlockIdx(), this->blockLength);
                                    ^
ddk/ascendc/ops/impl/custom/add_custom_omc.cpp:169:73: error: use of undeclared identifier "DTYPE_M"
        pipe.InitBuffer(inQueueM, BUFFER_NUM, this->tileLength * sizeof(DTYPE_M));
                                                                        ^
[h2]Root Cause
If the model has only two inputs x and y, only the corresponding macros DTYPE_X and DTYPE_Y are generated, and DTYPE_M and DTYPE_N are not generated.
[h2]Solution
Isolation using compilation macros:
#if defined (DTYPE_M) && defined (DTYPE_N)
class KernelAddCustom_omc4 {
// ... ...
};
#endif [h2]Solution
Run the following command to obtain the tool installation path:
which ascendebug

Generally, the default path of ascendebug is {INSTALL_DIR}/tools/tools_ascendc/package/ascendebug. Replace ${INSTALL_DIR} with the file storage path after the DDK is installed.
Open the startup script of ascendebug (the default path is used as an example).
vim ${INSTALL_DIR}/tools/tools_ascendc/package/ascendebugAdd the GDB debugging command to the startup script.
Example:
main() {
    check_env $LD_LIBRARY_PATH
    ret1=$?
    check_env $PATH
    ret2=$?
    check_env $TOOLCHAIN_HOME
    ret3=$?
    if [ $ret1 -eq 1 ] || [ $ret2 -eq 1 ] || [ $ret3 -eq 1 ]; then
        echo "Please make sure source the correct cann package setenv.bash only. you can open a new window,and restart"
        exit 0
    fi
    export _ASCENDC_DEBUG_TOOL_INSTALL_PATH=${DIR%%latest*}
    gdb --ex r --args python3 -m ascendebug.cmd $@
}
[h2]Problem Description
When the tool is used for operator debugging, the following error messages are displayed:
error: User specified two different cann Installation package path: {PATH_A} and {PATH_B}
error: User specified two different cann Installation package path: {PATH_A} and {PATH_B}
error: User specified two different cann Installation package path: {PATH_A} and {PATH_B}
Please make sure source the correct cann package setenv.bash only. you can open a new window,and restart [h2]Solution
Check whether the environment variables in the current operating environment are set repeatedly. The default path of the environment variable file is ${INSTALL_DIR}/ddk/tools/tools_ascendc/set_ascendc_env.sh.
If they are set repeatedly, open a new terminal window and set the environment variables by referring to Environment Setup.
[h2]Problem Description
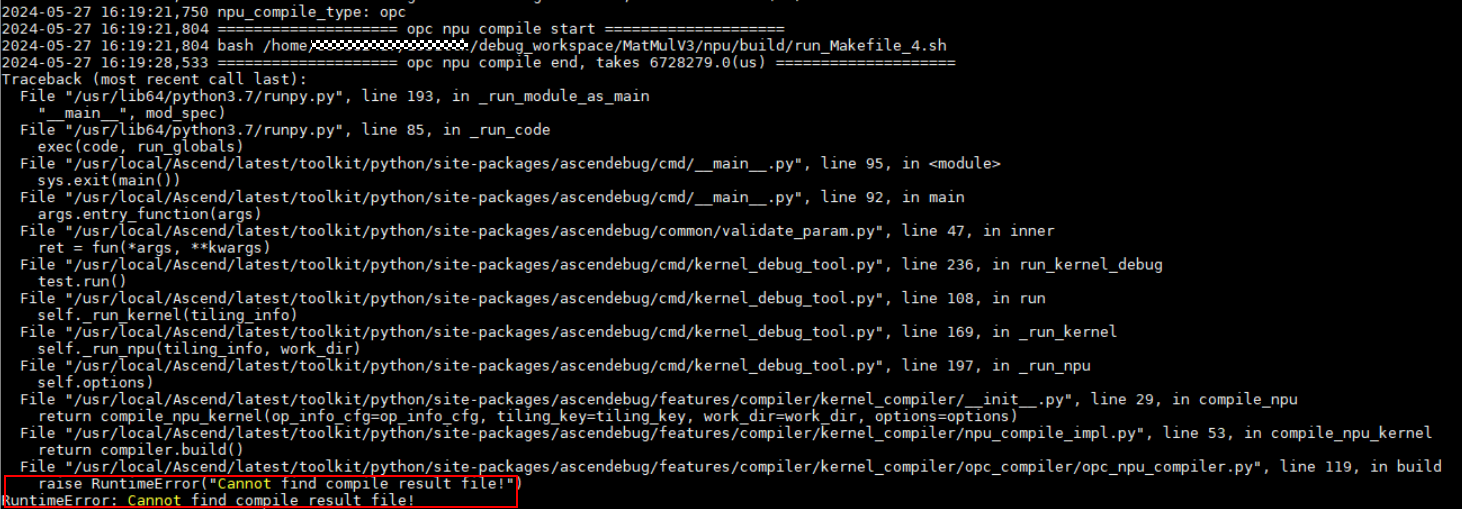
In OPC compilation mode, a kernel compilation error is reported, as shown in Figure 1.
Figure 1 Error example
[h2]Solution
Set the environment variables.
Open the ascendc environment variable file in any terminal window. The default path is ${INSTALL_DIR}/tools/tools_ascendc/set_ascendc_env.sh. Set the following variables to enable the log printing level:
export ASCEND_GLOBAL_LOG_LEVEL=3         # Set the log level to ERROR.
export ASCEND_SLOG_PRINT_TO_STDOUT=1     # If log display on the screen is enabled, log messages will not be saved in a log file.
Obtain the log file.
In CLI mode, the log storage address is specified by the simulator simulation parameter. The default value is debug_op.log of the current operation path. Open the log file in the actual path.
Truncate the debugging command, run the command again, and analyze it.
- Find the keyword opc npu compile start in the debug_op.log file.
Copy the command following opc npu compile start, as shown in Figure 2. Run the command in the terminal window, and further analyze the problem based on the log file displayed on the screen or flushed to the disk.
Figure 2 NPU compilation command

NPU Compilation Fails and the Message " RuntimeError: Cannot get compiling bash file!" Is DisplayedMaybe template json does not match
[h2]Problem Description
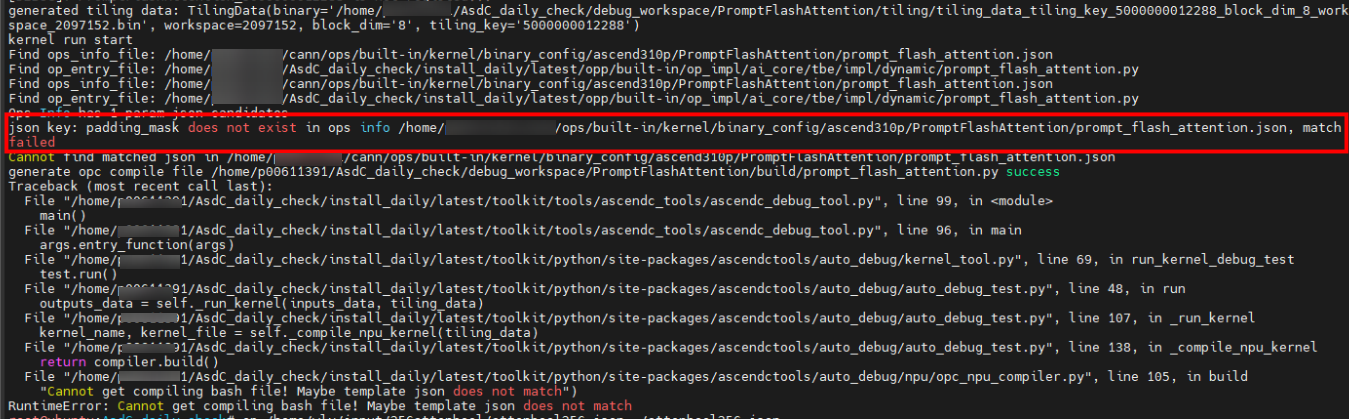
In OPC compilation mode, a kernel compilation error is reported, as shown in Figure 3.
Figure 3 Error example
[h2]Possible Causes
The operator .json configuration file entered is inconsistent with the operator .json template configuration in the custom operator project. For example, the input and output dtypes are different.
[h2]Solution
If the .json template of the operator to be debugged can be changed:
Modify the operator .json configuration file to ensure that it is consistent with the operator .json template configuration in the custom operator project.
For example, in the error example shown in Figure 3, change padding_mask in the .json file to pse_shift corresponding to the template.
[h2]Problem Description
The kernel execution is complete, but an error message is displayed, indicating that the output file is not found.
[h2]Possible Causes
The kernel of the CPU or Simulator fails to be executed. As a result, no output file is generated in the output path.
[h2]Solution
Set the environment variables.
Open the ascendc environment variable file in any terminal window. The default path is ${INSTALL_DIR}/tools/tools_ascendc/set_ascendc_env.sh. Set the following variables to enable the log printing level:
export ASCEND_GLOBAL_LOG_LEVEL=3         # Set the log level to ERROR.
export ASCEND_SLOG_PRINT_TO_STDOUT=1     # If log display on the screen is enabled, log messages will not be saved in a log file.
Obtain the log file.
In CLI mode, the log storage address is specified by the NPU debugging parameter. The default value is debug_op.log of the current operation path. Open the log file in the actual path.
Truncate the CPU or Simulator debugging command, run the command again, and analyze it.
- Find the keyword cpu kernel run start or npu kernel run start in the debug_op.log file.
- Copy all commands following the keyword and run them in the terminal window. Further analyze the problem based on the log file displayed on the screen or flushed to the disk.
[CONSOLE] ascendc_debug_tool [3626213] 2024-05-21 19:15:35,513 ==================== cpu kernel run start ====================
[CONSOLE] ascendc_debug_tool [3626213] 2024-05-21 19:15:35,513 execute_cmd: bash -c "cd /home/ascendebug_smoking_test/op_contrib/api_opcontrib_case/ForeachSigmoid/cpu/build && ./foreach_sigmoid_cpu | tee -a /home/ascendebug_smoking_test/op_contrib/api_opcontrib_case.log && cd -"
cpu run start
[CONSOLE] ascendc_debug_tool [3626213] 2024-05-21 19:15:36,046 ==================== npu kernel run start ====================
[CONSOLE] ascendc_debug_tool [3626213] 2024-05-21 19:15:36,046 /home/run_pkg/latest/toolkit/tools/ascendc_tools/npu_kernel_launch/npu_kernel_launch --kernel /home/ascendebug_smoking_test/op_contrib/data/op-contrib/build_out/binary/${chip_version}/bin/foreach_sigmoid/ForeachSigmoid_0885a6586f8e7f8dc8d03c4dabc73ef4_high_performance.o --name ForeachSigmoid --json_file /home/ascendebug_smoking_test/op_contrib/api_opcontrib_case/ForeachSigmoid/data/ForeachSigmoid.json --input_path /home/ascendebug_smoking_test/op_contrib/api_opcontrib_case/ForeachSigmoid/data --output_path /home/ascendebug_smoking_test/op_contrib/api_opcontrib_case/ForeachSigmoid/npu/output --tiling_data /home/ascendebug_smoking_test/op_contrib/api_opcontrib_case/ForeachSigmoid/tiling/tiling_data_tiling_key_1_block_dim_1_workspace_33554432.bin --tiling_key 1 --workspace 33554432 --block_dim 1 --timeout 600 --device 0 --core_type VectorCore --arg_lib /home/ascendebug_smoking_test/op_contrib/api_opcontrib_case/ForeachSigmoid/npu/build/launch_args.so
kernel name: ForeachSigmoid
kernel file: /home/ascendebug_smoking_test/op_contrib/data/op-contrib/build_out/binary/${chip_version}/bin/foreach_sigmoid/ForeachSigmoid_0885a6586f8e7f8dc8d03c4dabc73ef4_high_performance.o
json file: /home/ascendebug_smoking_test/op_contrib/api_opcontrib_case/ForeachSigmoid/data/ForeachSigmoid.json
// ...
[h2]Problem Description
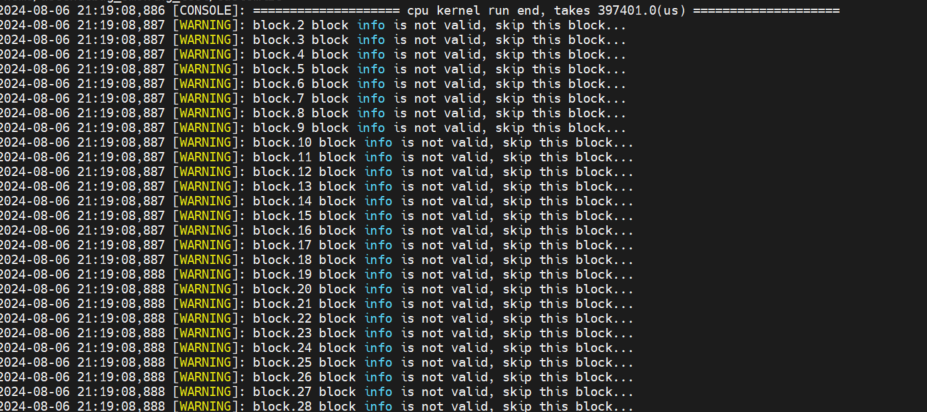
After the printf/PRINTF/DumpTensor/DumpAccChkPoint/assert printing function is enabled, "block info is not valid, skip this block" is displayed during code execution, and no information is displayed.
[h2]Possible Causes
The code for printing the dump tensor is not executed in the block where the error is reported. Take CPU debugging as an example. As shown in Figure 4, the dump and print operations are not performed on the blocks 32 to 70. The data corresponding to the block cannot be obtained when the corresponding .bin file is parsed. Therefore, the data of the block is invalid and the printing is skipped.
Figure 4 Error example
[h2]Solution
Check the operator implementation code and ensure that printf/PRINTF/DumpTensor/DumpAccChkPoint/assert has been executed in the core.
[h2]Problem Description
Although the printing function is enabled during kernel code debugging, error information or no information is printed no matter how the code is modified.
[h2]Possible Causes
The operator kernel code exits abnormally during execution, so no information is displayed.
The last execution logs are not cleared. The truth value comparison and dump parsing modules read residual files based on their paths and output incorrect values.
[h2]Solution
Clear the residual log files in the system.
Delete the debugging result directory (specified by --work-dir) generated last time, including the log file flushed to disk. The default file is debug_op.log in the current operation path.
Perform CPU or Simulator debugging again.
View the latest log file and analyze the problem based on the warning and error logs.
[h2]Problem Description
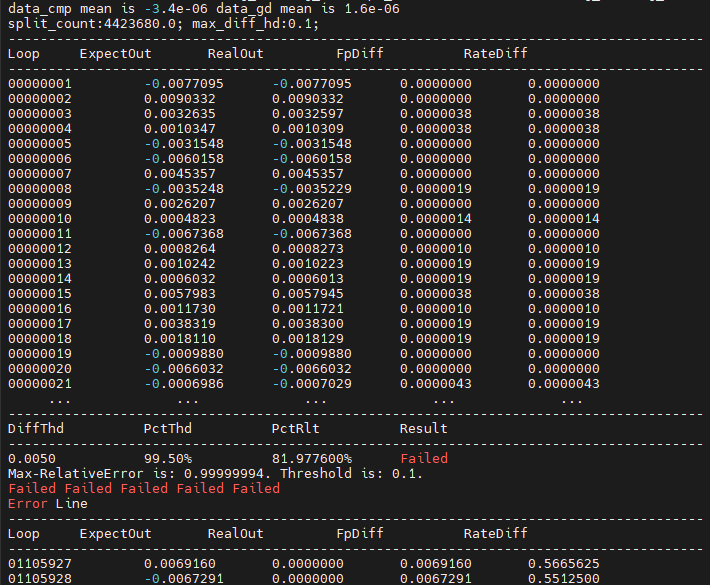
In the accuracy comparison result file generated during CPU or Simulator debugging, Failed is displayed and some output values are 0, as shown in Figure 5.
Figure 5 Accuracy comparison result file
[h2]Possible Causes
The block_num specified by the operator is not fully utilized. As a result, some outputs are 0.
[h2]Solution
Check the value of block_num in the tiling file or check whether the value of --block-num is proper. Ensure that the value meets the computing requirements of the operator.
[h2]Problem Description
An error is reported during tiling debugging, and this fault needs to be located through logs.
[h2]Possible Causes
The tiling code is incorrect or the input configuration (such as the data or .json configuration file of the operator) is incorrect.
[h2]Solution
Obtain the log file.
In CLI mode, the log storage address is specified by the NPU debugging parameter. The default value is debug_op.log of the current operation path. Open the log file in the actual path.
Truncate the tiling debugging command, run the command again, and further locate the tiling code fault as prompted.
- Find the keyword gen_tiling_data_cmd in the debug_op.log file.
- Copy all commands following gen_tiling_data_cmd, run the commands in the terminal window, and further analyze the problem based on the log file displayed on the screen or flushed to disk.

Before running this command, ensure that the Environment Setup of the current terminal is set and effective.
[CONSOLE] ascendc_debug_tool [4149480] 2024-06-03 15:57:42,364 ==================== generate tiling data start ====================
 [CONSOLE] ascendc_debug_tool [4149480] 2024-06-03 15:57:42,364 gen_tiling_data_cmd:
 /home/install_daily/latest/toolkit/tools/ascendc_tools/ascendc_tiling_tool /home/install_daily/latest/opp/built-in/op_impl/ai_core/tbe/op_tiling/lib/linux/aarch64/liboptiling.so FlashAttentionScore ${chip_version} /home/ascendebug_smoking_test/ops_adv/adt_biprof/FlashAttentionScore/tiling/tiling_data.bin /home/ascendebug_smoking_test/ops_adv/adt_biprof/FlashAttentionScore/tiling/tiling_run_info.bin /home/ascendebug_smoking_test/ops_adv/adt_biprof/FlashAttentionScore/tiling/inputs.json /home/ascendebug_smoking_test/ops_adv/adt_biprof/FlashAttentionScore/tiling/outputs.json /home/ascendebug_smoking_test/ops_adv/adt_biprof/FlashAttentionScore/tiling/attrs.json
 [CONSOLE] ascendc_debug_tool [4149480] 2024-06-03 15:57:42,917 ==================== generate tiling data end, takes 552974.0(us) ====================
[h2]Problem Description
It takes a long time for CAModel to simulate the operator performance until the debugging fails.
[h2]Possible Causes
Hardware resources are limited, and multiple tasks preempt resources. As a result, CAModel runs slowly.
The hardware performance is not enough to support operator simulation.
The input/output shape of the operator is too large. As a result, the CAModel simulation duration increases sharply.
The CAModel simulation parameters are not properly set. For example, the value of block_num is too large.
[h2]Solution
Suggestion 1: Prevent multiple tasks from preempting hardware resources at the same time to guarantee the running effect of the CAModel main task.
Suggestion 2: Improve the hardware performance to meet the following requirements:
- Server: x86 physical server or computing cloud (x86 is supported currently)
- Number of CPU cores: The recommended number is greater than 16.
- Memory: The recommended size is greater than 64 GB.
- Hard disk: The recommended size is greater than 2 TB.
Suggestion 3: Decrease the input/output shape of the operator to reduce the simulation data amount.
Suggestion 4: Set the CAModel simulation parameters by referring to simulator simulation parameters. For example, you are advised to set block_num to 1.