[h2]Function Description
Operator performance can be simulated on the simulator. Currently, the CAModel simulator is supported.

- Due to the model accuracy issues, it is recommended that CAModel run only on a single core, which contributes to accurate simulation performance. If CAModel runs on multiple cores, it will lead to slow simulation performance and large error.
[h2]Procedure (CLI-based)
The key steps for performing performance simulation using the CLI are as follows:
Set up the environment and prepare the input/golden data file.
Run the following command to perform CAModel performance simulation. Only key parameters are provided. For details about other parameters, see Simulator Parameters.
ascendebug kernel --backend simulator --repo-type customize --json-file ${op_config_json_file} --core-type ${core_type} --chip-version ${chip_version} --work-dir ${work_dir} --block-num 1 --timeout 1200 ... { Other parameters}Generally, CAModel simulation runs slowly. Usually, --timeout is set to 1200 seconds, and --block-num is set to 1. Set them as required.
View the performance simulation result. For details, see Product Description.
[h2]Artifact Description
The CAModel simulation result is stored in the ${root}/${work_dir}/simulator directory. ${root} indicates the current operation path, ${work_dir} indicates the debugging workspace which defaults to the /debug_workspace/${op_type} directory, and ${op_type} indicates the operator name. The directory structure is as follows:
├ ${op_type} // Operator name
├── simulator
│   ├── build // Directory for storing the intermediate files generated after NPU compilation
│   │   ├── launch_args.so
│   │   └── run_Makefile_0.sh
│   ├── dump
│   │   ├── camodel
│   │   │   ├── log // Model execution log
│   │   └── dump_data
│   │       ├── 0 // Core ID
│   │       │   └── index_0 // Index is the unique identifier of the desc of the dump API.
│   │       └── index_dtype.json
│   ├── output // Directory for storing the output file after NPU compilation and running
│   │   ├── z.bin // Original data output by running
│   │   └── z.txt // Accuracy comparison result file
│   └── src // Directory for storing the temporary code files generated after NPU compilation
│       └── _gen_args_${op_type}.cpp
Viewing performance simulation data
- The execution log debug_op.log is generated in the directory where the ascendebug command is executed.
- View the log and search for block finish. You can find logs similar to the following. In the logs, block_idx indicates the core sequence number of the chip, and total tick indicates the number of cycles executed by the kernel function. A larger value indicates a longer time consumed.
block finish -> block_idx: 0 total tick: 4153
Viewing the accuracy comparison result
In the output directory, check whether the output file (.bin) and accuracy comparison file (.txt) are generated.
Confirm the operator accuracy comparison result based on the accuracy comparison file (.txt).
The following shows an example of the accuracy comparison result, including the mean value, partial difference comparison, and final comparison conclusion (success or failure) of two data copies. If the result is failure, the data with the maximum difference is displayed.
data_cmp mean is -1.41e-05 data_gd mean is -1.41e-05
 split_count:2359296.0; max_diff_hd:0.1;
 ---------------------------------------------------------------------------------------
   Loop           ExpectOut        RealOut         FpDiff         RateDiff
 ---------------------------------------------------------------------------------------
 00000001         0.0395813       0.0395813       0.0000000       0.0000000
 00000002         0.0160980       0.0160980       0.0000000       0.0000000
 00000003         -0.0443420      -0.0443420      0.0000000       0.0000000
 00000004         -0.0847778      -0.0847778      0.0000000       0.0000000
 00000005         -0.0066605      -0.0066605      0.0000000       0.0000000
 00000006         0.0880737       0.0880737       0.0000000       0.0000000
 00000007         0.0848389       0.0848389       0.0000000       0.0000000
 00000008         0.1083374       0.1083374       0.0000000       0.0000000
 00000009         0.0838623       0.0838623       0.0000000       0.0000000
 00000010         0.0887451       0.0887451       0.0000000       0.0000000
 00000011         0.0572205       0.0572205       0.0000000       0.0000000
 00000012         0.0741577       0.0741577       0.0000000       0.0000000
 00000013         -0.0762329      -0.0762329      0.0000000       0.0000000
 00000014         -0.0957642      -0.0957642      0.0000000       0.0000000
 00000015         0.0102234       0.0102234       0.0000000       0.0000000
   ...               ...             ...             ...             ...
 ---------------------------------------------------------------------------------------
 DiffThd           PctThd          PctRlt          Result
 ---------------------------------------------------------------------------------------
 0.0050            99.50%          100.000000%     Pass
 Success Success Success Success Success
Table 1 Description of the accuracy comparison result
Item Description data_cmp mean Mean value of the output data. data_gd mean Mean value of the golden data. split_count Count of output data records. max_diff_hd Maximum difference threshold between the output data and golden data. Detailed comparison data display (partial) Loop (data position), ExpectOut (expected output value), RealOut (actual output value), FpDiff (absolute difference value), and RateDiff (relative difference value). Overall comparison result display DiffThd (relative difference threshold), PctThd (percentage threshold of data whose accuracy meets the requirement), PctRlt (percentage of data whose accuracy meets the requirement), and Result (comparison result). Error line display If the accuracy comparison result is Failed, detailed information about some data with large errors is displayed. (Optional) Viewing the dump result
If the DumpTensor Function or DumpAccChkPoint Function is enabled, the result file is stored in the dump directory. For details about the results, see Artifact Description.
[h2]Function Description
During CAModel operator simulation, dotting can be performed in any running phase of the operator, to analyze the pipeline chart of different instructions for further performance optimization.

Kirin 9020, Kirin 9030, and Kirin X90 do not support optimization using this method.
[h2]Usage
Add TRACE_START and TRACE_STOP to the target instruction positions in the kernel code. The following is an example. For details about the start and stop APIs, see Trace API Description.
TRACE_START(0x1);
DataCopy(zGm, zLocal, this->totalLength);
TRACE_STOP(0x1);
Execute the operator simulation process by referring to the CLI method in How to Use (CLI).
View the dotting result in the CAModel simulation result trace chart.
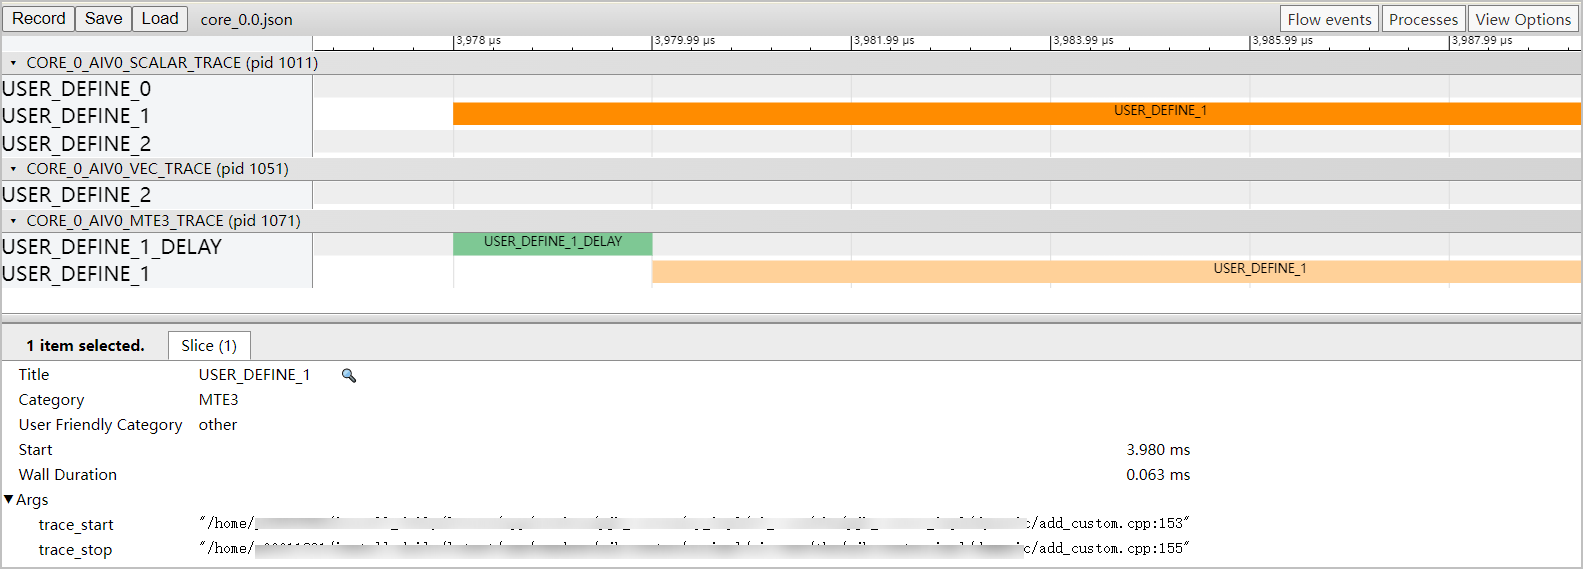
As shown in the following figure, USER_DEFINE_1_DELAY indicates the duration from the time when the DataCopy instruction is delivered to the time when the instruction starts to be executed, and USER_DEFINE_1 indicates the time when the instruction is executed.
Figure 1 Simulation breakpoints
[h2]Trace APIs
The description of the TRACE_START API is as follows:
Function prototype: #define TRACE_START(apid)
Function usage: Sets a breakpoint at the start position.
Parameter (IN): apid. Currently, the following 10 developer-defined types are reserved:
- 0x0: USER_DEFINE_0
- 0x1: USER_DEFINE_1
- 0x2: USER_DEFINE_2
- 0x3: USER_DEFINE_3
- 0x4: USER_DEFINE_4
- 0x5: USER_DEFINE_5
- 0x6: USER_DEFINE_6
- 0x7: USER_DEFINE_7
- 0x8: USER_DEFINE_8
- 0x9: USER_DEFINE_9
Parameter (OUT): N/A
Return value: N/A
Restrictions:
- TRACE_START and TRACE_STOP must be used together. If no log is displayed on the trace chart, they are not paired.
- This API cannot be used across cores. For example, if TRACE_START is logged in the AI Cube, TRACE_STOP must also be recorded in the AI Cube instead of the AI Vector.
Calling example:
TRACE_START(0x2);
Add(zLocal, xLocal, yLocal, dataSize);
TRACE_STOP(0x2);
The description of the TRACE_STOP API is as follows:
Function prototype: #define TRACE_STOP(apid)
Function usage: Sets a breakpoint at the stop position.
Input parameter: apid. The value must be the same as that of the TRACE_START API parameter. Otherwise, the dotting result is affected.
Parameter (OUT): None
Return value: N/A
Restrictions:
- TRACE_START and TRACE_STOP must be used together. If no log is displayed on the trace chart, they are not paired.
- This API cannot be used across cores. For example, if TRACE_START is logged in the AI Cube, TRACE_STOP must also be recorded in the AI Cube instead of the AI Vector.
Calling example:
TRACE_START(0x2);
Add(zLocal, xLocal, yLocal, dataSize);
TRACE_STOP(0x2);