Overview
hiprofiler provides the performance profiling capabilities for you to analyze memory and performance issues.
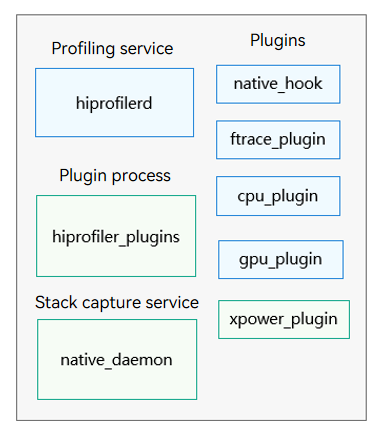
Its overall architecture comprises the profiling data display page on the PC and performance profiling service on the device. The PC and device services use the C/S model. The profiling data on the PC is displayed on the DevEco Studio and SmartPerf pages. The device program consists of multiple parts that run in the system environment. The hiprofilerd process communicates with DevEco Studio to provide profiling services. The device also contains the CLI tool (hiprofiler_cmd) and data collection process (hiprofiler_plugins). Based on the Producer-Consumer model, the profiling service controls the data collection process to obtain profiling data and sends the data to DevEco Studio. Currently, plugins such as nativehook, CPU, ftrace, GPU, hiperf, xpower, and memory have been implemented, providing comprehensive profiling capabilities for CPU, GPU, memory, and power consumption.
Benchmarking with profilers in the industry, hiprofiler provides more capabilities. For details, see Plugin Parameters, including cross-language stack unwinding, power consumption data obtaining, and long-time heap memory stack capturing.
Environment Requirements
-
The environment for HarmonyOS Device Connector (hdc) has been set up. For details, see Environment Setup.
-
The devices are properly connected and hdc shell is executed.
Architecture
-
The PC calls the hiprofiler_cmd tool on DevEco Studio or SmartPerf.
-
The hiprofiler_cmd process starts the hiprofilerd service and the hiprofiler_plugins process.
-
hiprofiler_plugins enables the corresponding plugin and summarizes the obtained profiling data to the hiprofilerd process.
-
The hiprofilerd process stores the profiling data in proto format to a file, or returns it to the PC in real time.
-
The PC parses the data, generates lanes, and displays the obtained profiling data.
Command Syntax
You can use hiprofiler_cmd to call different plugins and input different parameters for different profiling requirements. The following is an example command:
$ hiprofiler_cmd \
  -c - \
  -o /data/local/tmp/hiprofiler_data.htrace \
  -t 30 \
  -s \
  -k \
  --nonblock \
<<CONFIG
 request_id: 1
 session_config {
  buffers {
   pages: 16384
  }
 }
 plugin_configs {
  plugin_name: "ftrace-plugin"
  sample_interval: 1000
  config_data {
   hitrace_categories: "binder"
   buffer_size_kb: 204800
   flush_interval_ms: 1000
   flush_threshold_kb: 4096
   trace_period_ms: 200
  }
 }
CONFIG | Command | Description |
|---|---|
| -c | After setting this option, you need to place the configuration file in the /data/local/tmp directory and input the path. |
| -o | Custom file save path (must start with /data/local/tmp). If no path is set, the tuning data is automatically saved to /data/local/tmp/hiprofiler_data.htrace. Repeated tuning overwrites the file at the original path. When capturing the composite heap debug log, the custom save path must be a file with the .zip suffix. If no path is set, the composite heap debug log is automatically saved to /data/local/tmp/hiprofiler_data_{timestamp}.zip. |
| -k | Kills the existing profiling service process. |
| -s | Starts the profiling service process. |
| -t | Sets the profiling duration, in seconds. If you need to control the collection duration manually, use the start/stop command combination. |
| --nonblock | Sets hiprofiler_cmd to run in non-blocking mode. After the command is executed, hiprofiler_cmd runs in the background and other commands can be executed. If this parameter is not set, hiprofiler_cmd will block the execution until it is complete. Note: This parameter is supported since API version 23. |
| start | After this option is set, profiling continues until you run the hiprofiler_cmd stop command. Use this command in the format hiprofiler_cmd start params, where params indicates other parameters passed to hiprofiler_cmd. This option cannot be used together with -t. For details, see Common Commands. Note: This parameter is supported since API version 24. If hiprofiler_cmd stop is not executed after profiling starts, profiling ends automatically after 3600 seconds. |
| stop | Stops profiling that was started by the start command. Note: This parameter is supported since API version 24. The start and stop commands must be used in pairs to avoid repeatedly starting or stopping profiling. |
After inputting the hiprofiler_cmd parameter, input the plugin configuration information, which starts with <<CONFIG and ends with CONFIG. The configuration varies depending on the plugin. For details, see Plugin Parameters.
The following table describes the session config fields.
| Field | Description |
|---|---|
| buffers | Number of shared memory pages. |
| split_file | Whether to split a file. The value true means to split the file, and false means the opposite. |
| split_file_max_size_mb | Maximum size of each split file when split_file is set to true. |
The following table describes the plugin_configs fields.
| Field | Description |
|---|---|
| plugin_name | Name of the plugin to enable. |
| sample_interval | Interval for the plugin to obtain profiling data, in milliseconds. |
| config_data | Parameters of the plugin. The parameters required by each plugin are different. For details, see the proto definition of the plugins. (The code path is developtools/profiler/protos.) |
Download the generated trace file to the local PC by running the hdc file recv command, and then upload the file to SmartPerf or DevEco Studio for parsing.
Plugins Supported
| Name | Description | Specifications |
|---|---|---|
| native hook | Obtains the call stack information about heap memory allocation. | Only applications signed by the debug certificate can be collected. |
| ftrace plugin | Obtains the trace events of kernel logging and the HiTrace logging data. | - |
| cpu plugin | Obtains the CPU usage information of a process, including the process-level and thread-level usage. | - |
| gpu plugin | Obtains the GPU usage information of a process. | - |
| xpower plugin | Obtains the power consumption information of a process. | - |
| memory plugin | Obtains the memory usage of a process, primarily the data from its smaps node. | - |
| diskio plugin | Obtains the disk space usage of a process. | - |
| network profiler | Obtains the detailed HTTP/HTTPS request information of a process through process logging. | Only applications signed by the debug certificate can be collected. |
| network plugin | Obtains the network traffic statistics of a process. | - |
| hisysevent plugin | Obtains the HiSysEvent event data by running the HiSysEvent commands. | - |
| hidump plugin | Obtains the related data by running the SP_daemon commands. | - |
Applications Signed by the Debug Certificate

Run the hdc shell "bm dump -n bundlename | grep appProvisionType" command to check whether the application specified in the command is a debug-type application. The expected output is "appProvisionType": "debug".
For example, run the following command to check the bundle name com.example.myapplication:
hdc shell "bm dump -n com.example.myapplication | grep appProvisionType"
If the application is a debug-type application, the following information is displayed:
"appProvisionType": "debug",
To build a debug application, you need to use a debug certificate for signature. For details about how to request and use the debug certificate, see Requesting a Debug Certificate.
[h2]nativehook
Obtains the call stack information of heap memory allocations (by the malloc, mmap, calloc or realloc function), cross-language allocations (for example, native heap memory allocated by the Node-API in ArkTS), and unreleased heap memory due to memory leaks.

After app code protection is enabled, only native stacks can be unwound. JS stacks cannot be unwound.
Parameters
| Name | Type | Description | Details |
|---|---|---|---|
| fp_unwind | bool | Whether to enable stack unwinding in fp mode. The value true means to enable stack unwinding in fp mode. The value false means to enable stack unwinding in dwarf mode. | The stack unwinding in fp mode is implemented by using the x29 register, in which the function fp always points to the parent function (caller) fp. After stack unwinding, the profiling service calculates the relative PC based on the instruction pointer (IP) and searches for the corresponding mapping in maps for symbolization. Due to increasingly aggressive compiler optimizations, register reuse and disabled fp can cause stack unwinding in fp mode to fail. In mixed stacks, the fp alone cannot capture all frames, so dwarf is required for more accurate stack unwinding. The stack unwinding in dwarf mode is to search for the corresponding mapping information in the map table based on the PC register. The performance of dwarf is worse than that of fp because the call stack is parsed level by level in dwarf mode. Note: fp stack unwinding does not support profiling for non-AArch64 devices. |
| statistics_interval | int | Statistics interval, in seconds. Stacks in a statistics interval are summarized. | The statistics stack capture mode is provided to implement long-term lightweight collection. If profiling performance is a priority and you only need call counts and total stack size, use statistics mode. |
| process_name | string | Name of the process for which memory profiling is to be performed. | The value must be the same as the process name in the /proc/ node. |
| startup_mode | bool | Whether to capture the memory during process startup. By default, the memory during process startup is not captured. | This parameter records the heap memory allocation information during the period from the start of process incubation to the end of optimization. |
| js_stack_report | int | Whether to enable cross-language stack unwinding. The value 0 means not to capture the JS stack. The value 1 means to capture the JS stack. | This parameter provides the cross-language stack unwinding feature for the Ark environment. |
| malloc_free_matching_interval | int | Matching interval, in seconds. malloc and free are matched within the interval. If matched, the stack is not flushed to the disk. | Within the matching interval, allocated and released call stacks are not recorded, reducing the overhead of the stack-capturing service process. If this parameter is set to a value greater than 0, set statistics_interval to 0. |
| offline_symbolization | bool | Whether to enable offline symbolization. The value true means to enable offline symbolization; the value false means the opposite. | When offline symbolization is used, the operation of matching symbols based on IP is performed on SmartPerf, reducing process freezes during profiling. However, since the offline symbol table is written into the trace file, the trace file generated under offline symbolization is larger in size than that under online symbolization. |
| sample_interval | int | Sampling size. | When this parameter is set, the sampling mode is enabled. In sampling mode, malloc allocations smaller than the sampling size are accounted for probabilistically. The larger the call-stack allocation size, the more frequently it occurs and the greater its chance of being sampled. |
| restrace_tag | string | Type of resource to capture. | This parameter can be added multiple times with different types. For currently supported types, see restrace_tag Parameter Details. |
| use_file_cache_mode | bool | Whether to enable file cache mode. The value true means to enable file cache mode. The value false means the opposite. The default value is false. | File cache mode improves the collection performance of memory allocation information by flushing cached data to disk, effectively reducing possible stutters in the application process during memory information collection. Note: This parameter is supported since API version 24. |
| async_stack_enable | bool | Whether to capture async stacks. The value true means to enable async stack capture. The value false means to disable async stack capture. | The default value is false. Note: This parameter is supported since API version 24. |
| async_type | AsyncFlagType | Type of async stack supported by the current system. | This parameter takes effect only when async_stack_enable is true. By default, all async stack types are captured. For currently supported types, see async_type Parameter Details. Note: This parameter is supported since API version 24. |
| discard_destroyed_traces | bool | Whether to discard call stack data for released memory. The value true means to discard released call stack data as much as possible and retain unreleased call stack data. The value false means to retain all allocation and release call stack data. The default value is false. | When this parameter is set to true, the performance impact on the profiled application can be reduced. Note: This capability takes effect only within a statistics interval or file cache interval. The plugin tries to match and discard call stack data for released memory. If the data has already been persisted, it cannot be discarded. When shared memory mode (use_file_cache_mode = false) and detail mode (statistics_interval = 0) are both enabled, call stack data for released memory cannot be discarded. Note: This parameter is supported since API version 26.0.0. |
[h2]restrace_tag Parameter Details
| Name | Resource Type | Supported Since |
|---|---|---|
| RES_GPU_VK | GPU memory allocation stack of the Vulkan type. | 21 |
| RES_GPU_GLES_BUFFER | GPU memory allocation stack of the OpenGL ES buffer type. | 21 |
| RES_GPU_GLES_IMAGE | GPU memory allocation stack of the OpenGL ES image type. | 21 |
| RES_GPU_CL_BUFFER | GPU memory allocation stack of the OpenCL buffer type. | 21 |
| RES_GPU_CL_IMAGE | GPU memory allocation stack of the OpenCL image type. | 21 |
| RES_FD_OPEN | Call stack of the handle function when open is called. | 23 |
| RES_FD_EPOLL | Call stack of the handle function when epoll is called. | 23 |
| RES_FD_EVENTFD | Call stack of the handle function when eventfd is called. | 23 |
| RES_FD_SOCKET | Call stack of the handle function when socket or socketpair is called. | 23 |
| RES_FD_PIPE | Call stack of the handle function when pipe is called. | 23 |
| RES_FD_DUP | Call stack of the handle function when dup is called. | 23 |
| RES_FD_ALL | Call stacks of handle functions for all fd-related calls listed above. | 23 |
| RES_THREAD_PTHREAD | Call stack when a thread is created. | 23 |
| RES_THREAD_ALL | Call stacks for all thread-related operations listed above. | 23 |
| RES_ARKTS_HEAP_MASK | ArkTS memory allocation stack. | 23 |
| RES_JS_HEAP_MASK | JSVM memory tracing. | 23 |
| RES_SO_MASK | SO memory allocation stack. | 23 |
| RES_ASHMEM_MASK | ashmem memory allocation stack. | 23 |
| RES_DMABUF_MASK | dmabuf memory allocation stack. | 23 |
| RES_ARK_GLOBAL_HANDLE | Ark global handle allocation stack. | 23 |
| RES_VMA_ARKWEB | Memory tracing for the ArkWeb PA allocator. | 23 |
| RES_ARK_LOCAL_HANDLE | Ark local handle allocation stack. | 23 |
| RES_COMPOSITE_HEAP | Composite heap debug log, which includes the call stack trace, heap snapshot rawheap, and map mapping file. | 26.0.0 |
[h2]async_type Parameter Details
| Name | Description | Supported Since |
|---|---|---|
| LIBUV_SEND | Async stacks generated by calls through third-party libuv APIs. | 24 |
| FFRT_POOL | Async stacks generated by the built-in FFRT thread pool. | 24 |
| FFRT_QUEUE | Async stacks generated by the built-in FFRT queue. | 24 |
| EVENTHANDLER | Async stacks generated by HarmonyOS Event Handler. | 24 |
| PROMISE | Async stacks generated by the JavaScript Promise mechanism. | 24 |
| ARKTS_WORKER | Async stacks generated by ArkTS worker threads. | 24 |
| ARKTS_TASKPOOL | Async stacks generated by the ArkTS task pool. | 24 |
Result analysis
The fp stack unwinding and cross-language stack unwinding are enabled (green frames denote JavaScript).

Set fp_unwind to true.
Set js_stack_report to 1. Otherwise, the JS stack cannot be unwound.
$ hiprofiler_cmd \
  -c - \
  -o /data/local/tmp/hiprofiler_data.htrace \
  -t 60 \
  -s \
  -k \
<<CONFIG
 request_id: 1
 session_config {
  buffers {
   pages: 16384
  }
 }
 plugin_configs {
  plugin_name: "nativehook"
  sample_interval: 5000
  config_data {
   save_file: false
   smb_pages: 16384
   max_stack_depth: 20
   process_name: "com.example.insight_test_stage"
   string_compressed: true
   fp_unwind: true
   blocked: true
   callframe_compress: true
   record_accurately: true
   offline_symbolization: true
   startup_mode: false
   js_stack_report: 1
   max_js_stack_depth: 20
  }
 }
CONFIG 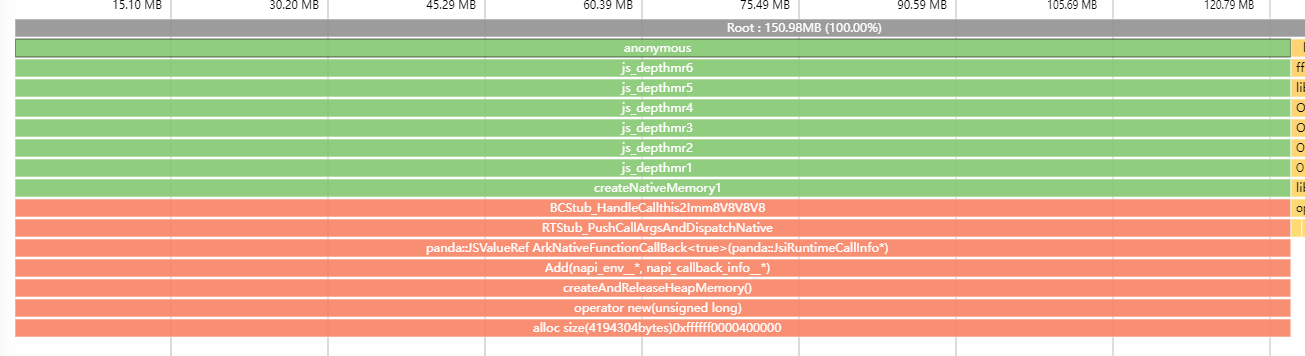
The dwarf stack unwinding and cross-language stack unwinding are enabled (native -> JS -> native stack frames are displayed).

Set fp_unwind to false.
Set js_stack_report to 1. Otherwise, the JS stack cannot be unwound.
$ hiprofiler_cmd \
  -c - \
  -o /data/local/tmp/hiprofiler_data.htrace \
  -t 60 \
  -s \
  -k \
<<CONFIG
 request_id: 1
 session_config {
  buffers {
   pages: 16384
  }
 }
 plugin_configs {
  plugin_name: "nativehook"
  sample_interval: 5000
  config_data {
   save_file: false
   smb_pages: 16384
   max_stack_depth: 20
   process_name: "com.example.insight_test_stage"
   string_compressed: true
   fp_unwind: false
   blocked: true
   callframe_compress: true
   record_accurately: true
   offline_symbolization: true
   startup_mode: false
   js_stack_report: 1
   max_js_stack_depth: 20
  }
 }
CONFIG 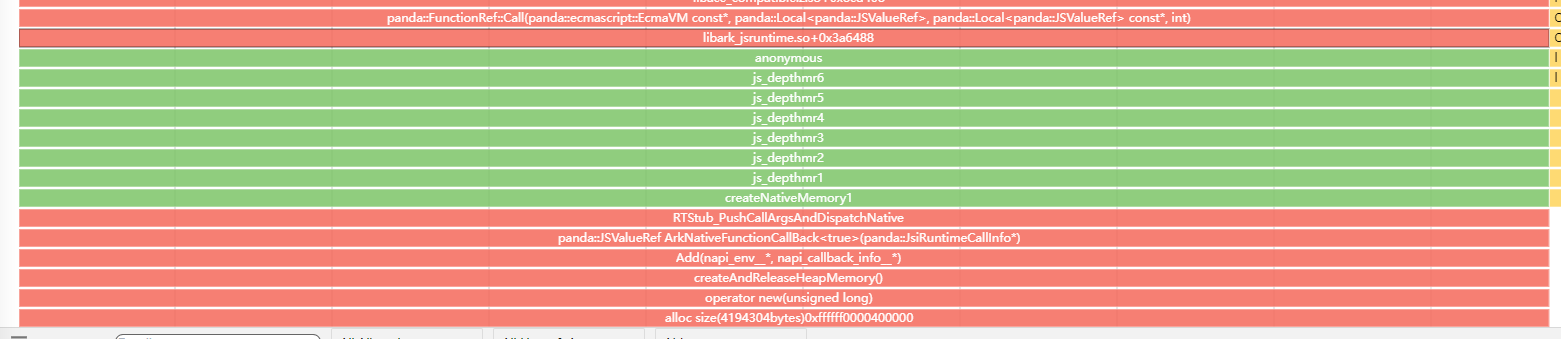
Statistics mode is enabled (the stack data is displayed periodically).

Set statistics_interval to a value greater than 0, which indicates how often statistics are generated. For example, 10 means statistics are generated every 10 seconds.
$ hiprofiler_cmd \
  -c - \
  -o /data/local/tmp/hiprofiler_data.htrace \
  -t 60 \
  -s \
  -k \
<<CONFIG
 request_id: 1
 session_config {
  buffers {
   pages: 16384
  }
 }
 plugin_configs {
  plugin_name: "nativehook"
  sample_interval: 5000
  config_data {
   save_file: false
   smb_pages: 16384
   max_stack_depth: 20
   process_name: "com.example.insight_test_stage"
   string_compressed: true
   fp_unwind: true
   blocked: true
   callframe_compress: true
   record_accurately: true
   offline_symbolization: true
   startup_mode: false
   statistics_interval: 10
   js_stack_report: 1
   max_js_stack_depth: 20
  }
 }
CONFIG 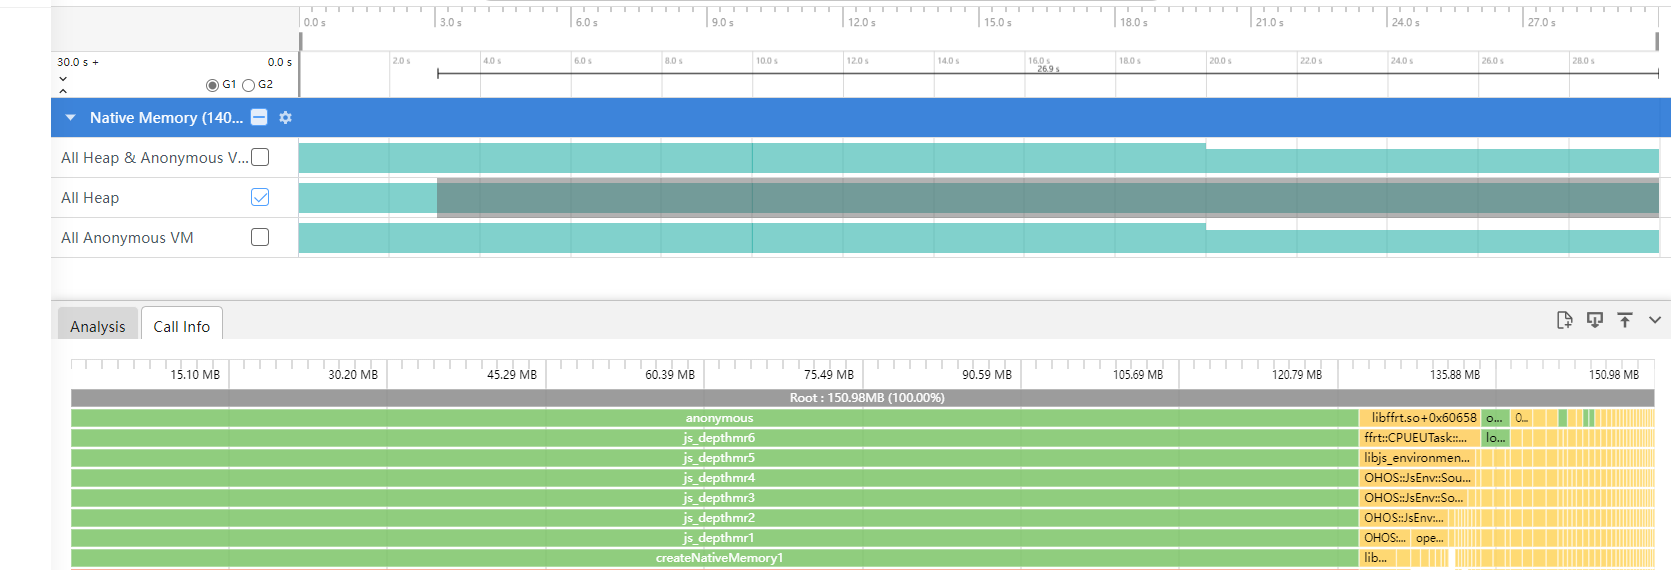
Non-statistics mode is enabled (the stack data is not displayed periodically).

Set statistics_interval to 0 or leave it unset.
$ hiprofiler_cmd \
  -c - \
  -o /data/local/tmp/hiprofiler_data.htrace \
  -t 60 \
  -s \
  -k \
<<CONFIG
 request_id: 1
 session_config {
  buffers {
   pages: 16384
  }
 }
 plugin_configs {
  plugin_name: "nativehook"
  sample_interval: 5000
  config_data {
   save_file: false
   smb_pages: 16384
   max_stack_depth: 20
   process_name: "com.example.insight_test_stage"
   string_compressed: true
   fp_unwind: false
   blocked: true
   callframe_compress: true
   record_accurately: true
   offline_symbolization: true
   startup_mode: false
   statistics_interval: 0
   max_js_stack_depth: 20
  }
 }
CONFIG 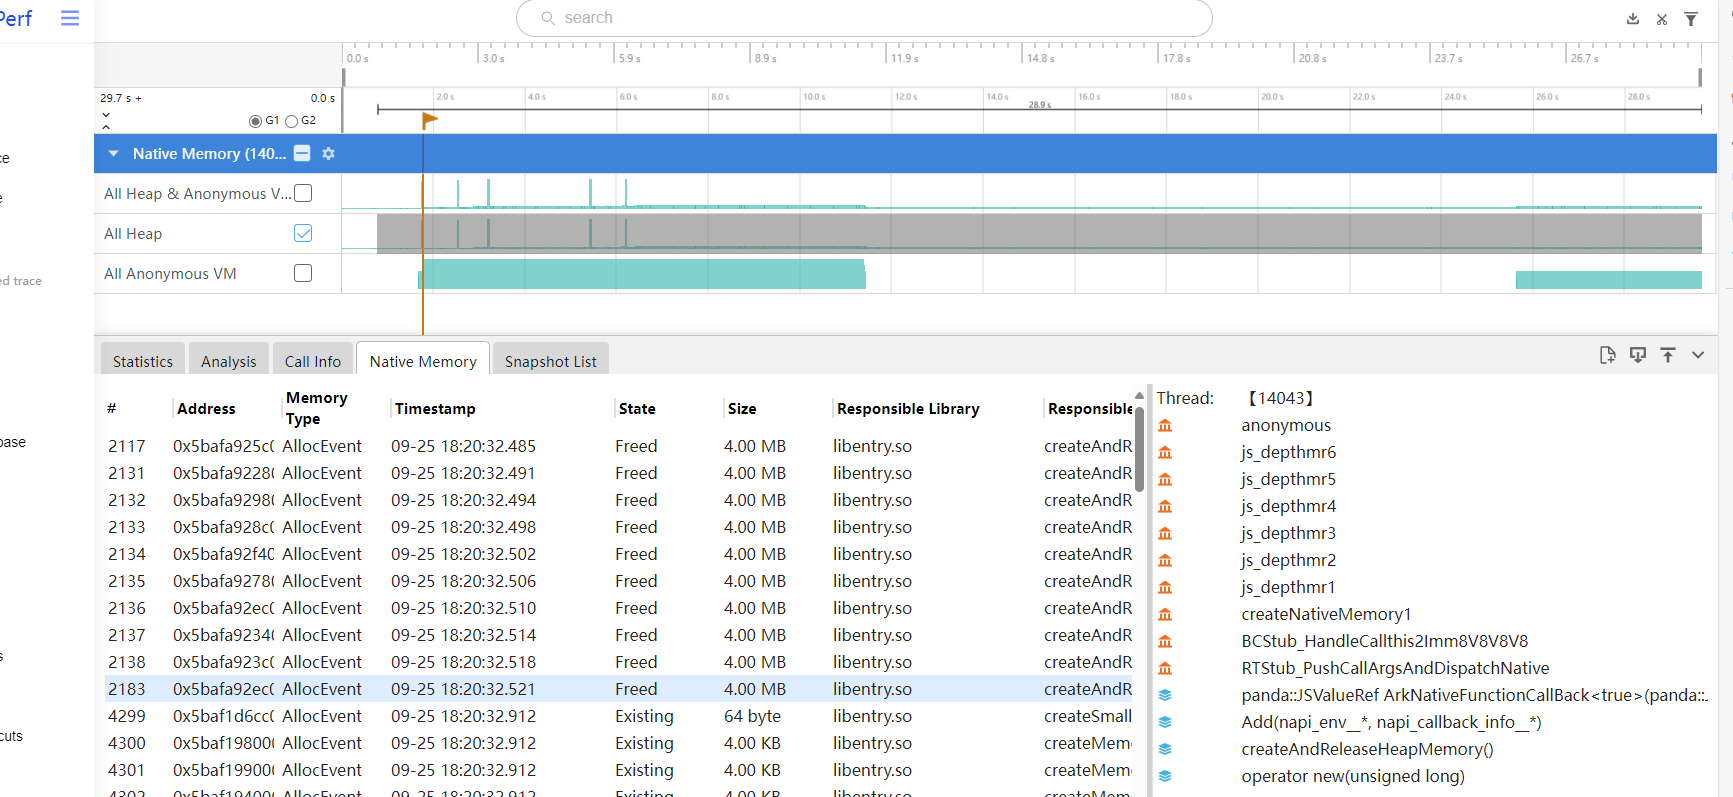
[h2]ftrace-plugin
Parameters
| Name | Type | Description | Details |
|---|---|---|---|
| ftrace_events | string | Captured trace events. | Trace events that record kernel logging. |
| hitrace_categories | string | Captured HiTrace logging information. | The HiTrace capability is called to obtain data and write the data to a file in proto format. |
| hitrace_apps | string | Captured HiTrace information process. | When this parameter is set, only the trace information of the corresponding process is recorded. When this parameter is added, binder cannot be added to hitrace_categories. Otherwise, trace data parsing will be abnormal. |
| buffer_size_kb | int | Buffer size, in KB. | Cache size required for the hiprofiler_plugins process to read kernel events. The default value 204800 is recommended. |
| flush_interval_ms | int | Data collection interval, in ms. | The default value 1000 is recommended. |
| flush_threshold_kb | int | Size of the data to refresh. | Data is refreshed to the file once when the threshold is exceeded. It is recommended that you use the default value of SmartPerf. |
| parse_ksyms | bool | Whether to obtain kernel data. | The value true means to obtain kernel data, and false means the opposite. |
| trace_period_ms | int | Period for reading kernel data. | It is recommended that you use the default value of SmartPerf. |
Result analysis
Example:
$ hiprofiler_cmd \
  -c - \
  -o /data/local/tmp/hiprofiler_data.htrace \
  -t 10 \
  -s \
  -k \
<<CONFIG
request_id: 1
session_config {
  buffers {
  pages: 16384
  }
}
plugin_configs {
  plugin_name: "ftrace-plugin"
  sample_interval: 1000
  config_data {
  ftrace_events: "binder/binder_transaction"
  ftrace_events: "binder/binder_transaction_received"
  buffer_size_kb: 204800
  flush_interval_ms: 1000
  flush_threshold_kb: 4096
  parse_ksyms: true
  clock: "boot"
  trace_period_ms: 200
  debug_on: false
  }
}
CONFIG
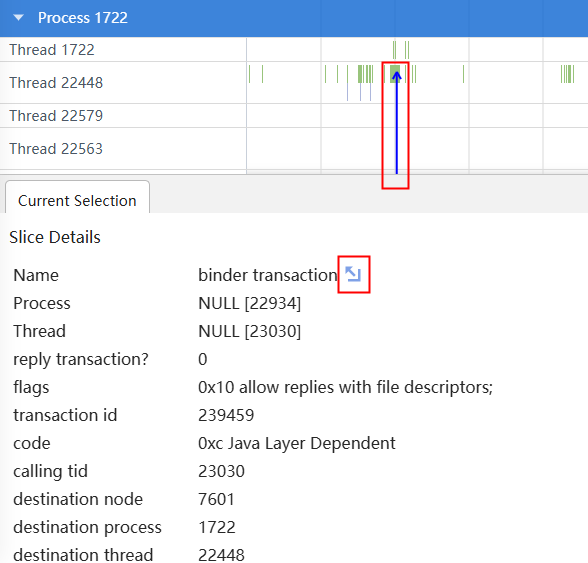
This command reads the kernel binder_transaction and binder_transaction_received data. The two fields must be used together to completely display the data at both ends of the binder. After running the command, run the hdc file recv /data/local/tmp/hiprofiler_data.htrace command to export the file to the current directory, and then use SmartPerf to open and parse the file. The following figure shows an example result.
You can click the arrow on the right of binder transaction to go to the process or thread on the other end of the binder.
[h2]memory-plugin
Parameters
| Name | Type | Description | Details |
|---|---|---|---|
| report_sysmem_vmem_info | bool | Whether to read virtual memory data. | Data is read from the /proc/vmstat node. |
| report_process_mem_info | bool | Whether to obtain the detailed memory data of a process, such as rss_shmem, rss_file, and vm_swap. | Data is read from the /proc/${pid}/stat node. |
| report_smaps_mem_info | bool | Whether to obtain the smaps memory information of a process. | Data is read from the /proc/${pid}/smaps node. |
| report_gpu_mem_info | bool | Whether to obtain the GPU usage of a process. | Data is read from the /proc/gpu_memory node. |
| parse_smaps_rollup | bool | Whether to read smaps statistics from the smaps_rollup node. | Data is read from the /proc/{pid}/smaps_rollup node. The profiling effect (for CPU and memory usage) is better than that of using the report_smaps_mem_info parameter. |
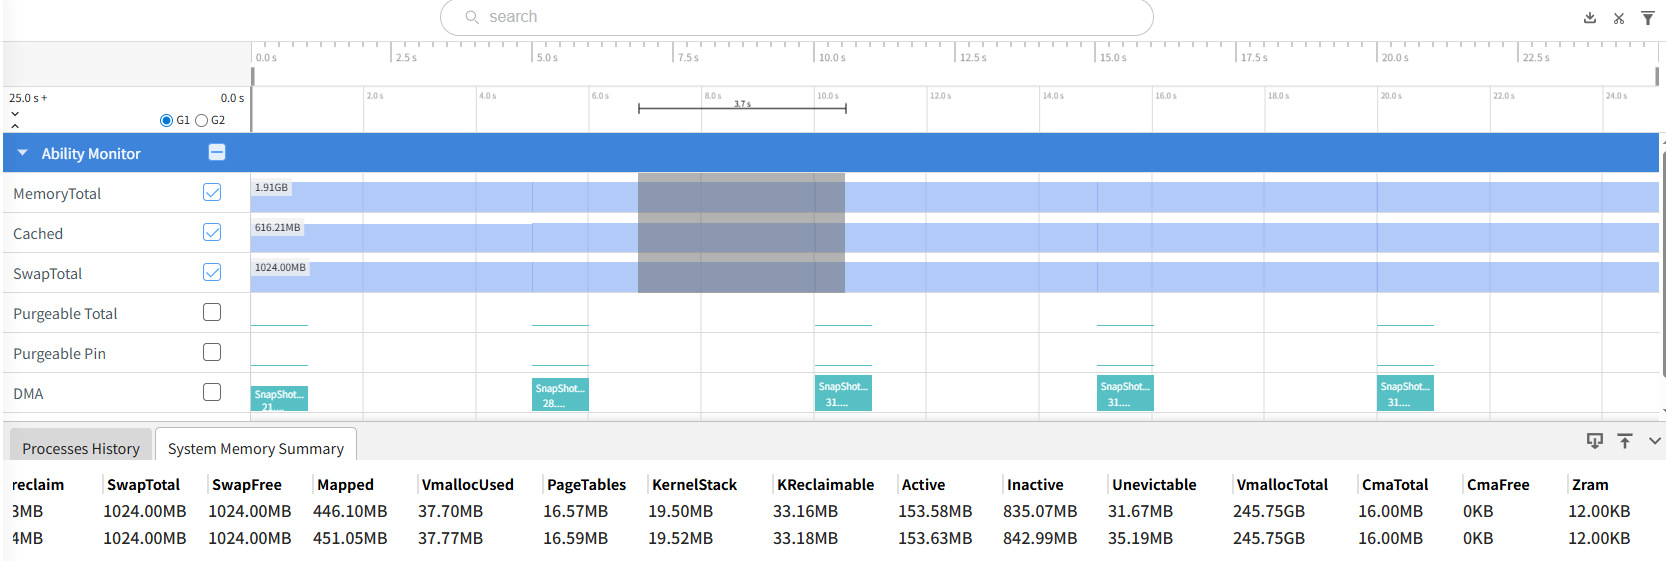
The following memory information is displayed:
- MemTotal: total memory size.
- MemFree: free memory size.
- Buffers: buffer size of files.
- Cached: cache size.
- Shmem: size of allocated shared memory.
- Slab: kernel data cache size.
- SUnreclaim: size of unreclaimable slab.
- SwapTotal: total size of the swap space.
- SwapFree: size of the unused swap space.
- Mapped: size of the mapping for devices and files.
- VmallocUsed: size of the used virtual memory.
- PageTables: size of the index table that manages memory paging.
- KernelStack: memory consumed by the kernel.
- Active: size of the buffer or cache page file that is frequently used.
- Inactive: size of the buffer or cache page file that is not frequently used.
- Unevictable: size of the memory page that cannot be released.
- VmallocTotal: total size of the vmalloc virtual memory.
- CmaTotal: total size of the contiguous available memory.
- CmaFree: size of the free available memory.
- Zram: size of the used zRAM.
- ZramTotal: total size of zRAM.

The difference between Active and Inactive is that Active contains data that has been used recently while Inactive does not. When the physical memory is insufficient and the memory space in use needs to be released, the Inactive memory is released first.
Result analysis
Run the hiprofiler_cmd command to obtain the memory data.
Example:
$ hiprofiler_cmd \
  -c - \
  -o /data/local/tmp/hiprofiler_data.htrace \
  -t 30 \
  -s \
  -k \
<<CONFIG
request_id: 1
session_config {
  buffers {
  pages: 16384
  }
}
plugin_configs {
  plugin_name: "memory-plugin"
  sample_interval: 5000
  config_data {
  report_process_tree: true
  report_sysmem_mem_info: true
  sys_meminfo_counters: PMEM_MEM_TOTAL
  sys_meminfo_counters: PMEM_MEM_FREE
  sys_meminfo_counters: PMEM_BUFFERS
  sys_meminfo_counters: PMEM_CACHED
  sys_meminfo_counters: PMEM_SHMEM
  sys_meminfo_counters: PMEM_SLAB
  sys_meminfo_counters: PMEM_SWAP_TOTAL
  sys_meminfo_counters: PMEM_SWAP_FREE
  sys_meminfo_counters: PMEM_MAPPED
  sys_meminfo_counters: PMEM_VMALLOC_USED
  sys_meminfo_counters: PMEM_PAGE_TABLES
  sys_meminfo_counters: PMEM_KERNEL_STACK
  sys_meminfo_counters: PMEM_ACTIVE
  sys_meminfo_counters: PMEM_INACTIVE
  sys_meminfo_counters: PMEM_UNEVICTABLE
  sys_meminfo_counters: PMEM_VMALLOC_TOTAL
  sys_meminfo_counters: PMEM_SLAB_UNRECLAIMABLE
  sys_meminfo_counters: PMEM_CMA_TOTAL
  sys_meminfo_counters: PMEM_CMA_FREE
  sys_meminfo_counters: PMEM_KERNEL_RECLAIMABLE
  sys_meminfo_counters: PMEM_ACTIVE_PURG
  sys_meminfo_counters: PMEM_INACTIVE_PURG
  sys_meminfo_counters: PMEM_PINED_PURG
  report_sysmem_vmem_info: true
  report_process_mem_info: true
  report_app_mem_info: false
  report_app_mem_by_memory_service: false
  report_purgeable_ashmem_info: true
  report_dma_mem_info: true
  report_gpu_mem_info: true
  }
}
CONFIG
This command reads the basic memory statistics of the system. After the command is executed, run the hdc file recv /data/local/tmp/hiprofiler_data.htrace command to export the file to the current directory, and then open and parse the file on SmartPerf. The following figure shows an example result.
Use DevEco Studio to obtain the memory data.
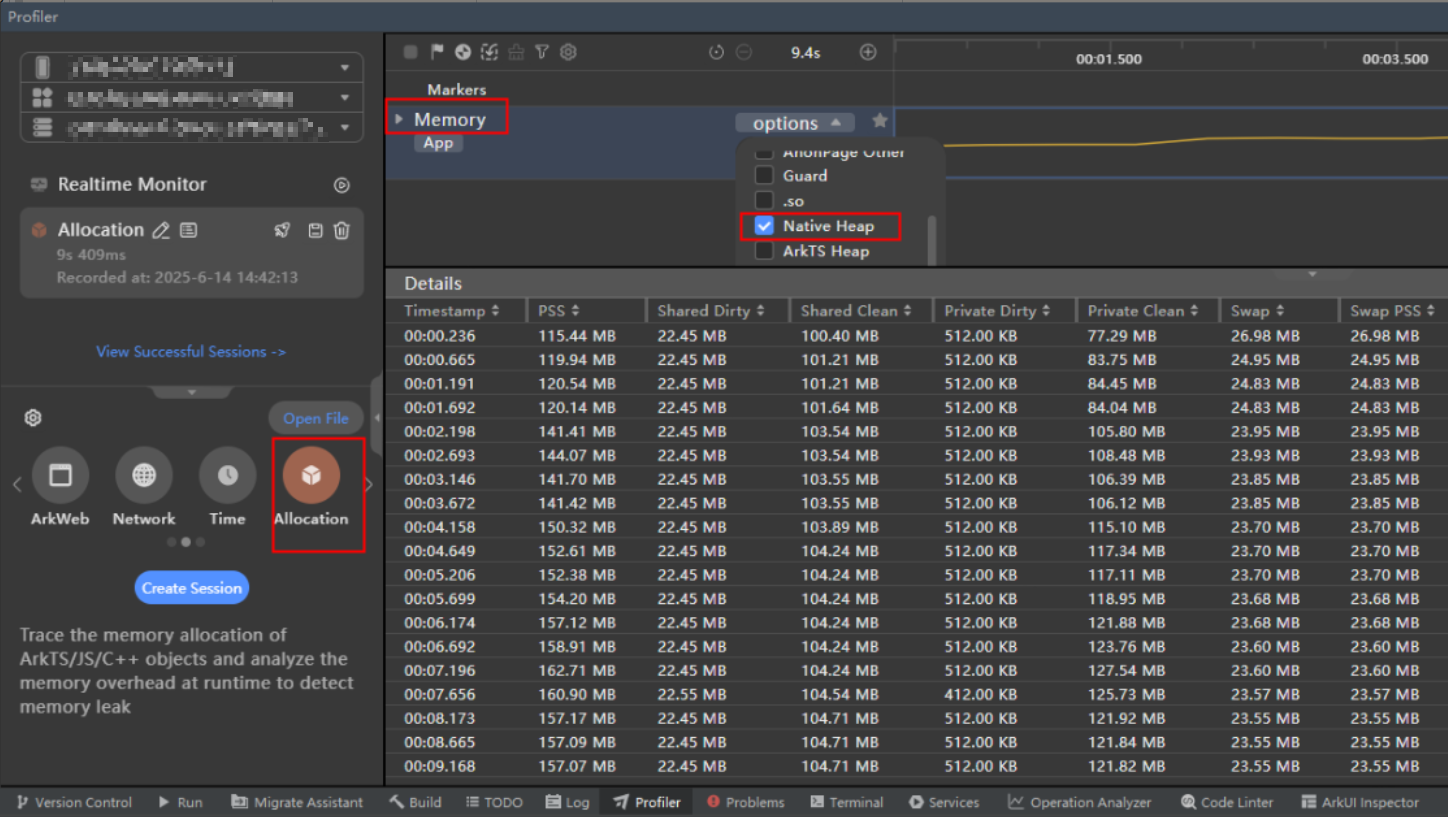
You can go to DevEco Studio -> Profiler -> Allocation and select Memory to use the memory plugin feature of the profiler. The preceding figure shows the process smaps memory information in the selected time range.
[h2]xpower-plugin
Parameters
| Name | Type | Description | Details |
|---|---|---|---|
| bundle_name | string | Name of the process for which power consumption profiling is required. | The value must be the same as the process name in the /proc/ node. |
| message_type | XpowerMessageType | Type of the power consumption data to be obtained. | The data types include REAL_BATTERY, APP_STATISTIC, APP_DETAIL, COMPONENT_TOP, ABNORMAL_EVENTS, and THERMAL_REPORT. |
Result analysis
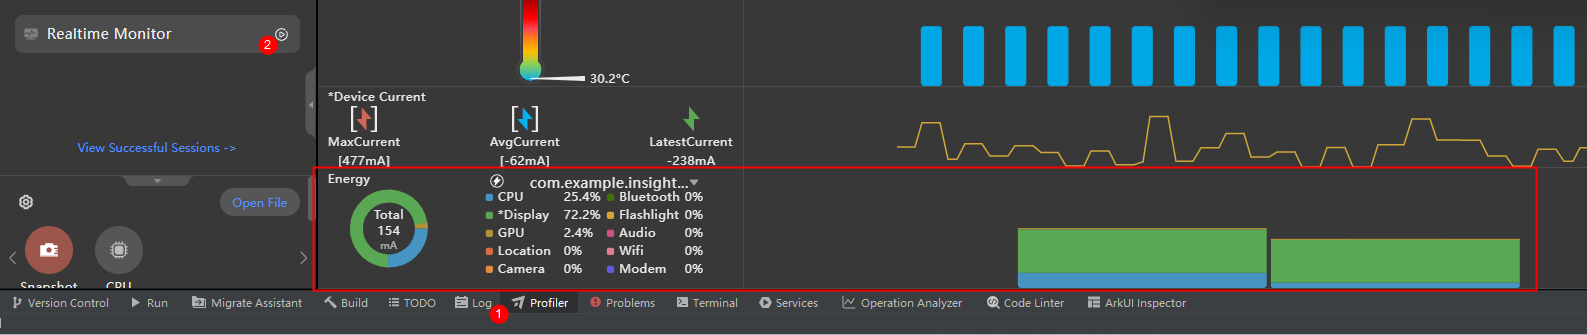
You can go to DevEco Studio -> Profiler -> Realtime Monitor to obtain the power consumption data of related processes.
[h2]gpu-plugin
Obtain the GPU usage information.
Parameters
| Name | Type | Description | Details |
|---|---|---|---|
| pid | int | Process ID to profile, which is the same as the process ID in the /proc/ node. | - |
| report_gpu_info | bool | Whether to display the GPU usage of a specified process. | The value true means to display the GPU data of a specified process (PID needs to be set), and false means the opposite. |
[h2]cpu-plugin
Obtain the CPU usage information.
Parameters
| Name | Type | Description | Details |
|---|---|---|---|
| pid | int | Process ID to profile. | The value must be the same as the process ID in the /proc/ node. |
| report_process_info | bool | Whether to display the CPU usage of a specified process. | The value true means to display the CPU usage of a specified process (PID needs to be set); the value false means to display only the system CPU usage. |
| skip_thread_cpu_info | bool | Whether to skip the thread CPU usage data. | The value true means to not display the CPU usage of each thread, which reduces the profiling overhead; the value false means the opposite. |
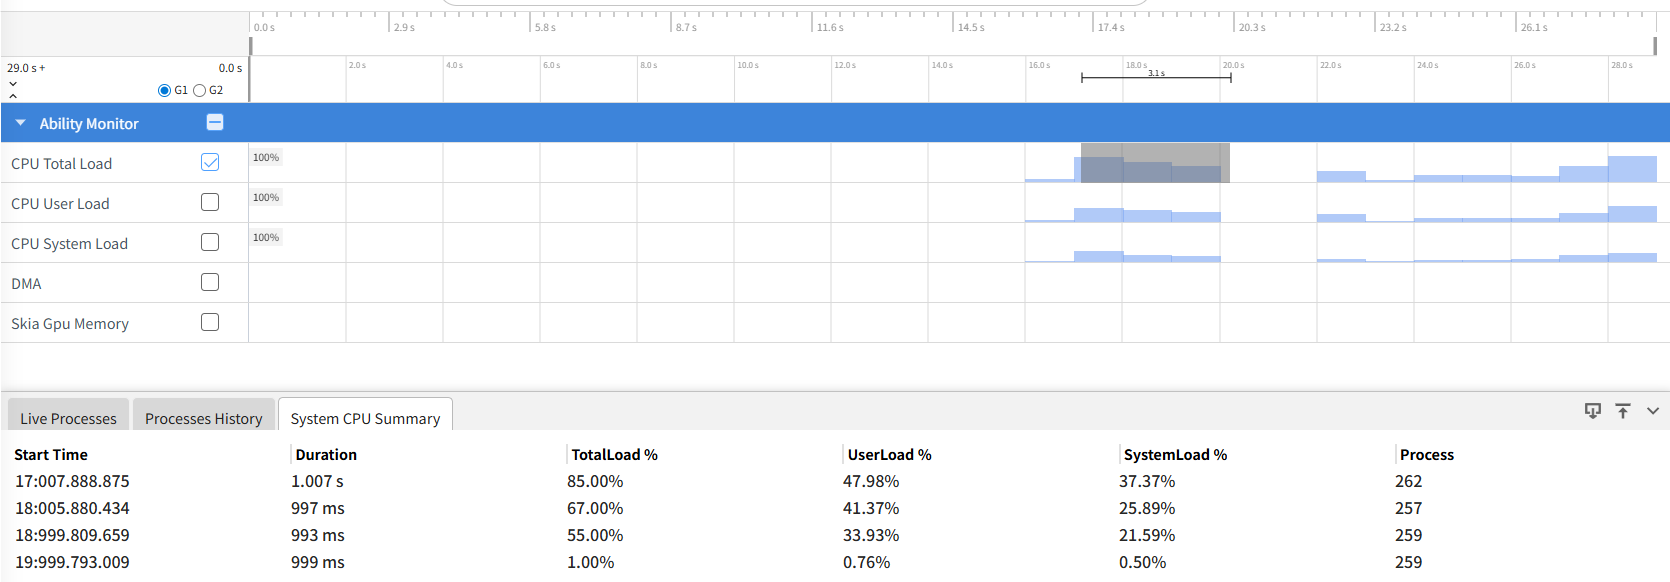
The following lists the basic CPU information:
- Start Time: start time of the collection.
- Duration: interval between the previous collection and the current collection.
- TotalLoad%: total CPU usage.
- UserLoad%: CPU usage in user mode.
- SystemLoad%: CPU usage in kernel mode.
- Process: process ID.
Result analysis
Example:
$ hiprofiler_cmd \
  -c - \
  -o /data/local/tmp/hiprofiler_data.htrace \
  -t 30 \
  -s \
  -k \
<<CONFIG
request_id: 1
session_config {
  buffers {
  pages: 16384
  }
}
plugin_configs {
  plugin_name: "cpu-plugin"
  sample_interval: 1000
  config_data {
  report_process_info: true
  }
}
CONFIG
This command reads the basic CPU statistics. After the command is executed, run the hdc file recv /data/local/tmp/hiprofiler_data.htrace command to export the file to the current directory, and then open and parse the file on SmartPerf. The following figure shows an example result.
[h2]diskio-plugin
Obtain the disk I/O usage information of the entire device.
Parameters
| Name | Type | Description | Details |
|---|---|---|---|
| report_io_stats | IoReportType | Disk I/O statistics. | The value is an enum type. Currently, only IO_REPORT is supported. |
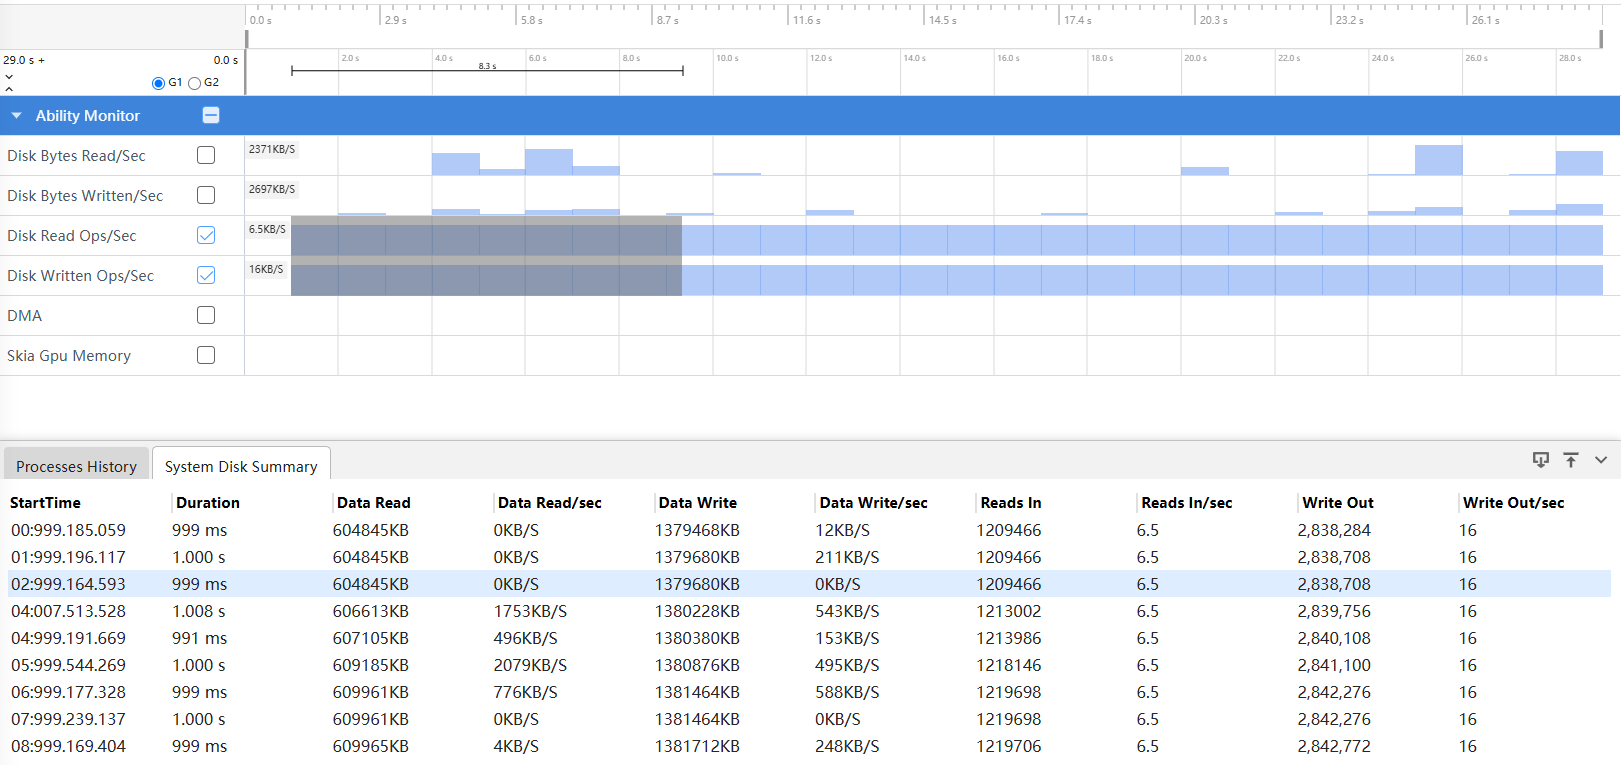
When IO_REPORT is set, the following disk I/O information is obtained:
- Data Read: total number of bytes read from the disk to the memory.
- Data Read/sec: number of bytes read from the disk to the memory per second.
- Data Write: total number of bytes written from the memory to the disk.
- Data Write/sec: number of bytes written from the memory to the disk per second.
- Reads In: number of bytes read.
- Reads In/sec: number of bytes read per second.
- Write Out: number of bytes written.
- Write Out/sec: number of bytes written per second.
Result analysis
Example:
$ hiprofiler_cmd \
  -c - \
  -o /data/local/tmp/hiprofiler_data.htrace \
  -t 30 \
  -s \
  -k \
<<CONFIG
request_id: 1
session_config {
  buffers {
  pages: 16384
  }
}
plugin_configs {
  plugin_name: "diskio-plugin"
  sample_interval: 1000
  config_data {
  report_io_stats: IO_REPORT
  }
}
CONFIG
This command reads the basic disk I/O statistics. After the command is executed, run the hdc file recv /data/local/tmp/hiprofiler_data.htrace command to export the file to the current directory, and then open and parse the file on SmartPerf. The following figure shows an example result.
[h2]hidump-plugin
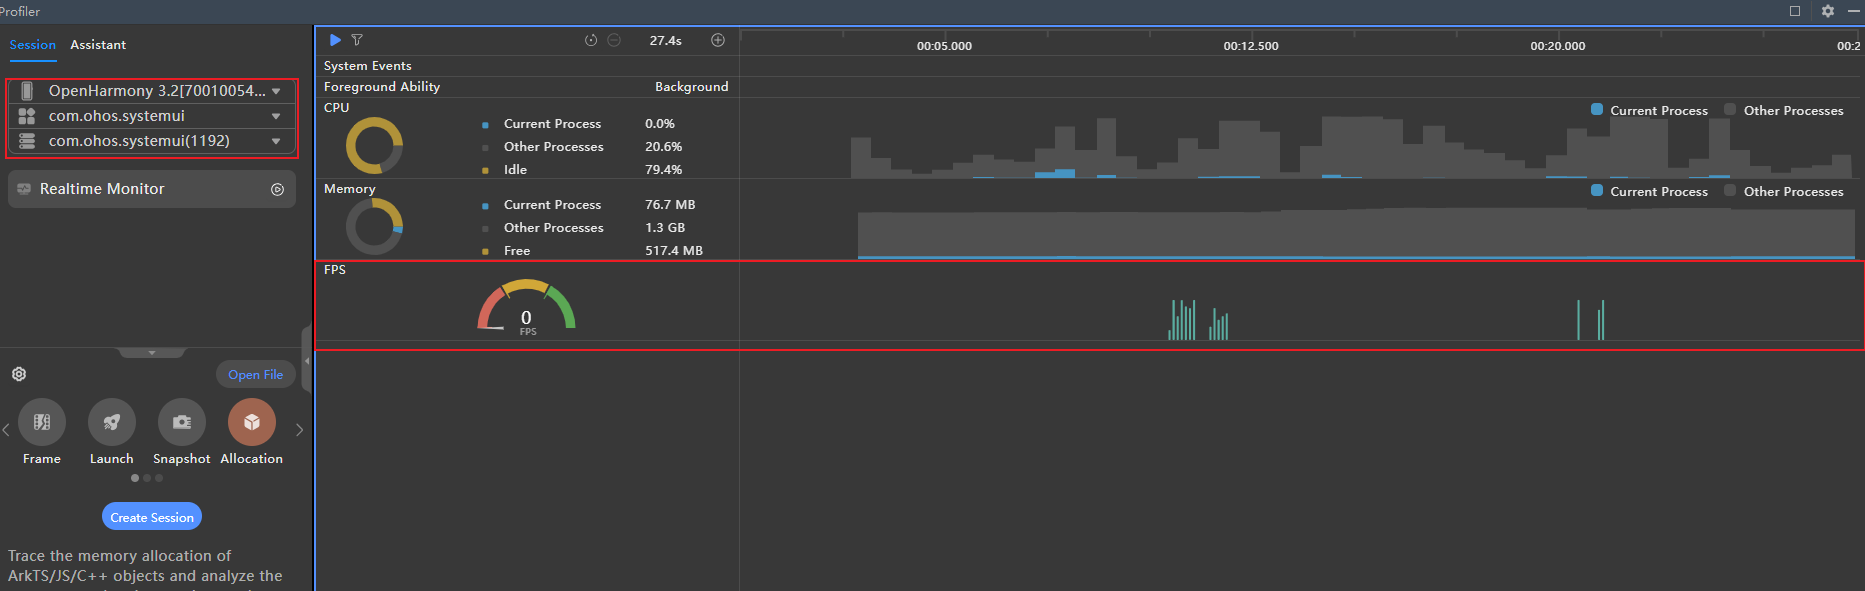
Obtain the frame rate of an application process.
Parameters
| Name | Type | Description | Details |
|---|---|---|---|
| report_fps | bool | Whether to report the frame rate data. | The value true means to report the frame rate data of the application process; the value false means the opposite. |
| sections | uint32 | Number of times that the frame rate data is reported per second. | The default value is 10, that is, the frame rate data is reported every 100 ms. |
Result analysis
Currently, this plugin only supports trace data parsing on DevEco Studio. SmartPerf is not supported. For details, see the following figure.
[h2]hisysevent-plugin
Obtain the system event data.
Parameters
| Name | Type | Description | Details |
|---|---|---|---|
| msg | string | Custom string. | Reserved field. An empty string can be passed. |
| subscribe_domain | string | Domain to subscribe to. | Used to subscribe to all events in a specific domain. If this field is left empty, all events in all domains are subscribed to. |
| subscribe_event | string | Event to subscribe to. | Used to subscribe to a specific event. If this field is left empty, all events are subscribed to. |
Result analysis
Example:
$ hiprofiler_cmd \
  -c - \
  -o /data/local/tmp/hiprofiler_data.htrace \
  -t 30 \
  -s \
  -k \
<<CONFIG
request_id: 1
session_config {
  buffers {
  pages: 16384
  }
}
plugin_configs {
  plugin_name: "hisysevent-plugin"
  config_data {
  msg: "hisysevent-plugin"
  subscribe_domain: ""
  subscribe_event: ""
  }
}
CONFIG
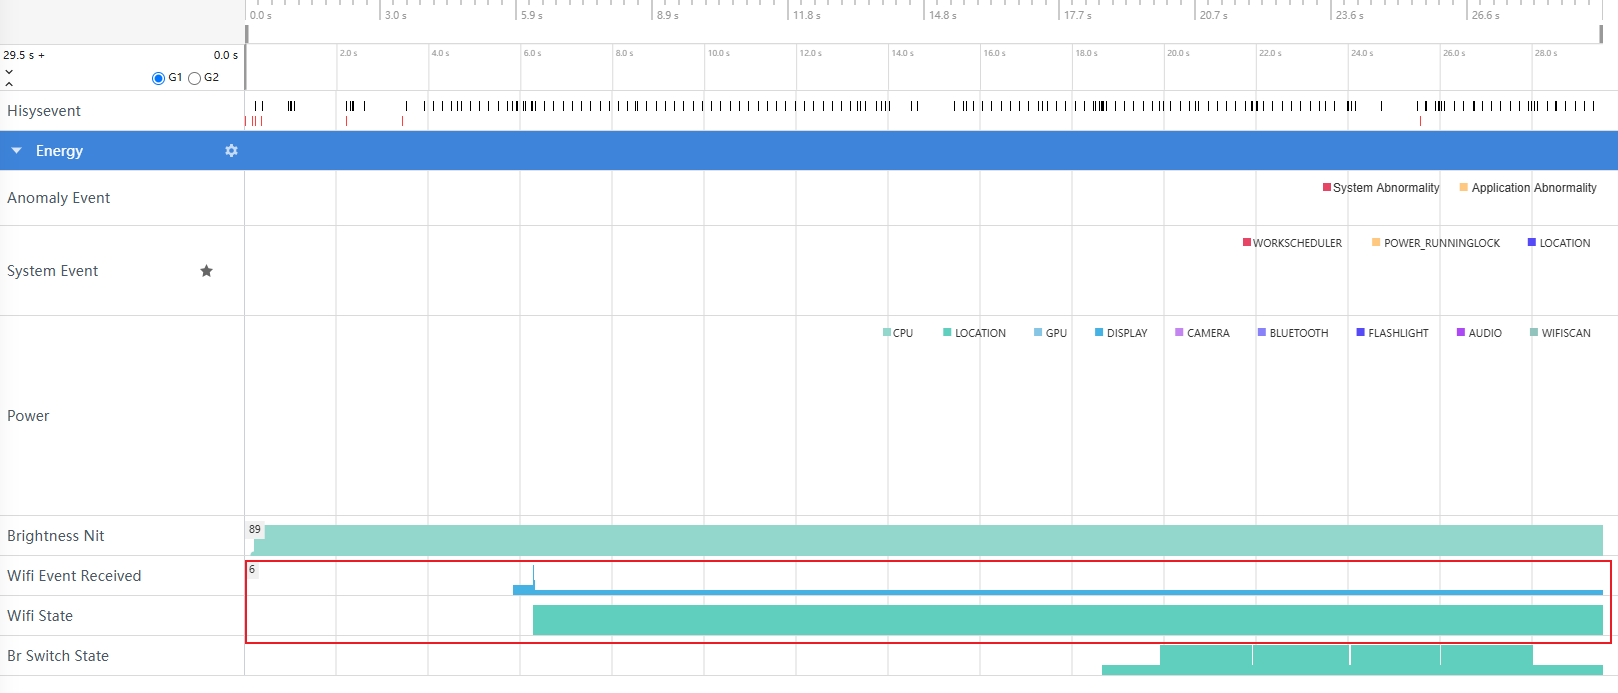
This command captures information about all HiSysEvent subscriptions. After the command is executed, run the hdc file recv /data/local/tmp/hiprofiler_data.htrace command to export the file to the current directory, and then open and parse the file on SmartPerf. The following figure shows an example result.
[h2]network-plugin
Obtains the network upload and download data, and collects statistics on network traffic and connection status provided by the network management module.
Parameters
| Name | Type | Description | Mandatory | Details |
|---|---|---|---|---|
| pid | int32 | Process ID. | No | Used to obtain the network data of a specified process. Multiple parameters can be passed in. If this parameter is not specified, the network data of the entire device is captured. |
| startup_process_name | string | Name of the process to start. | No | This parameter must be specified for capturing network data of a specified process. |
| restart_process_name | string | Name of the process to restart. | No | This parameter must be specified for capturing network data of a specified process after the process restarts. |

startup_process_name and restart_process_name cannot be both empty.
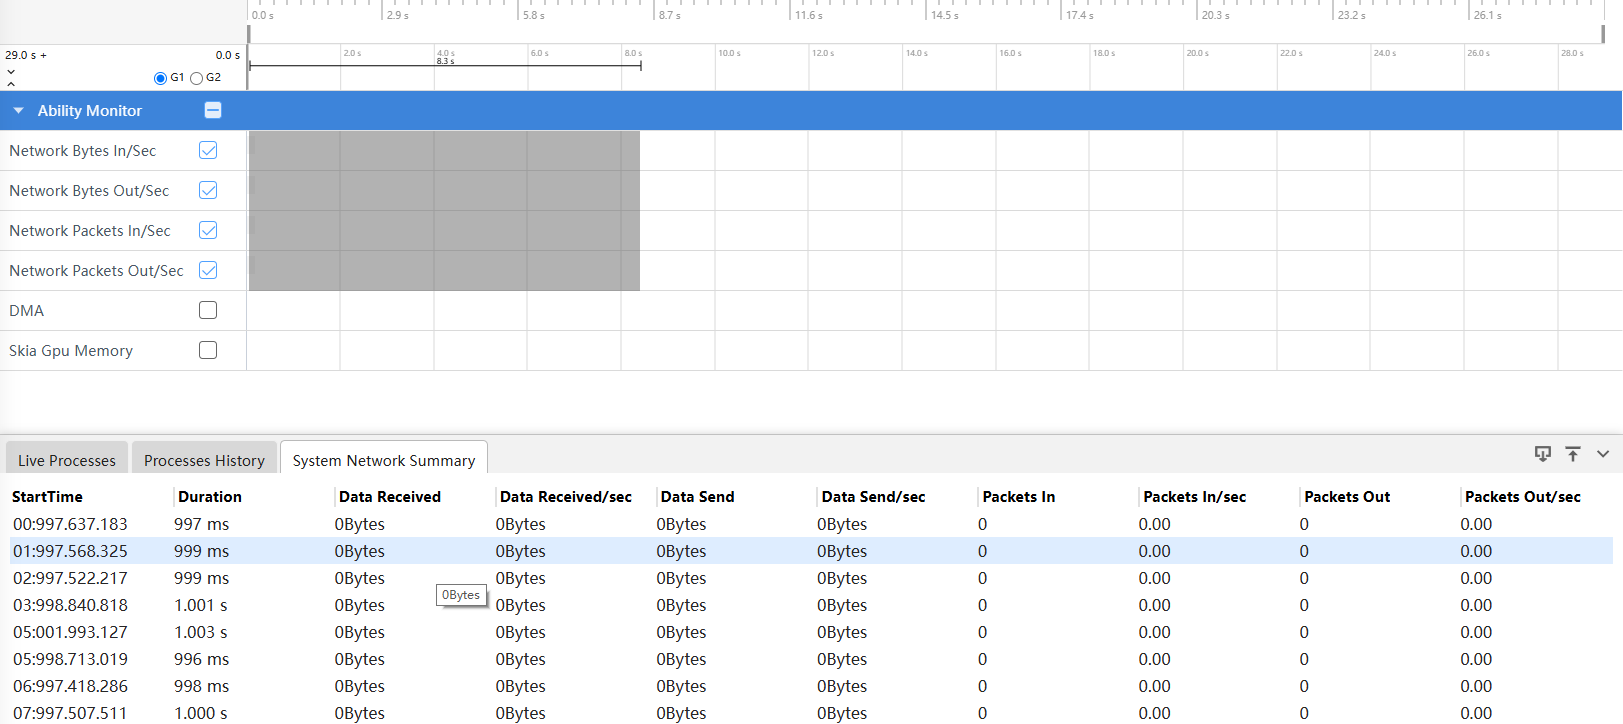
The following lists the network information:
- StartTime: start time of the collection.
- Duration: interval between the previous collection and the current collection.
- Data Received: total number of received network bytes.
- Data Received/sec: number of received network bytes per second.
- Data Send: total number of sent network bytes.
- Data Send/sec: number of sent network bytes per second.
- Packets In: total number of received network packets.
- Packets In/sec: number of received network packets per second.
- Packets Out: total number of sent network packets.
- Packets Out/sec: number of sent network packets per second.
Result analysis
Example:
$ hiprofiler_cmd \
  -c - \
  -o /data/local/tmp/hiprofiler_data.htrace \
  -t 30 \
  -s \
  -k \
<<CONFIG
request_id: 1
session_config {
  buffers {
  pages: 16384
  }
}
plugin_configs {
  plugin_name: "network-plugin"
  sample_interval: 1000
  config_data {
  }
}
CONFIG
This command captures network data of the entire device. After the command is executed, run the hdc file recv /data/local/tmp/hiprofiler_data.htrace command to export the file to the current directory, and then open and parse the file on SmartPerf. The following figure shows an example result.
[h2]network profiler
Obtains the network request information of a process, and records each HTTP request as a data point.
Parameters
| Name | Type | Description | Mandatory | Details |
|---|---|---|---|---|
| pid | int32 | Process ID. | No | Used to obtain the network data of a specified process. Multiple parameters can be passed in. If this parameter is not specified, the network data of the entire device is captured. |
| startup_process_name | string | Name of the process to start. | No | This parameter must be specified for capturing network data of a specified process. |
| restart_process_name | string | Name of the process to restart. | No | This parameter must be specified for capturing network data of a specified process after the process restarts. |
| clock_id | int | Clock type. | Yes | 1: BOOTTIME, which indicates the monotonically increasing time (including NTP adjustment) after the system starts. 2: REALTIME, which indicates the adjustable system real time. 3: REALTIME_COARSE, which indicates the low-precision real time. 4: MONOTONIC, which indicates the monotonically increasing time without NTP adjustment. 5: MONOTONIC_COARSE, which indicates the low-precision monotonically increasing time. 6: MONOTONIC_RAW, which indicates the hardware raw monotonically increasing time. |
| smb_pages | int | Number of shared memory pages. | Yes | Size of the shared memory established between the hiprofiler_plugins process and the profiled process. The recommended value is 16384 pages, that is, 16384 x 4096 = 67108864 bytes (64 MB). |
| flush_interval | int | Disk flush interval. | No | A disk flush is triggered every flush_interval network requests, optimizing the I/O efficiency. The default value is 1. |
| block | bool | Whether to enable the block mode. | No | true: Enable the block mode when the shared memory is full, which may affect the performance. false: Discard the excess data when the shared memory is full. The default value is false. |
Result analysis
Currently, SmartPerf does not support trace data parsing of this plugin. To analyze network data, use the NetWork feature of DevEco Studio Profiler. The reference is as follows:
[h2]Sampling Records of Heap Memory Allocation Call Stack Data
Capture the stack of heap memory allocation operations of the com.example.insight_test_stage process, and enable fp stack unwinding, offline symbolization, and statistics mode.
$ hiprofiler_cmd \
  -c - \
  -t 30 \
  -s \
  -k \
<<CONFIG
request_id: 1
session_config {
  buffers {
  pages: 16384
  }
}
plugin_configs {
  plugin_name: "nativehook"
  sample_interval: 5000
  config_data {
  save_file: false
  smb_pages: 16384
  max_stack_depth: 20
  process_name: "com.example.insight_test_stage"
  string_compressed: true
  fp_unwind: true
  blocked: true
  callframe_compress: true
  record_accurately: true
  offline_symbolization: true
  startup_mode: false
  statistics_interval: 10
  sample_interval: 256
  js_stack_report: 1
  max_js_stack_depth: 10
  }
}
CONFIG
The collected data is saved to the /data/local/tmp/hiprofiler_data.htrace file, which contains the function call information, thread and dynamic library memory allocation information, call stack count and allocation size required for memory leak analysis. Enabling offline symbolization, fp stack unwinding, and statistics mode can improve the data processing efficiency of the profiling service.
[h2]Obtaining the CPU Usage of a Specified Process
Collect CPU data of the process whose process ID is 1234. The collection duration is 30s, the sampling period is 1000 ms, the size of the shared memory for transmitting profiling data is 16384 memory pages, and the collected data is saved to the /data/local/tmp/hiprofiler_data.htrace file.
$ hiprofiler_cmd \
  -c - \
  -o /data/local/tmp/hiprofiler_data.htrace \
  -t 30 \
  -s \
  -k \
<<CONFIG
 request_id: 1
 session_config {
  buffers {
   pages: 16384
  }
 }
 plugin_configs {
  plugin_name: "cpu-plugin"
  sample_interval: 1000
  config_data {
   pid: 1234
   report_process_info: true
  }
 }
CONFIG
[h2]Capturing the GPU Memory Call Stack of a Specified Process
Capture the GPU memory call stack of a specified process. The latest SmartPerf release is required to parse the file. Download link: smartperf.
$ hiprofiler_cmd \
  -c - \
  -t 30 \
  -s \
  -k \
<<CONFIG
request_id: 1
session_config {
  buffers {
  pages: 16384
  }
}
plugin_configs {
  plugin_name: "nativehook"
  sample_interval: 5000
  config_data {
  save_file: false
  smb_pages: 16384
  max_stack_depth: 20
  pid: 11237
  string_compressed: true
  fp_unwind: true
  blocked: true
  callframe_compress: true
  record_accurately: true
  offline_symbolization: true
  startup_mode: false
  statistics_interval: 10
  malloc_disable: true
  memtrace_enable: true
  restrace_tag: "RES_GPU_VK"
  restrace_tag: "RES_GPU_GLES_BUFFER"
  restrace_tag: "RES_GPU_GLES_IMAGE"
  restrace_tag: "RES_GPU_CL_BUFFER"
  js_stack_report: 1
  max_js_stack_depth: 10
  }
}
CONFIG
The malloc_disable parameter is used in the command to filter the native heap stack data. If the restrace_tag parameter does not contain RES_GPU_CL_IMAGE, the GPU memory allocation stack of the OpenCL image type is not captured.
[h2]Capturing the Call Stack of GlobalHandle Objects in a Specified Process
Since API version 23, capturing the call stack of napi_ref created by a specified process is supported. Call stacks created for weak references are not captured.
$ hiprofiler_cmd \
  -c - \
  -t 60 \
  -o /data/local/tmp/hiprofiler_data.txt \
  -s \
  -k \
<<CONFIG
request_id: 1
session_config {
  buffers {
  pages: 16384
  }
}
plugin_configs {
  plugin_name: "nativehook"
  sample_interval: 5000
  config_data {
  save_file: false
  smb_pages: 16384
  max_stack_depth: 20
  pid: 11237
  string_compressed: true
  fp_unwind: true
  blocked: true
  callframe_compress: true
  record_accurately: true
  offline_symbolization: true
  startup_mode: false
  statistics_interval: 10
  malloc_disable: true
  memtrace_enable: true
  restrace_tag: "RES_ARK_GLOBAL_HANDLE"
  js_stack_report: 1
  max_js_stack_depth: 10
  }
}
CONFIG
[h2]Capturing the Call Stack of LocalHandle Objects in a Specified Process
Since API version 23, LocalHandle memory recording is supported. For example, you can use the following command to record memory for the com.example.insight_test_stage process.
$ hiprofiler_cmd \
  -c - \
  -t 60 \
  -o /data/local/tmp/hiprofiler_data.txt \
  -s \
  -k \
<<CONFIG
request_id: 1
session_config {
  buffers {
  pages: 16384
  }
}
plugin_configs {
  plugin_name: "nativehook"
  sample_interval: 5000
  config_data {
  save_file: false
  smb_pages: 16384
  max_stack_depth: 20
  process_name: "com.example.insight_test_stage"
  string_compressed: true
  fp_unwind: true
  blocked: true
  callframe_compress: true
  record_accurately: true
  offline_symbolization: true
  startup_mode: true
  statistics_interval: 10
  malloc_disable: true
  memtrace_enable: true
  restrace_tag: "RES_ARK_LOCAL_HANDLE"
  js_stack_report: 1
  max_js_stack_depth: 10
  }
}
CONFIG
The LocalHandle memory recording feature requires the profiled application to load the profiling library at startup. Otherwise, LocalHandle memory information cannot be collected properly.
How to load the profiling library at startup:
-
If the application has exited, send the LocalHandle memory recording command with startup_mode set to true, and then start the application. Data collection starts after the application is launched.
-
If the application is running, send the LocalHandle memory recording command with startup_mode set to true, and then restart the application. Data collection starts after the application restarts.

- After the application loads the profiling library, the library remains effective until the application exits. After that, LocalHandle memory can be recorded in non-startup mode, but startup_mode must be set to false.
- This method increases the startup time of the current launch and causes some performance loss during the current run. It does not affect subsequent use.
- LocalHandle memory captured in this way is leaked memory.
- Trace files obtained through the command line can be parsed by using the DevEco Profiler Offline Import feature. The size of a single imported file must not exceed 1.5 GB.
- Since API version 26.0.0, statistics mode supports collecting local/global handle address information.
[h2]Manually Controlling the Collection Duration
Use the manual start/stop profiling mode to capture the stack of heap memory allocation operations of the com.example.insight_test_stage process.
Start profiling:
$ hiprofiler_cmd start \
  -c - \
  -s \
  -k \
<<CONFIG
request_id: 1
session_config {
  buffers {
  pages: 16384
  }
}
plugin_configs {
  plugin_name: "nativehook"
  sample_interval: 5000
  config_data {
  save_file: false
  smb_pages: 16384
  max_stack_depth: 20
  process_name: "com.example.insight_test_stage"
  string_compressed: true
  fp_unwind: true
  blocked: true
  callframe_compress: true
  record_accurately: true
  offline_symbolization: true
  startup_mode: false
  statistics_interval: 10
  sample_interval: 256
  js_stack_report: 1
  max_js_stack_depth: 10
  }
}
CONFIG
Stop profiling:
$ hiprofiler_cmd stop
[h2]Using File Cache Mode
Since API version 24, file cache mode is supported. You can use the following method to record memory for the com.example.insight_test_stage process.

When file cache mode is used, use_file_cache_mode must be set to true.
$ hiprofiler_cmd \
  -c - \
  -o /data/local/tmp/hiprofiler_data.htrace \
  -t 60 \
  -s \
  -k \
<<CONFIG
 request_id: 1
 session_config {
  buffers {
   pages: 16384
  }
 }
 plugin_configs {
  plugin_name: "nativehook"
  sample_interval: 5000
  config_data {
   save_file: false
   smb_pages: 16384
   max_stack_depth: 20
   process_name: "com.example.insight_test_stage"
   string_compressed: true
   fp_unwind: false
   blocked: true
   callframe_compress: true
   record_accurately: true
   offline_symbolization: true
   startup_mode: false
   max_js_stack_depth: 20
   use_file_cache_mode: true
  }
 }
CONFIG
[h2]Capturing Composite Heap Profiling Logs of a Specified Process
Starting from API version 26.0.0, capturing composite heap profiling logs of a specified process is supported. These logs include call stack traces, rawheap heap snapshots, and map files. They can be used together with RES_ARK_GLOBAL_HANDLE and RES_ARK_LOCAL_HANDLE.

To capture composite heap profiling logs, add restrace_tag: "RES_COMPOSITE_HEAP" to the nativehook configuration.
Composite heap profiling logs are saved to the zip file specified by the -o parameter of the command line. If the -o parameter is not set, the logs are saved to /data/local/tmp/hiprofiler_data_{timestamp}.zip by default. Only the latest composite heap profiling log file is retained.
The collected process only supports applications signed by the debug certificate.
Example:
$ hiprofiler_cmd \
  -c - \
  -o /data/local/tmp/hiprofiler_data.zip \
  -t 60 \
  -s \
  -k \
<<CONFIG
 request_id: 1
 session_config {
  buffers {
   pages: 16384
  }
 }
 plugin_configs {
  plugin_name: "nativehook"
  sample_interval: 5000
  config_data {
   save_file: false
   smb_pages: 16384
   max_stack_depth: 20
   process_name: "com.example.insight_test_stage"
   string_compressed: true
   fp_unwind: true
   blocked: true
   callframe_compress: true
   record_accurately: true
   offline_symbolization: true
   js_stack_report: 1
   max_js_stack_depth: 20
   filter_size: 0
   statistics_interval: 10
   restrace_tag: "RES_COMPOSITE_HEAP"
   restrace_tag: "RES_ARK_LOCAL_HANDLE"
   restrace_tag: "RES_ARK_GLOBAL_HANDLE"
   startup_mode: true
   memtrace_enable: true
   malloc_disable:false
   discard_destroyed_traces: true
  }
 }
CONFIG [h2]What should I do if an exception occurs during profiling?
Symptom
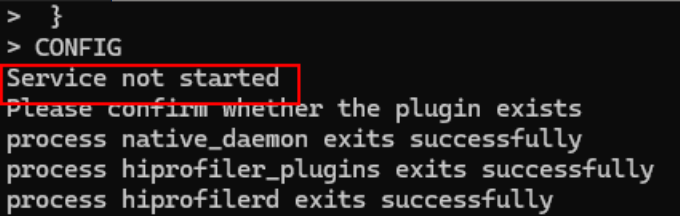
"Service not started" is displayed when the hiprofiler_cmd command is executed.
Possible Causes and Solution
If the profiling service is not started, DevEco Studio is being used for profiling or the previous profiling exits frequently. In this case, run the hiprofiler_cmd -k command and then run the profiling command again.
[h2]What should I do if the captured trace file is empty?
Symptom
The captured trace file is empty.
Possible Causes and Solution
Check whether the generated file is in the /data/local/tmp/ directory. If the target path is a folder in /data/local/tmp, run the chmod 777 command on the folder. If the application captured by the nativehook or network profiler plugin in the user version is not a debug-type application, no data can be captured. For requirements, see Applications Signed by the Debug Certificate.
[h2]What should I do if the profiling data may be inaccurate?
Symptom
The native heap captured by hiprofiler is different from that viewed by hidumper.
Possible Causes and Solution
hidumper captures the process-level memory usage, while hiprofiler captures the heap memory data allocated by the user-mode process using basic library functions such as malloc, mmap, and realloc. The operator new function also calls malloc. Therefore, the native heap information captured by them differs in the thread memory cache, heap memory release delay, and memory used by the loader.
[h2]What should I do if the target process freezes during profiling?
Symptom
When the hiprofiler_cmd command is executed, and the fp or dwarf stack unwinding is used, the application process freezes.
Possible Causes and Solution
You can change the config parameter in the hiprofiler_cmd command.
The procedure is as follows:
- Decrease the values of max_stack_depth and max_js_stack_depth to reduce the stack unwinding depth and the collection of call stack information.
- Increase the value of smb_pages to increase the shared memory size for profiling data transmission. The default value is 16384 pages, that is, 16384 x 4096 = 67108864 bytes (64 MB). You can change the value to 128 MB.
- Increase the value of sample_interval to increase the size of the sampling thread stack. The default value is 256. You can change the value to 512.
[h2]What should I do if fp stack unwinding fails during profiling?
Symptom
When the hiprofiler_cmd command is used to capture the memory trace of an application process, the corresponding shared library (SO) cannot perform FP-based stack unwinding.
Possible Causes and Solution
Check whether the corresponding shared library was compiled with the -fomit-frame-pointer option enabled. Ensure that this option is disabled.