App Performance Management (APM) of HUAWEI AppGallery Connect provides minute-level app performance monitoring capabilities. With the APM SDK, you can quickly integrate APM without coding. APM allows you to view and analyze app performance data collected by APM in AppGallery Connect to comprehensively understand the performance features of your app, helping you quickly and accurately rectify possible performance problems and continuously improve user experience.
In this codelab, you will build an app that integrates APM. In addition, you can manually trigger network requests to test whether APM can monitor network performance and learn how to view and analyze app performance problems.
A device running Android 4.4 or a later version
To integrate AppGallery Connect APM, you must complete the following preparations:

buildscript {
    repositories {
        // Add the Maven repository.
        maven { url 'https://developer.huawei.com/repo/' }
    }

    dependencies {
        // To benefit from the latest APM features, update your Android gradle plugin.
        // Dependency to version 3.5.3 or later.
        classpath 'com.android.tools.build:gradle:3.5.3'

        // if you had add agc plugin dependence, please update the version to 1.6.2.300. if not, please add agc plugin dependence
        classpath 'com.huawei.agconnect:agcp:1.6.2.300'
    }
}
apply plugin: 'com.android.application'
// Apply the AppGallery Connect plugin.
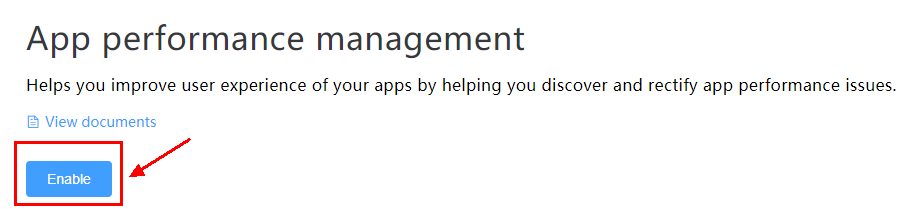
apply plugin: 'com.huawei.agconnect'**enableAPMS**nabl**true**S to true, indicating that the APMS plugin has taken effect.
agcp {
enableAPMS true
}
android {
//..
}
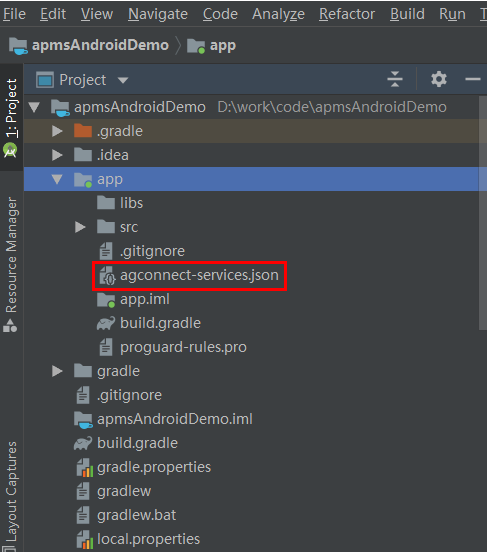
If you are using Android Studio, you need to integrate the APM SDK into your Android Studio project before development.
dependencies {
    // Add the APM SDK library dependency.
    implementation 'com.huawei.agconnect:agconnect-apms:1.5.2.307'
}
-keep class com.huawei.agconnect.apms.**{*;}
-dontwarn com.huawei.agconnect.apms.**
-keep class com.hianalytics.android.**{*;}
-keep class com.huawei.updatesdk.**{*;}
-keep class com.huawei.hms.**{*;}
-keep interface com.huawei.hms.analytics.type.HAEventType{*;}
-keep interface com.huawei.hms.analytics.type.HAParamType{*;}
-keepattributes Exceptions, Signature, InnerClasses, LineNumberTable
(Optional sections are designed to help you better understand the APM service.)
You can create a layout page in your Android Studio project and add nine buttons, as shown in the following figure.
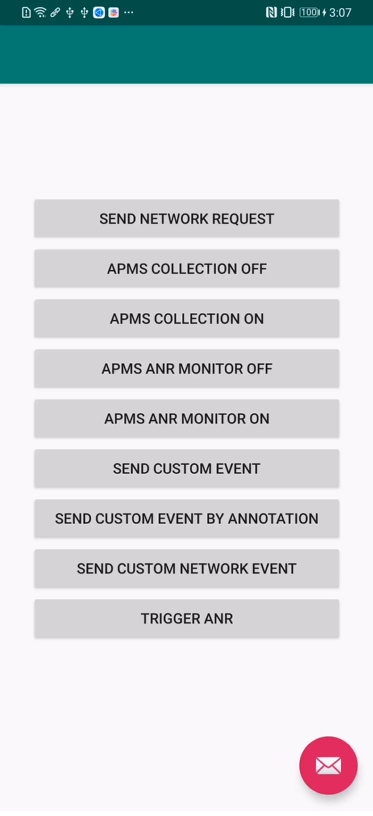
For details about the layout, please refer to the following code in the activity_main.xml file:
<?xml version="1.0" encoding="utf-8"?>
<LinearLayout xmlns:android="http://schemas.android.com/apk/res/android"
    android:layout_width="match_parent"
    android:layout_height="match_parent"
    android:gravity="center"
    android:orientation="vertical">

    <LinearLayout
        android:layout_width="300dp"
        android:layout_height="wrap_content"
        android:gravity="center"
        android:orientation="vertical">

        <Button
            android:id="@+id/btn_network"
            android:layout_width="match_parent"
            android:layout_height="wrap_content"
            android:text="SEND NETWORK REQUEST" />

        <Button
            android:id="@+id/enable_apms_off"
            android:layout_width="match_parent"
            android:layout_height="wrap_content"
            android:text="APMS COLLECTION OFF" />

        <Button
            android:id="@+id/enable_apms_on"
            android:layout_width="match_parent"
            android:layout_height="wrap_content"
            android:text="APMS COLLECTION ON" />

        <Button
            android:id="@+id/enable_apms_anr_off"
            android:layout_width="match_parent"
            android:layout_height="wrap_content"
            android:text="APMS ANR MONITOR OFF" />

        <Button
            android:id="@+id/enable_apms_anr_on"
            android:layout_width="match_parent"
            android:layout_height="wrap_content"
            android:text="APMS ANR MONITOR ON" />

        <Button
            android:id="@+id/custom_normal_event"
            android:layout_width="match_parent"
            android:layout_height="wrap_content"
            android:text="SEND CUSTOM EVENT" />

        <Button
            android:id="@+id/custom_normal_event_by_annotation"
            android:layout_width="match_parent"
            android:layout_height="wrap_content"
            android:text="SEND CUSTOM EVENT BY ANNOTATION" />

        <Button
            android:id="@+id/custom_network_event"
            android:layout_width="match_parent"
            android:layout_height="wrap_content"
            android:text="SEND CUSTOM NETWORK EVENT" />
        <Button
            android:id="@+id/anr_test"
            android:layout_width="match_parent"
            android:layout_height="wrap_content"
            android:text="TRIGGER ANR" />
    </LinearLayout>
</LinearLayout>
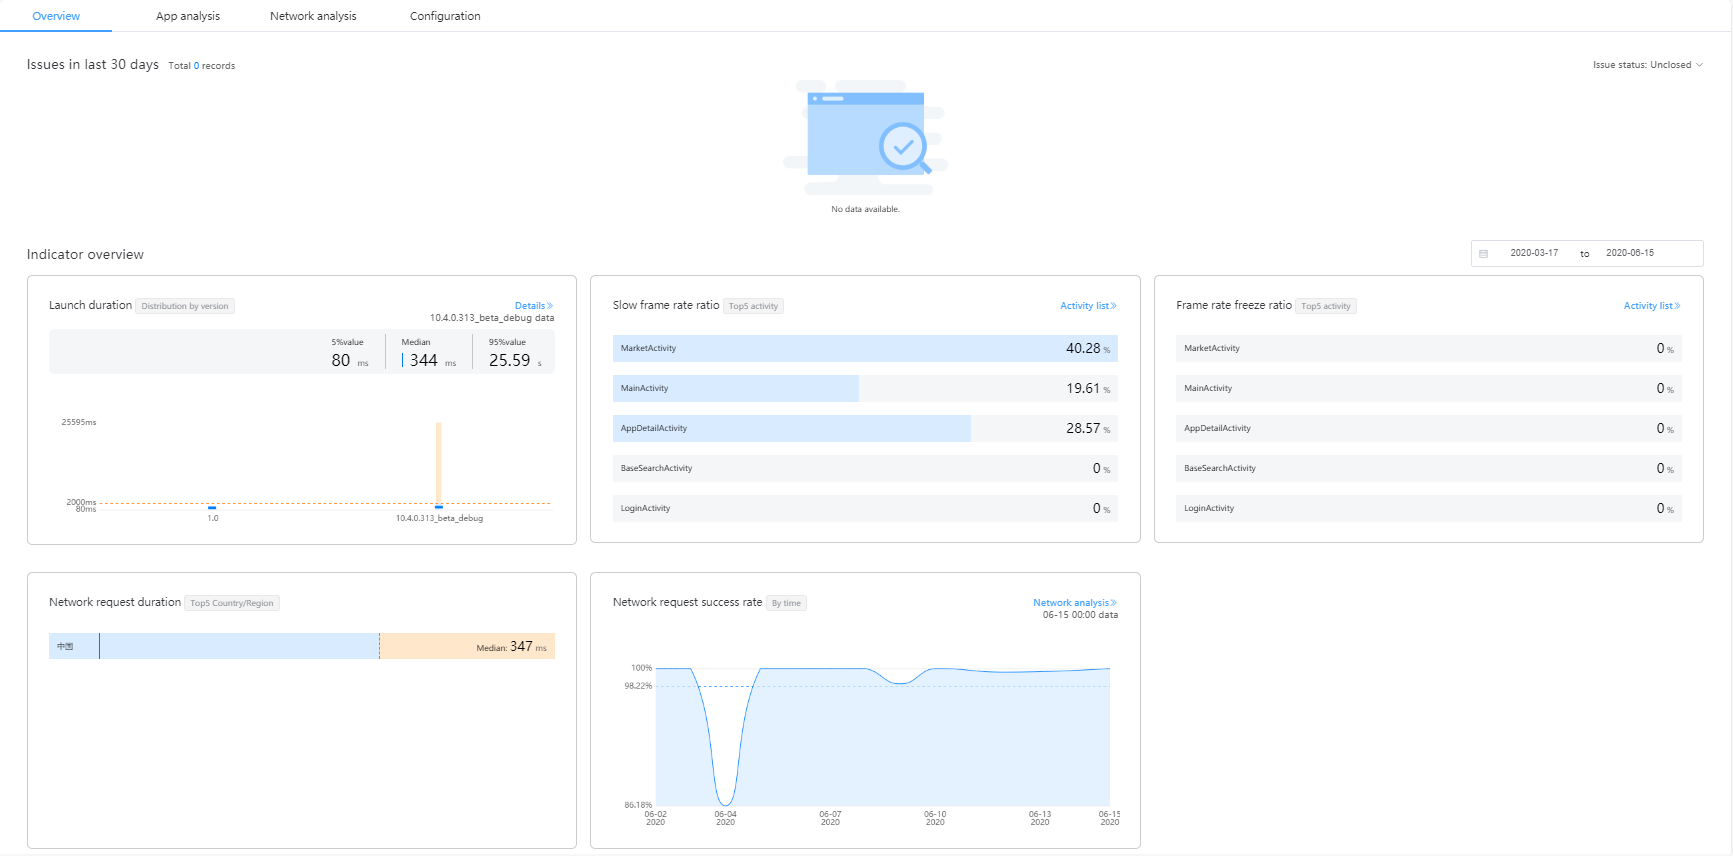
You can manually trigger a network request and check whether the network performance data is normal on the performance management page of APM.
static private String URL = "https://developer.huawei.com/consumer/en/";
static private MediaType MEDIATYPE = MediaType.parse("text/x-markdown; charset=utf-8");
static private String REQUESTBODY = "apms http request test";

static public void oneRequest() {
OkHttpClient okHttpClient = new OkHttpClient();
Request request = new Request.Builder()
        .url(URL)
        .post(RequestBody.create(MEDIATYPE, REQUESTBODY))
        .build();
okHttpClient.newCall(request).enqueue(new Callback() {
    @Override
    public void onFailure(Call call, IOException e) {
        Log.d("apmsAndroidDemo", "onFailure: " + e.toString());
    }
    @Override
    public void onResponse(Call call, Response response) throws IOException {
        Log.d("apmsAndroidDemo", "onResponse: Success");
    }
});
}
Button sendNetworkRequestBtn = findViewById(R.id.btn_network);

sendNetworkRequestBtn.setOnClickListener(view -> {
    Log.d("apmsAndroidDemo", "send network request.");
    HttpUtil.oneRequest();
});
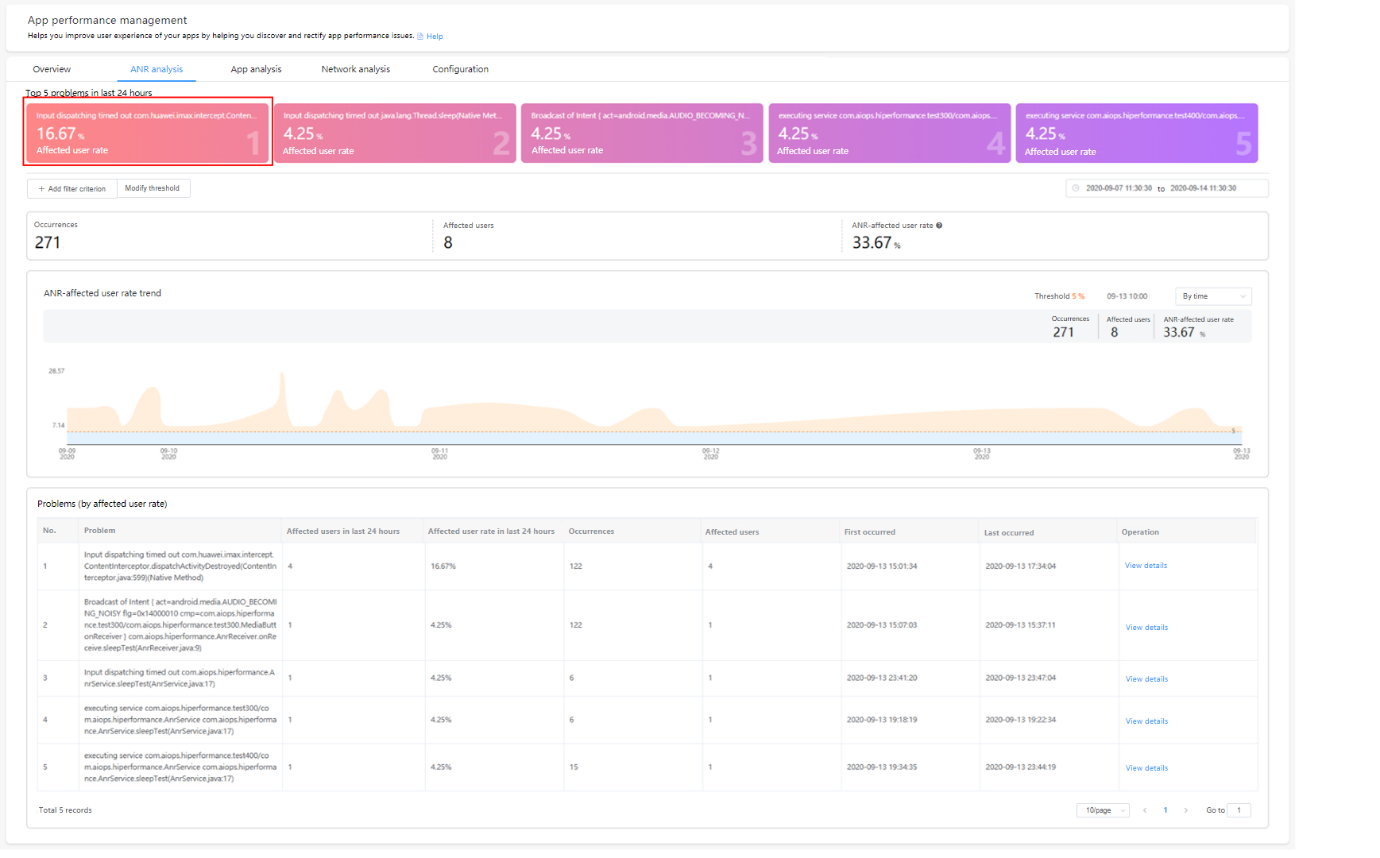
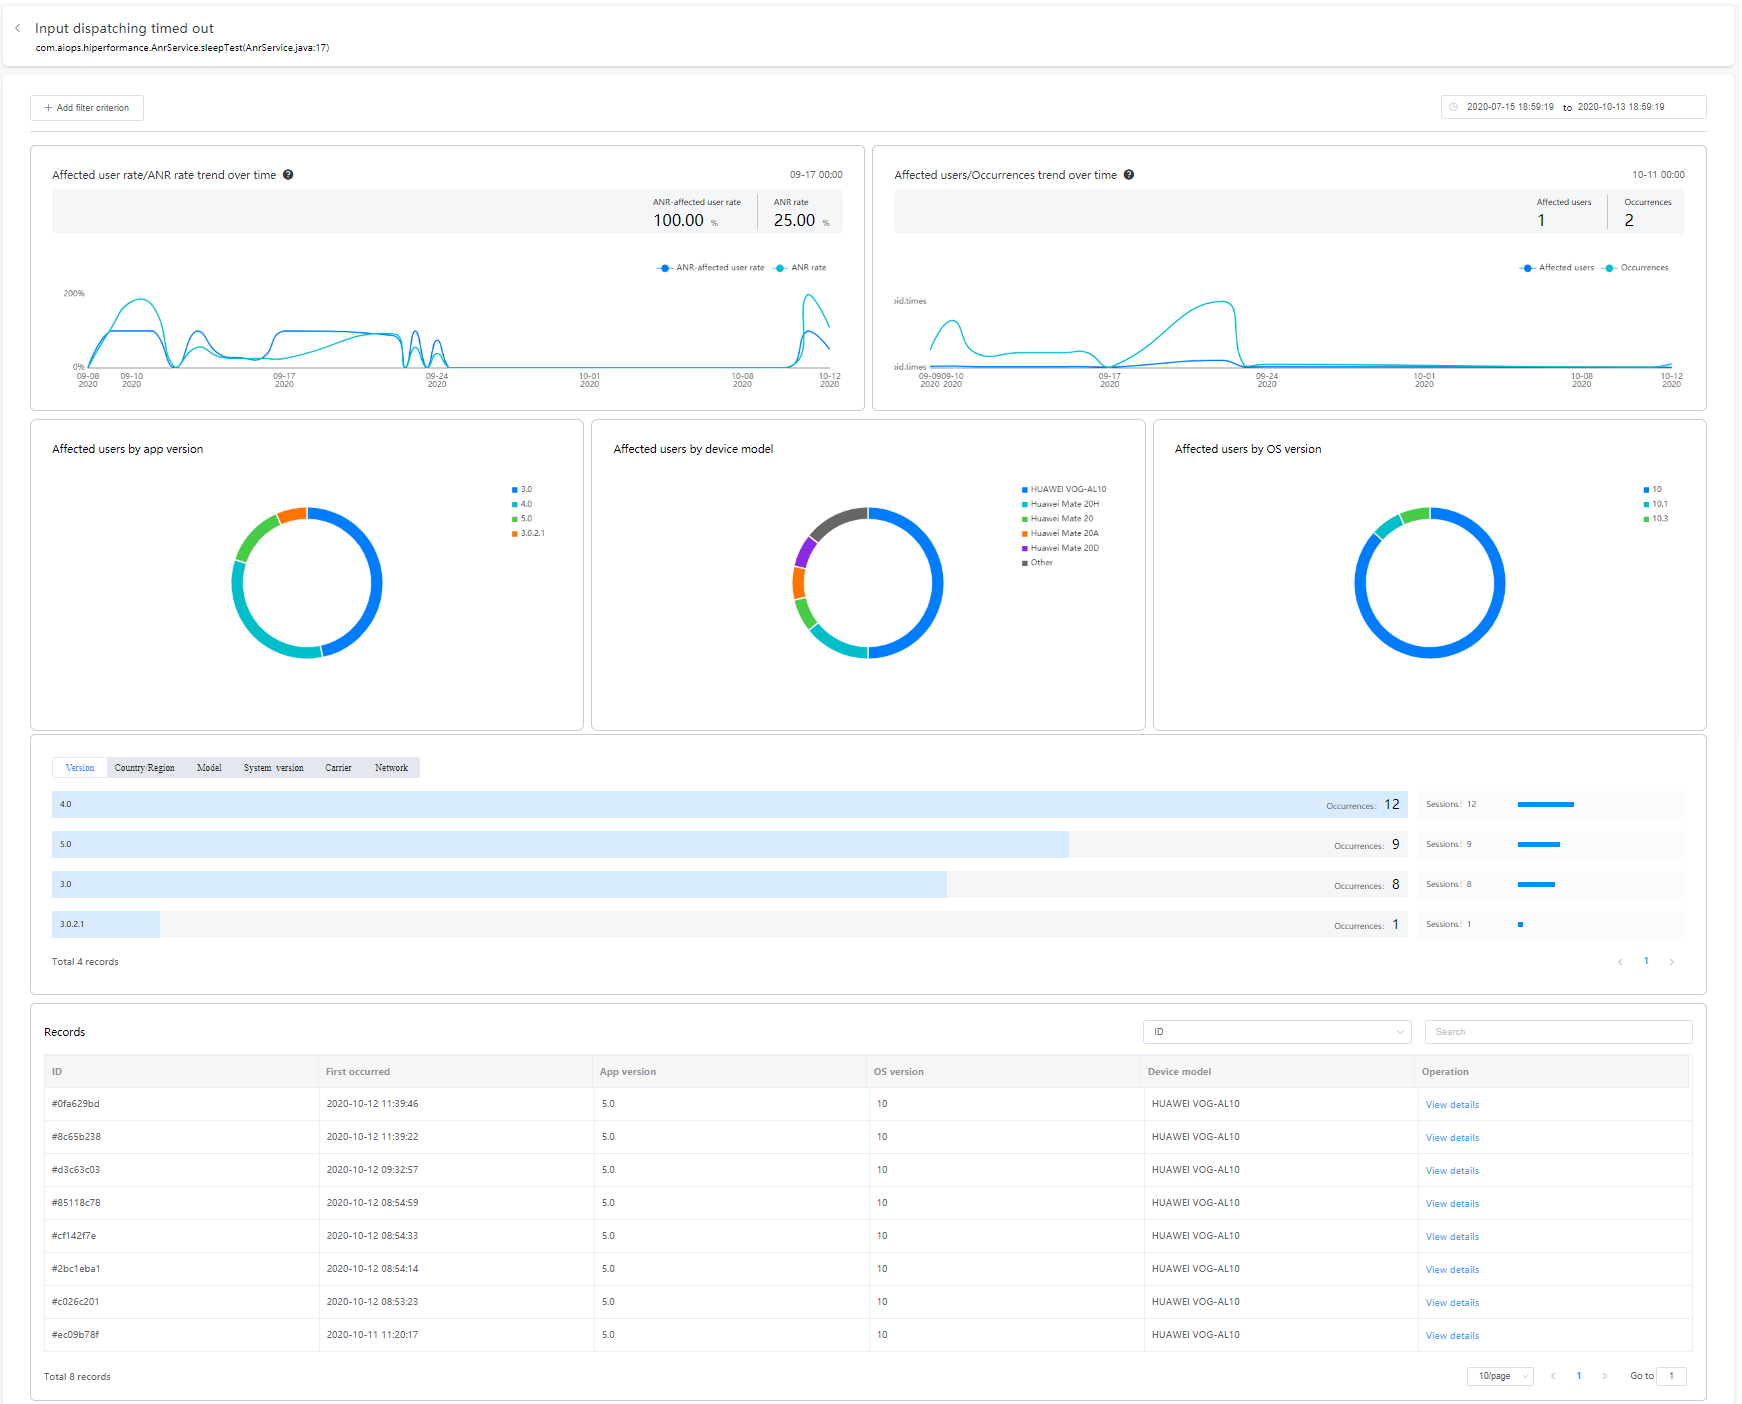
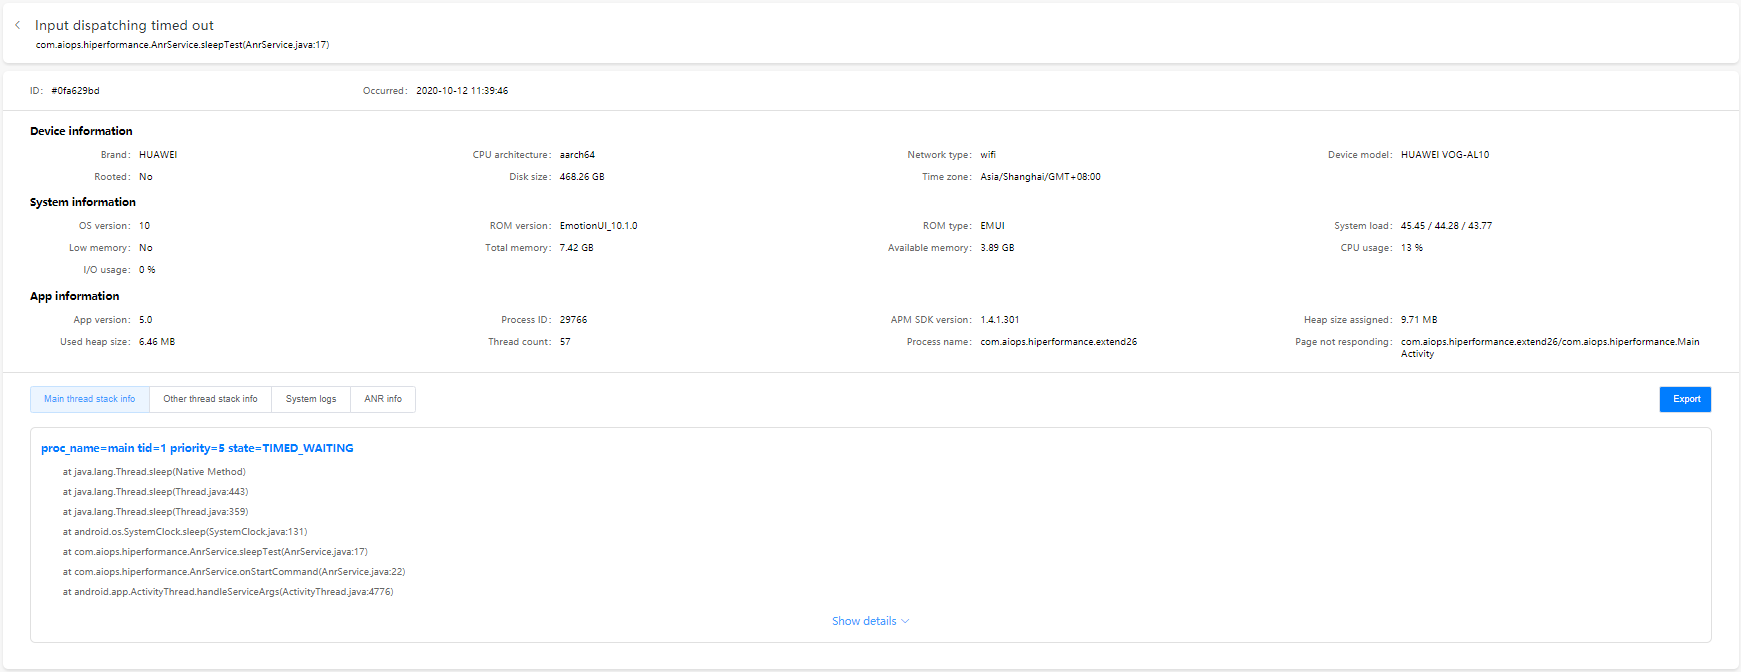
You can manually trigger an ANR event and check whether the ANR data is normal on the performance management page of APM.
this.findViewById(R.id.anr_test).setOnClickListener(v -> {
    Log.d("apmsAndroidDemo", "trigger ANR");
    anrTestEnable = true;
});
private boolean anrTestEnable = false;
@Override
public boolean dispatchKeyEvent(KeyEvent event) {
	if (anrTestEnable) {
		try {
			Thread.sleep(20000);
		} catch (InterruptedException e) {
			e.printStackTrace();
		}
	}
	return super.dispatchKeyEvent(event);
}

@Override
public boolean dispatchTouchEvent(MotionEvent ev) {
	if (anrTestEnable) {
		try {
			Thread.sleep(20000);
		} catch (InterruptedException e) {
			e.printStackTrace();
		}
	}
	return super.dispatchTouchEvent(ev);
}
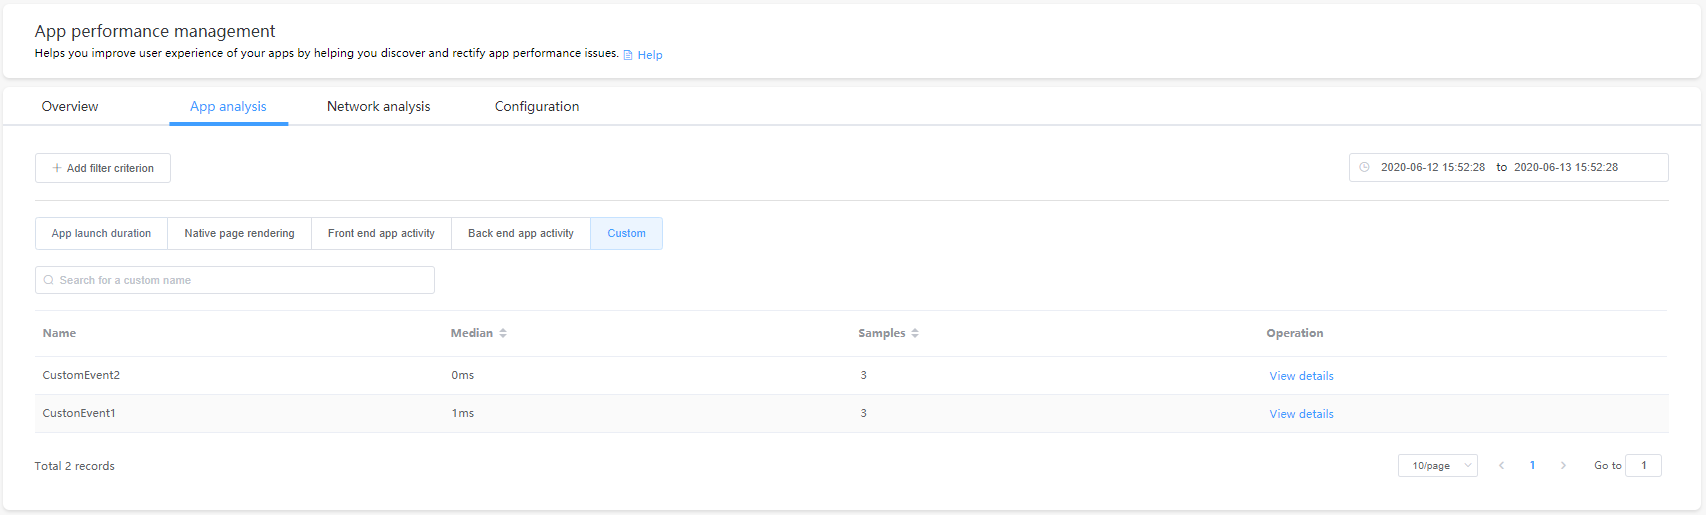
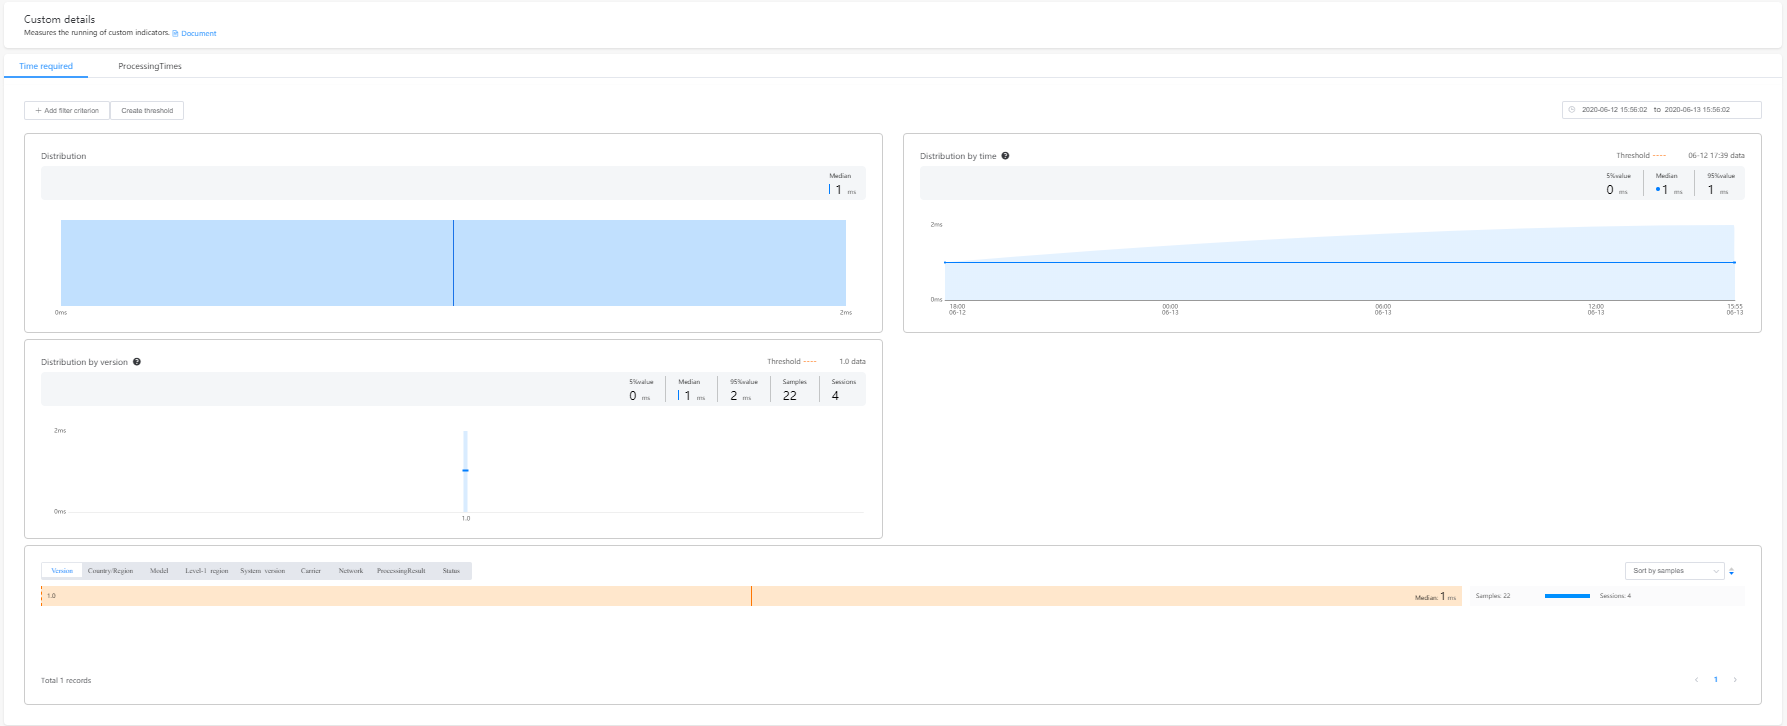
You can manually trigger a custom event and check whether the custom performance indicators are normal on the performance management page of APM.
Reporting Custom Events by Calling an API
findViewById(R.id.custom_normal_event).setOnClickListener(v -> {
    Log.d("apmsAndroidDemo", "send a custom event");
    sendCustomEvent();
});
// Define a custom event.
public void sendCustomEvent() {
    CustomTrace customTrace = APMS.getInstance().createCustomTrace("CustomEvent1");
    customTrace.start();
    // code you want trace
    businessLogicStart(customTrace);
    businessLogicEnd(customTrace);
    customTrace.stop();
}

public void businessLogicStart(CustomTrace customTrace) {
    customTrace.putMeasure("ProcessingTimes", 0);
    for (int i = 0; i < 5; i++) {

customTrace.incrementMeasure("ProcessingTimes", 1);
    }
}

public void businessLogicEnd(CustomTrace customTrace) {
    customTrace.putProperty("ProcessingResult", "Success");
    customTrace.putProperty("Status", "Normal");
}
Reporting Custom Events by Annotation
findViewById(R.id.custom_normal_event_by_annotation).setOnClickListener(v -> {
    Log.d("apmsAndroidDemo", "send a custom event by annotation");
    sendCustomEventByAnnotation();
});
private void sendCustomEventByAnnotation() {
customEventHandle();
}
// Define a custom event by annotation.
@AddCustomTrace(name = "CustomEvent2")
public void customEventHandle() {
}
Reporting Custom Network Events by Calling an API
findViewById(R.id.custom_network_event).setOnClickListener(v -> {
    Log.d("apmsAndroidDemo", "send a custom network event");
    new Thread(HttpUtil::customNetworkEvent).start();
});
static public void customNetworkEvent() {
    OkHttpClient okHttpClient = new OkHttpClient();
    Request request = new Request.Builder()
            .url(URL)
            .post(RequestBody.create(MEDIATYPE, REQUESTBODY))
            .build();
    // Define a custom network event.
    NetworkMeasure networkMeasure = APMS.getInstance().createNetworkMeasure(URL, "POST");
    networkMeasure.setBytesSent(request.headers().byteCount());
    long bytesRecive = 0L;
    networkMeasure.start();
    try {
        Response response = okHttpClient.newCall(request).execute();
        networkMeasure.setStatusCode(response.code());
        if (response.body() != null) {
            networkMeasure.setBytesReceived(response.body().contentLength());
            networkMeasure.setContentType(Objects.requireNonNull(response.body().contentType()).toString());
            bytesRecive = dealResponseBody(response.body());
            response.body().close();
        }
        networkMeasure.putProperty("TransferBytes", String.valueOf(bytesRecive));
        networkMeasure.stop();
    } catch (IOException e) {
        networkMeasure.setStatusCode(0);
        classErrorMessage(networkMeasure, e);
        networkMeasure.putProperty("ErrorMessage", e.getMessage());
        networkMeasure.putProperty("Transfer Bytes", String.valueOf(bytesRecive));
        networkMeasure.stop();
    }
}

private static void classErrorMessage(NetworkMeasure networkMeasure, Exception e) {
    if (e instanceof UnknownHostException) {
        networkMeasure.putProperty("ErrorMessage", "DNS resolution failure");
    }
}
private static long dealResponseBody(ResponseBody body) throws IOException {
    InputStream inputStream = body.byteStream();
    byte[] result = new byte[1000];
    long len = 0;
    long readBytes = 0;
    while ((len = inputStream.read(result)) != -1) {
        readBytes += len;
    }
    return readBytes;
}
findViewById(R.id.enable_apms_on).setOnClickListener(v -> {
    Log.d("apmsAndroidDemo", "enable Collection");
    APMS.getInstance().enableCollection(true);
});
findViewById(R.id.enable_apms_off).setOnClickListener(v -> {
    Log.d("apmsAndroidDemo", "disable Collection");
    APMS.getInstance().enableCollection(false);
});
findViewById(R.id.enable_apms_anr_on).setOnClickListener(v -> {
    Log.d("apmsAndroidDemo", "enable ANR Collection");
    APMS.getInstance().enableAnrMonitor(true);
});
findViewById(R.id.enable_apms_anr_off).setOnClickListener(v -> {
    Log.d("apmsAndroidDemo", "disable ANR Collection");
    APMS.getInstance().enableAnrMonitor(false);
});
During app debugging, you can enable the APM debug log function to check whether the APM performance monitoring is running properly. Add the meta-data element to the AndroidManifest.xml file of your app.
<application>
    <!-- Set this flag to 'true', debug logs of APM will be printed in logcat, default value is 'false'-->
    <meta-data
      android:name="apms_debug_log_enabled"
      android:value="true" />
</application>
The Logcat log filter function allows you to filter performance monitoring logs of app launches, app screen rendering, and HTTP/HTTPS network requests. These logs are marked as com.huawei.agc.apms so that you can filter them by entering apms in the Logcat window of IDE, as shown in the following figure.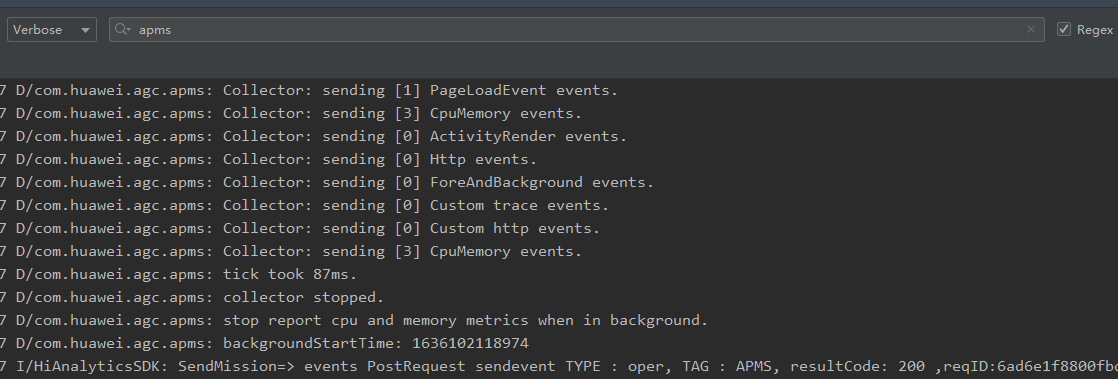
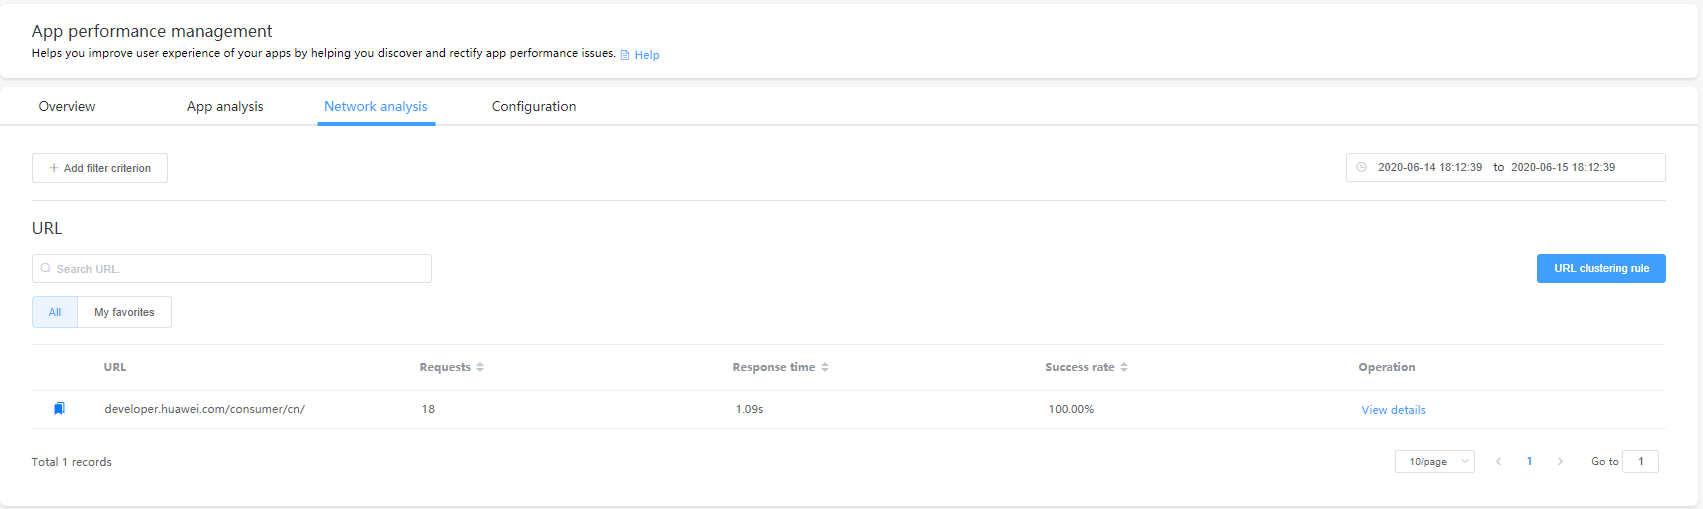
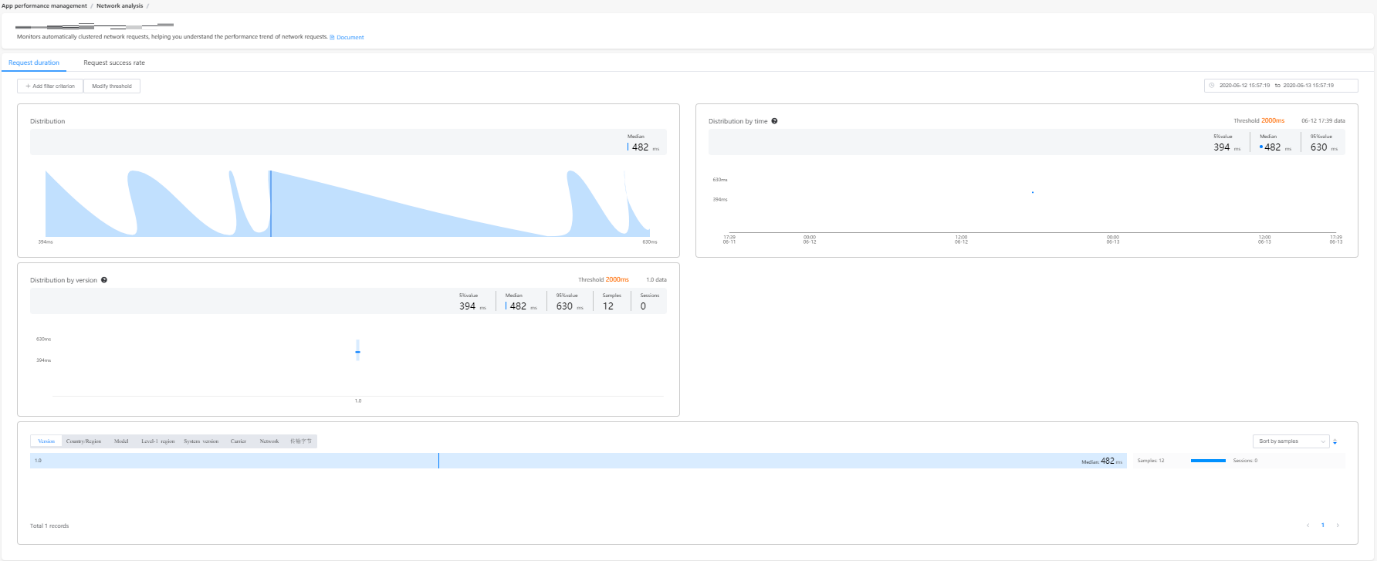
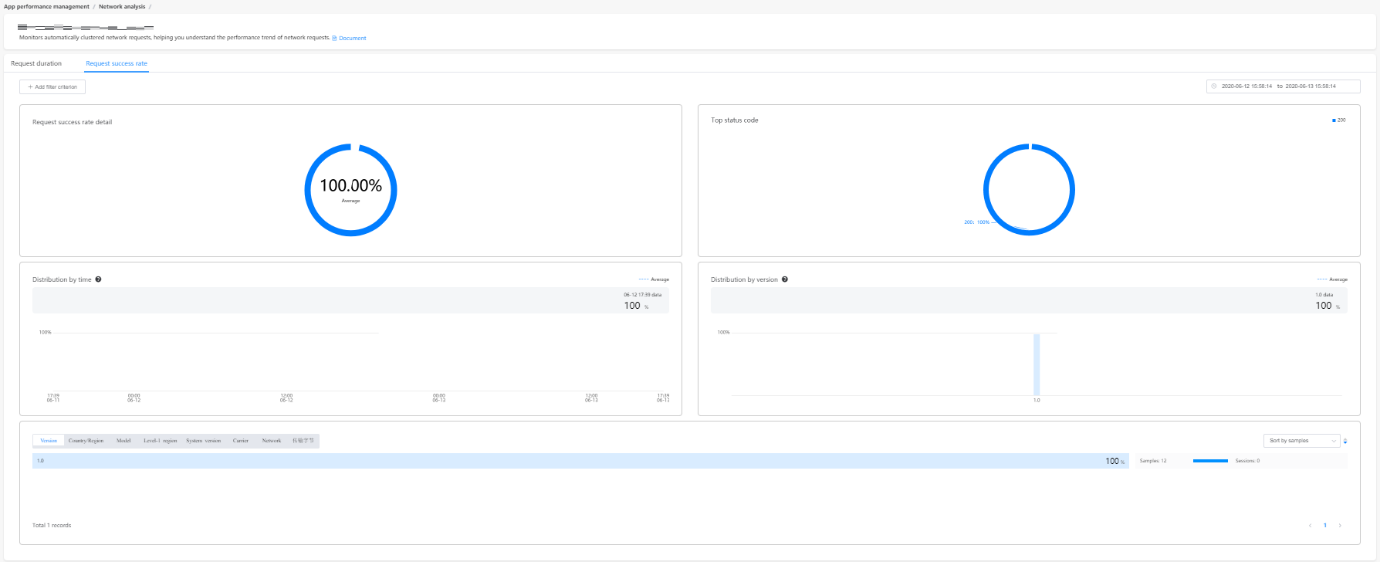
There is no separate entry for viewing custom network events. The procedure is the same as that for viewing network analysis data. If any property is set, you can view the request duration and request success rate of that property by clicking View details.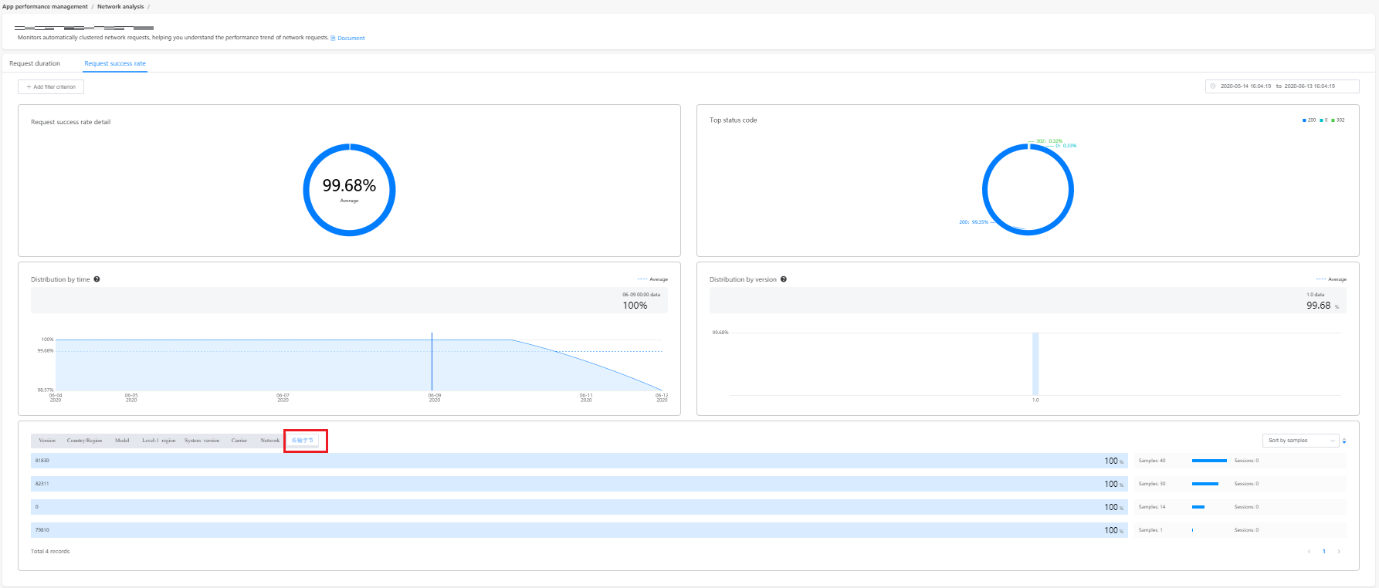
Well done. You have successfully created an app that integrates APM of AppGallery Connect and learned how to view and analyze app performance data on the app performance management page.