The Web component supports debugging of web frontend pages by using DevTools, a web frontend development and debugging tool that allows you to debug an application's frontend pages on a PC. Before you do this, use setWebDebuggingAccess() to enable frontend page debugging for the Web component and make sure the test device connected to the PC runs 4.1.0 or a later version.
To use DevTools for frontend page debugging, perform the following steps:
-
Enable web frontend page debugging in the application code.
// xxx.ets import { webview } from '@kit.ArkWeb'; @Entry @Component struct WebComponent { controller: webview.WebviewController = new webview.WebviewController(); aboutToAppear() { // Enable web frontend page debugging. webview.WebviewController.setWebDebuggingAccess(true); } build() { Column() { Web({ src: 'www.example.com', controller: this.controller }) } } } -
Declare the required permission in the module.json5 file of the HAP module in the application project in DevEco Studio. For details, see Declaring Permissions in the Configuration File.
"requestPermissions":[ { "name" : "ohos.permission.INTERNET" } ] -
Connect your device to a PC, and configure port mapping on the PC as follows:
// Search for the domain socket name required for DevTools. The name is related to the process ID. After the application being debugged is restarted, repeat this step to complete port forwarding.
cat /proc/net/unix | grep devtools
// Configure port mapping. Replace [pid] with the actual process ID.
hdc fport tcp:9222 localabstract:webview_devtools_remote_[pid]
// View port mapping.
hdc fport ls
Example:
hdc shell
cat /proc/net/unix | grep devtools
// Display webview_devtools_remote_3458.
exit
hdc fport tcp:9222 localabstract:webview_devtools_remote_3458
hdc fport ls
-
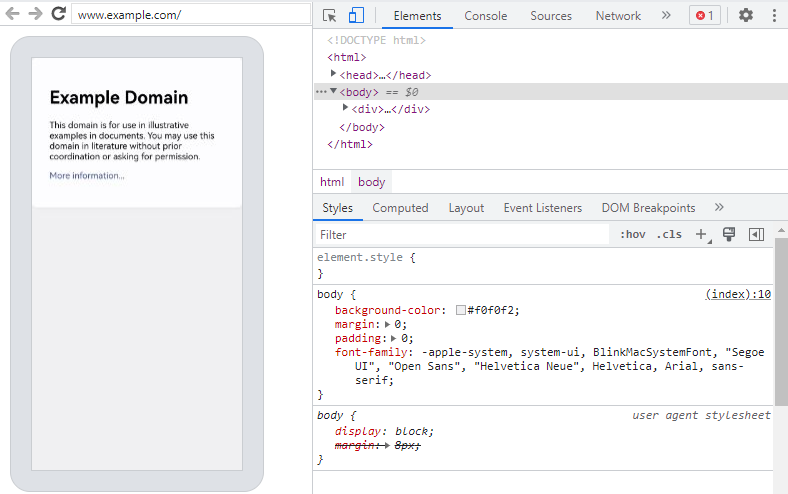
Enter chrome://inspect/#devices in the address box of the Chrome browser on the PC. Once the device is identified, you can get started with page debugging. The debugging effect is as follows:
Figure 1 Successful device identification
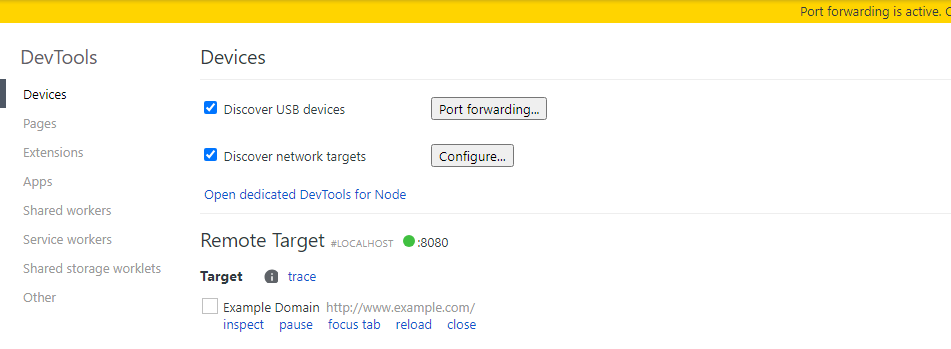
Figure 2 Page debugging effect
-
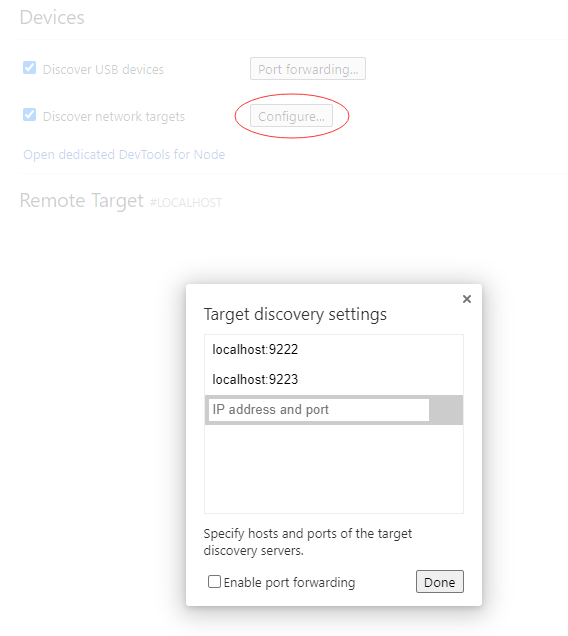
To debug multiple applications, click Configure under Devices and add multiple port numbers.
Figure 3 Adding port numbers
-
You can use a script to accelerate debugging on Windows as follows: Create a .bat file that contains the following information, start the application to debug, and run the script:
@echo off setlocal enabledelayedexpansion :: Initialize port number and PID list set PORT=9222 set PID_LIST= :: Get the list of all forwarded ports and PIDs for /f "tokens=2,5 delims=:_" %%a in ('hdc fport ls') do ( if %%a gtr !PORT! ( set PORT=%%a ) for /f "tokens=1 delims= " %%c in ("%%b") do ( set PID_LIST=!PID_LIST! %%c ) ) :: Increment port number for next application set temp_PORT=!PORT! set /a temp_PORT+=1 set PORT=!temp_PORT! :: Get the domain socket name of devtools for /f "tokens=*" %%a in ('hdc shell "cat /proc/net/unix | grep devtools"') do ( set SOCKET_NAME=%%a :: Extract process ID for /f "delims=_ tokens=4" %%b in ("!SOCKET_NAME!") do set PID=%%b :: Check if PID already has a mapping echo !PID_LIST! | findstr /C:" !PID! " >nul if errorlevel 1 ( :: Add mapping hdc fport tcp:!PORT! localabstract:webview_devtools_remote_!PID! if errorlevel 1 ( echo Error: Failed to add mapping. pause exit /b ) :: Add PID to list and increment port number for next application set PID_LIST=!PID_LIST! !PID! set temp_PORT=!PORT! set /a temp_PORT+=1 set PORT=!temp_PORT! ) ) :: If no process ID was found, prompt the user to open debugging in their application code and provide the documentation link if "!SOCKET_NAME!"=="" ( echo No process ID was found. Please open debugging in your application code using the corresponding interface. You can find the relevant documentation at this link: [https://gitee.com/openharmony/docs/blob/master/zh-cn/application-dev/web/web-debugging-with-devtools.md] pause exit /b ) :: Check mapping hdc fport ls echo. echo Script executed successfully. Press any key to exit... pause >nul :: Try to open the page in Edge start msedge chrome://inspect/#devices.com :: If Edge is not available, then open the page in Chrome if errorlevel 1 ( start chrome chrome://inspect/#devices.com ) endlocal -
You can use a script to accelerate debugging on macOS or Linux: Create an .sh file that contains the following information (pay attention to chmod and format conversion), start the application to debug, and run the script:
#!/bin/bash

# Get current fport rule list
CURRENT_FPORT_LIST=$(hdc fport ls)

# Delete the existing fport rule one by one
while IFS= read -r line; do
    # Extract the taskline
    IFS=' ' read -ra parts <<< "$line"
    taskline="${parts[1]} ${parts[2]}"

    # Delete the corresponding fport rule
    echo "Removing forward rule for $taskline"
    hdc fport rm $taskline
    result=$?

    if [ $result -eq 0 ]; then
        echo "Remove forward rule success, taskline:$taskline"
    else
        echo "Failed to remove forward rule, taskline:$taskline"
    fi

done <<< "$CURRENT_FPORT_LIST"

# Initial port number
INITIAL_PORT=9222

# Get the current port number, use initial port number if not set previously
CURRENT_PORT=${PORT:-$INITIAL_PORT}

# Get the list of all PIDs that match the condition
PID_LIST=$(hdc shell cat /proc/net/unix | grep webview_devtools_remote_ | awk -F '_' '{print $NF}')

if [ -z "$PID_LIST" ]; then
    echo "Failed to retrieve PID from the device"
    exit 1
fi

# Increment the port number
PORT=$CURRENT_PORT

# Forward ports for each application one by one
for PID in $PID_LIST; do
    # Increment the port number
    PORT=$((PORT + 1))

    # Execute the hdc fport command
    hdc fport tcp:$PORT localabstract:webview_devtools_remote_$PID

    # Check if the command executed successfully
    if [ $? -ne 0 ]; then
        echo "Failed to execute hdc fport command"
        exit 1
    fi
done

# List all forwarded ports
hdc fport ls