DevEco Studio provides a wide range of debugging features, which can be used to detect and rectify program errors during NDK development. These debugging features include:
Debugging using a real device: Run your application or atomic service on a real device to see how it behaves on the device. For details, seeDebugging using a real device.
During debugging, if the source code path of the .so file of the local compilation device is different from the configured C++ source code path, fix the issue using either of the following methods:
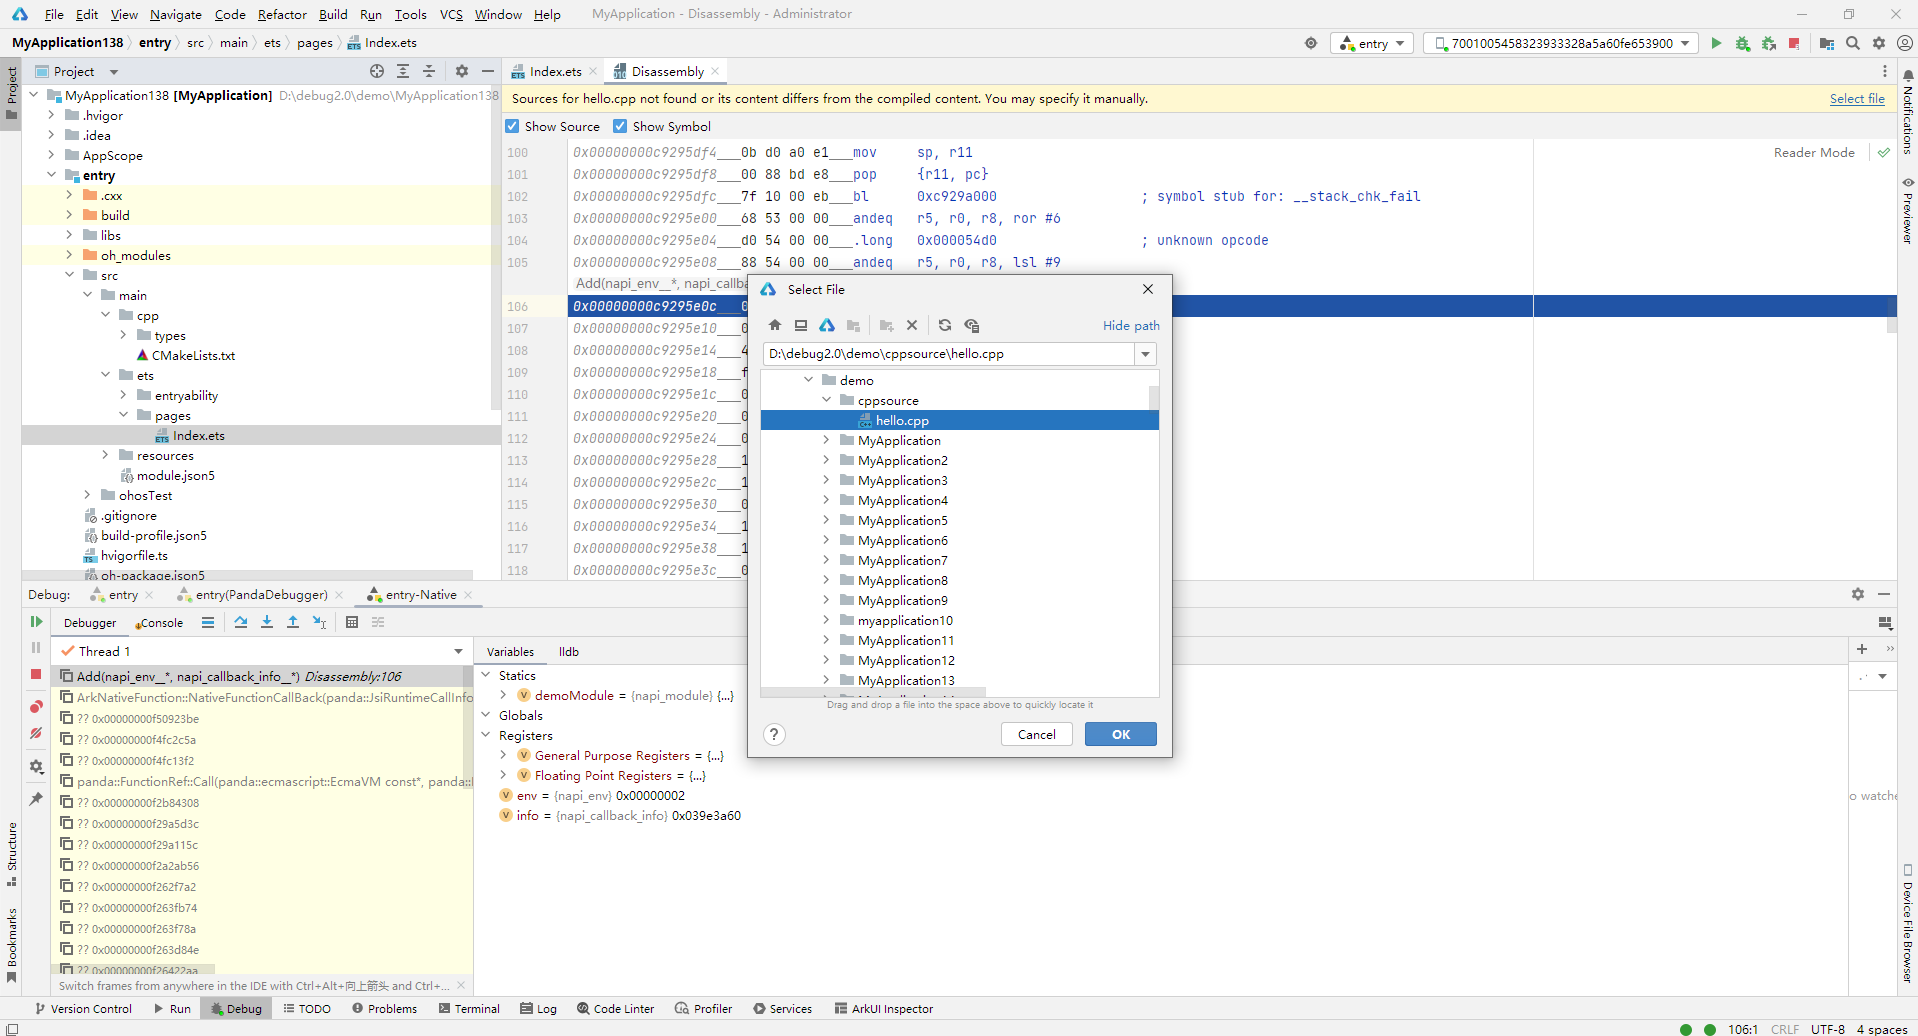
Create the mapping between files.
After you debug code with the Step Into feature, you will be prompted to associate the source code. Click Select file and select the local C++ source code for association. For details, seeDebugging of Third-Party Source Code.
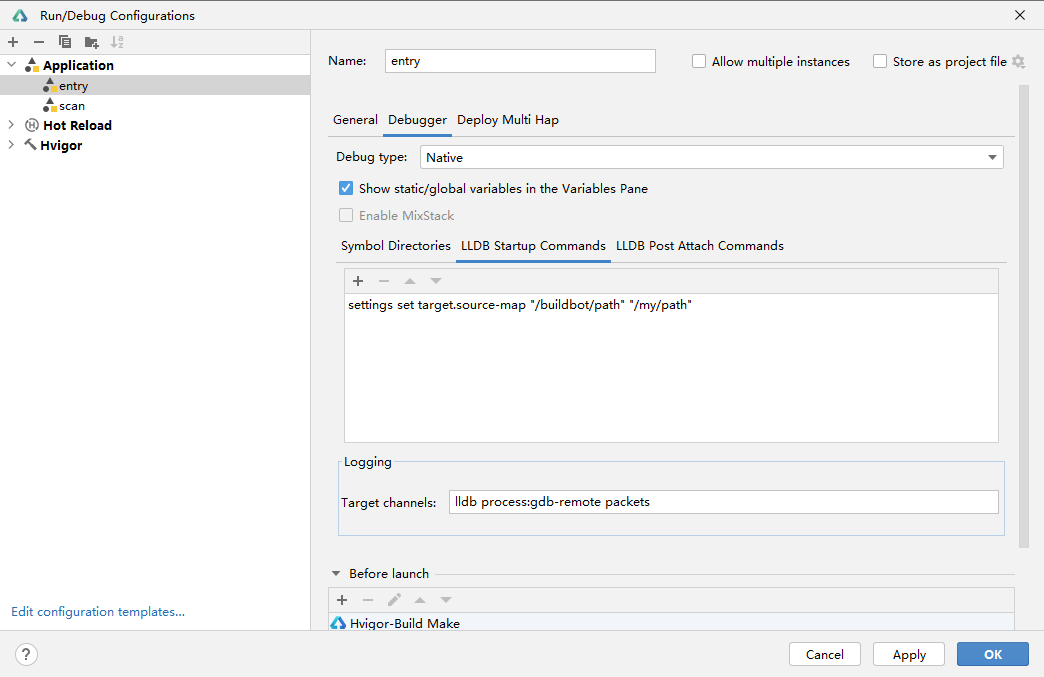
Create the mapping between paths.
Choose Run > Edit Configurations, select a module, switch to the Debugger tab, select Native, and add the settings set target.source-map "/buildbot/path" "/my/path" command on the LLDB Startup Commands tab page to establish the mapping. Parameter 1 indicates the source code path in the compilation environment, and parameter 2 indicates the local source code path.
C/C++ reverse debugging: During debugging, you can roll back to historical lines and breakpoints to view related variable information. For details, seeC/C++ Reverse Debugging.