You can launch the debugger to start and debug your app/atomic service in sequence or attach the debugger to an app that is already running. For details, see Starting and Debugging an App and Debugging an App in Running.
In the debugging configuration, set Debug type to Dual (ArkTS/JS + Native), Native, or Detect Automatically. The configuration takes effect in the next debugging.

- If Debug type is Detect Automatically, the debugger determines the debugging type based on the code type detected.
- During debugging, enabling compiler optimization – by adding optimization options – or using the release build mode – can lead to more efficient code execution, as the compiler modifies the assembly instructions. However, this optimization can complicate the mapping back to the original source code, potentially causing debugging issues such as unexpected deletion of local variable information or incorrect line breakpoints. To prevent such optimization-related exceptions during debugging, you are advised to disable optimization or use the debug build mode.
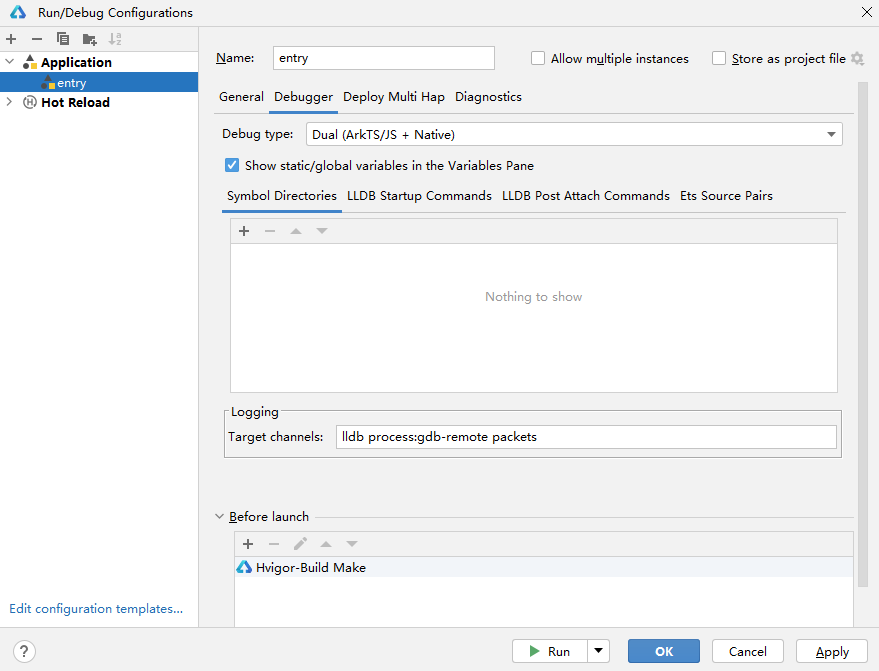
Displaying Static/Global Variables
To display static/global variables in the Variables pane during the debugging process, select Show static/global variables in the Variables Pane.
Adding Symbol Directories
On the Symbol Directories tab page, you can click + to add the path of a symbol table, that is, a .so library with debugging information. For example, you can generate a .so library with debugging information, run the library without debugging information on the device, and debug the .so library by adding the path of the .so library with debugging information here.
Setting Debugger Commands
You can set LLDB commands on the LLDB Startup Commands and LLDB Post Attach Commands tab pages.
The commands set on the LLDB Startup Commands tab are executed immediately after the LLDB debugger is started, and the commands set on the LLDB Post Attach Commands tab are executed after the LLDB debugger is successfully attached to a process.