DevEco Studio provides a variety of debug features. You can debug your app/atomic service written in a single programming language like JS, ArkTS, or C/C++, or multiple languages, and debug third-party library source code.
You can debug your app/atomic service on a real device or Previewer provided by DevEco Studio. The following figure shows the process of debugging an app/atomic service on a real device.
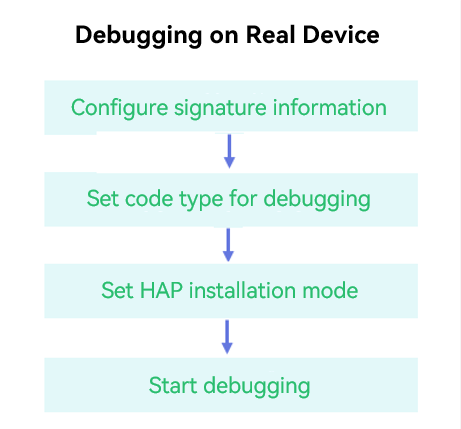
- Set signing configuration: Before debugging your app/atomic service on a real device, sign the HAP. Signing is not required for debugging with the Previewer.
- Set the code type for debugging: The default type is Detect Automatically.
- Set the HAP installation mode: You can uninstall the app/atomic service and then reinstall it, or install the app/atomic service in overwrite mode.
- Start debugging: You can start your app/atomic service and debug it or debug an app/atomic service that is already running.
Constraints for Using the Previewer
When your app/atomic service is debugged on a real device, the modified code can be updated to the debug environment after a long compile and installation process. Using the Previewer, you can run the app/atomic service and view the GUI display effect on DevEco Studio immediately after modifying the code.
You can use the Previewer to run and debug Ability lifecycle code and UI code. The Previewer provides basic debug features, including setting breakpoints, executing debugging, and viewing variables.
When using the Previewer for debugging, observe the following:
- Only one debugging task is allowed in a project.
- The common preview mode and preview debugging mode are mutually exclusive. That is, you can use only one of them.
- The Previewer does not support the following:
- Attaching the debugger to a running process
- Debugging across abilities
- Debugging of C++ code
- Instant preview
- Hot reload
- Multi-process and worker/TaskPool debugging