


Intelligent Assistant
Chat with our virtual assistant to get answers promptly.
Records changes in the CPU power management scheme through the Linux kernel ftrace infrastructure.
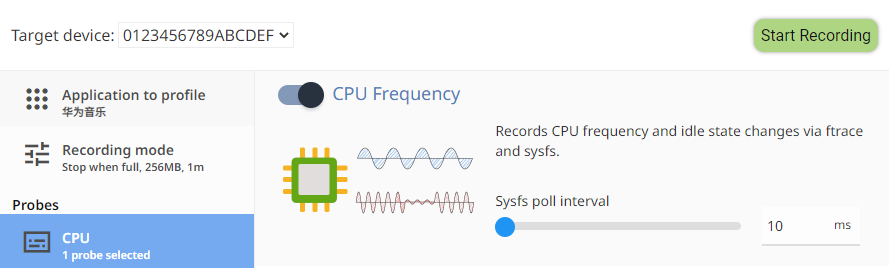
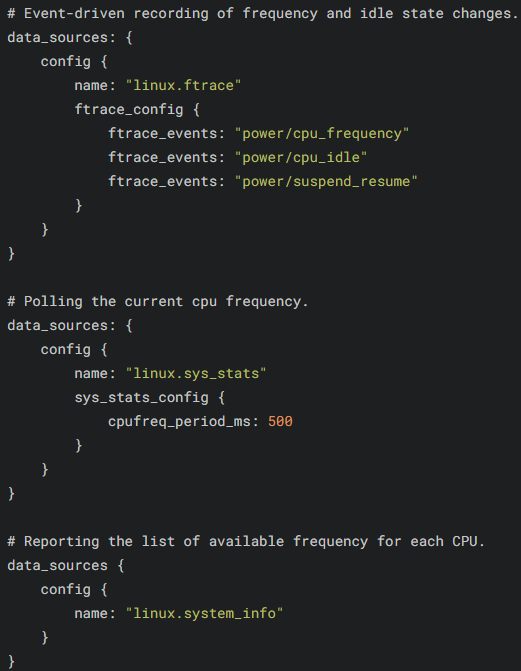
There are two ways to obtain CPU frequency data:
On most HarmonyOS devices, frequency scaling is performed based on the cluster (group of big/little cores). Therefore, it is common to see that four CPUs change the frequency at the same time.
By enabling the linux.system_info data source, it is possible to record the full list of frequencies supported by each CPU in one attempt. This will record /sys/devices/system/cpu/cpu*/cpufreq/scaling_available_frequencies when the trace recording starts.
This is not supported on modern Intel platforms for the same aforementioned reasons of power/cpu_frequency.
When no threads are eligible to be executed (for example, they are all in the sleeping states), the kernel sets the CPU into an idle state, turning off some of the circuitry to reduce idle power usage. Most modern CPUs have more than one idle states: deeper idle states use less power but also require more time to resume.
Idle transitions are relatively fast. A CPU can enter and leave idle states hundreds of times in a second. Idleness must not be confused with full device suspension, since the latter is a stronger and more invasive power saving state. CPUs can be idle even when the screen is on and the device looks operational.
On the UI, the CPU frequency and idle rate are displayed on the same track. The height of the track represents the frequency, and the coloring represents the idle state (colored: not-idle; gray: idle). Hovering or clicking a point in the track will reveal both the frequency and the idle state.

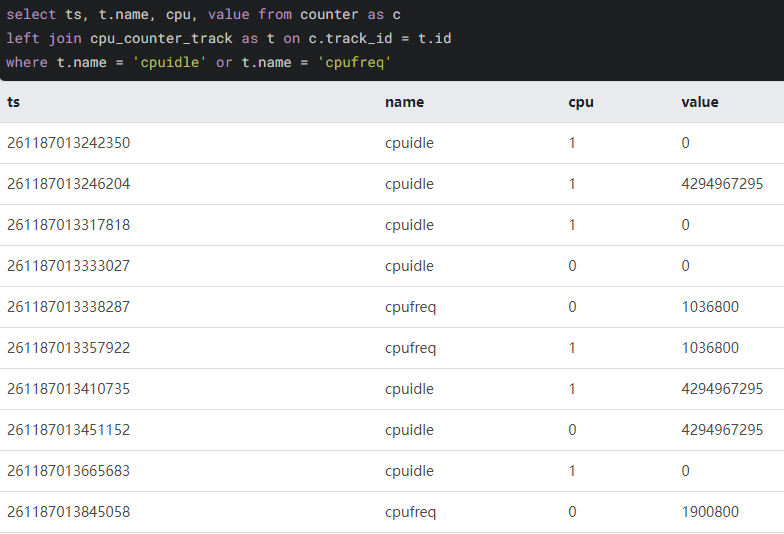
Both frequency and idle states are counters. Note that the cpuidle value 0xffffffff (4294967295) means back to the not-idle state.
Full-device suspension happens when a laptop is put in sleeping mode or when a smartphone display is turned off for a long time. When the device is suspended, most of the hardware units are turned off, entering the highest power-saving state possible (other than complete shutdown).
Most HarmonyOS devices do not suspend immediately after their screens dim but will suspend if their screens are forcibly turned off through the power button. The UI does not clearly indicate the suspend state.