


Intelligent Assistant
Chat with our virtual assistant to get answers promptly.
Open the Pipeline State window, and choose VS > View or FS > View to view the shader content.

Currently, the Bisheng Shader Statistics tool supports the following chips:
Choose . Shader 1077 is used as an example, as shown in the following figure.
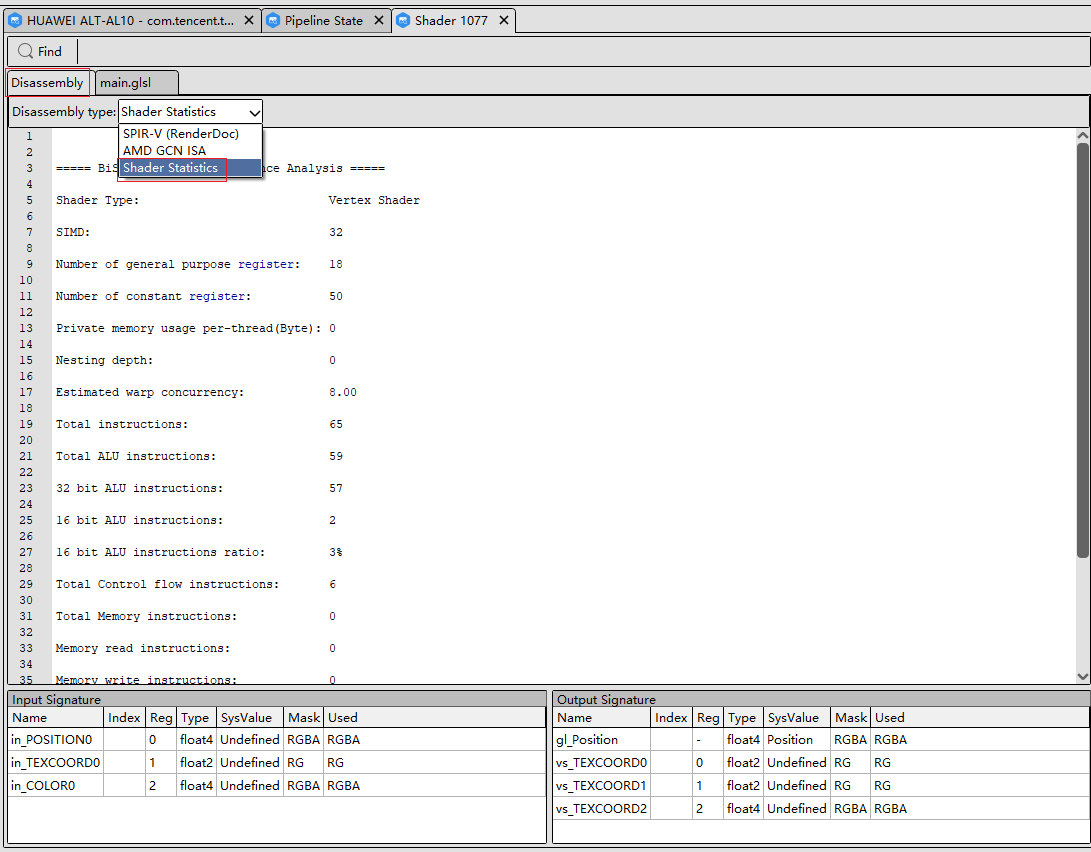
Name | Description | Impact | Suggestion |
|---|---|---|---|
Shader Type | Shader type. | - | - |
SIMD | Number of threads in a warp. The value can be 32 or 64. The compiler selects a value based on the shader type and content. | - | - |
Number of general purpose register | Number of used general-purpose registers. | Registers affect the number of concurrent warps, which affects the GPU execution efficiency. | SIMD32: ≤ 64 (Excellent) ≤ 84 (Good) > 128 (Poor) SIMD64: ≤ 32 (Excellent) ≤ 42 (Good) > 64 (Poor) |
Number of constant register | Number of used constant registers. It usually includes literal constants, uniform modifier variables, and built-in variables. | Constant registers are used to reduce UBO access or accelerate the computation between constants. | Check whether the value of this indicator is close to the upper limit (vs/fs: 512, cs: 1024). If the value reaches the upper limit, you are advised to reduce the UBO size or manually combine constants for computation. |
Private memory usage per-thread (Byte) | Size of the private memory used by each thread, in bytes. Generally, the local array variable is used in the shader or there are too many variables, resulting in register spilling. | The efficiency of accessing variables with the private memory is low, which greatly affects the performance. | 1. Avoid non-constant subscript indexes of local array variables. 2. Reduce the number of local array variables or the lifetime of variables, to avoid register spilling. |
Nesting depth | Branch nesting depth. | GPU execution requires additional units to record and restore branch information, and the branch record unit is shared within the warps. Therefore, too deep branch nesting may lower warp concurrency. | ≤ 4 (Excellent) ≤ 8 (Good) > 12 (Poor) |
Estimated warp concurrency | Number of warps delivered in an execution unit at the same time (warp concurrency). | When the execution unit encounters data dependency which causes inter-instruction waiting, another warp can be used to improve the utilization of the execution unit. | ≥ 4 (Excellent) ≥ 3 (Good) ≤ 2 (Poor) |
Total instructions | Total number of instructions. | If the total number of instructions is large, the execution time of a single shader may be long. In addition, the cache of the instruction segment is affected. | Avoid oversized shaders. |
Total ALU instructions | Total number of computing instructions. | - | - |
32 bit ALU instructions | Number of 32-bit computing instructions, which corresponds to full-precision computing (highp). | - | - |
16 bit ALU instructions | Number of 16-bit computing instructions, which corresponds to half-precision computing (mediump/lowp). | - | - |
16 bit ALU instructions ratio | Percentage of 16-bit computing instructions to total computing instructions. | In Maleoon 910 SIMD64, the efficiency of 16-bit computing instructions is twice that of 32-bit computing instructions. Therefore, increasing the percentage of the half-precision computing can improve the GPU execution efficiency. | It is recommended that the half-precision percentage of precision-insensitive render passes such as lighting and post-processing be 20%. |
Total Control flow instructions | Number of control flow instructions. | The GPU architecture is suitable for parallel computing. Too many branches may cause thread forking in a warp, resulting in low execution efficiency. In addition, the execution efficiency of control flow instructions is lower than that of common ALU instructions. | 1. Minimize the control flows in the shader. 2. Replace simple control flows with ternary operations or numeric operations. 3. Use uniform as the branch judgment condition. 4. Use constant loops for the for loop. |
Total Memory instructions | Number of memory access instructions. | The memory access latency is long, which may cause low GPU execution efficiency and affect the bandwidth. | 1. Combine memory access operations as much as possible to reduce memory access of invalid components or components one by one. 2. Properly arrange the sequence of memory access operations, to improve the cache hit rate. |
Memory read instructions | Number of memory read instructions. | - | - |
Memory write instructions | Number of memory write instructions. | - | - |
Total texture instructions | Number of sampling instructions. | Similar to memory access instructions. | 1. Control the sequence and stride of the texture size and sampling coordinates, to improve the cache hit rate. 2. The number of sampling instructions in a shader should be less than 16. |
Vertex debugging view
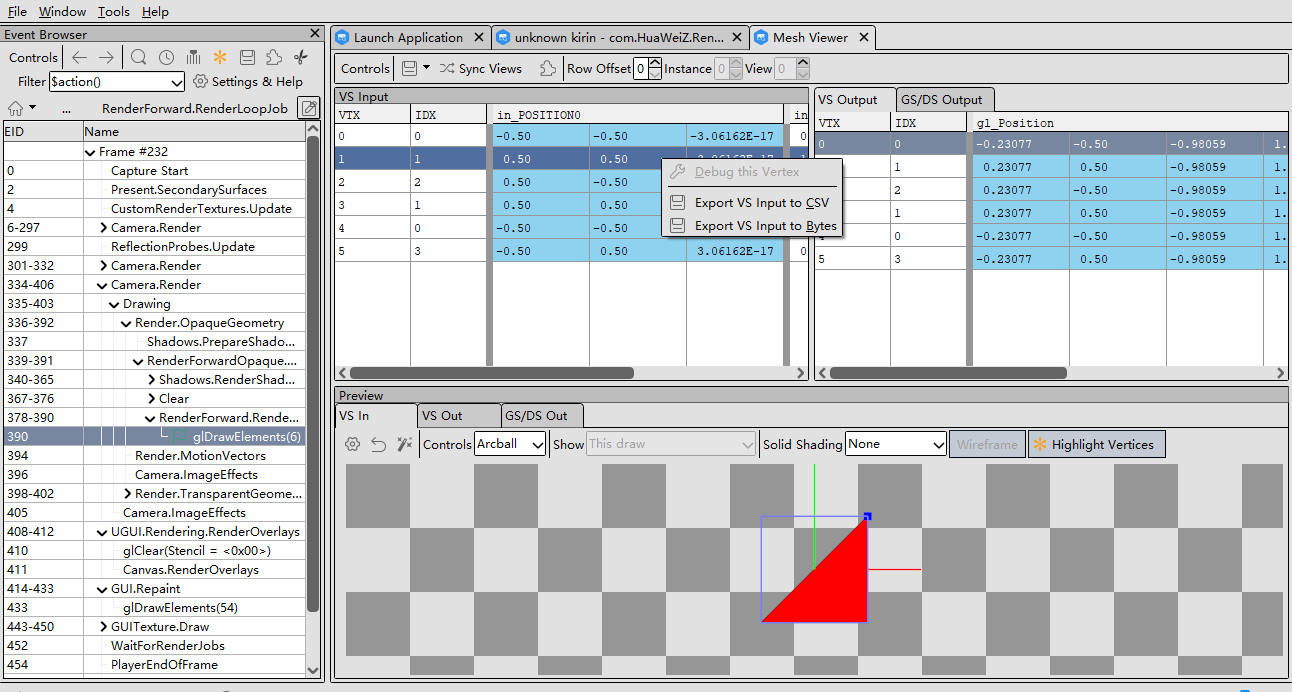
To debug a vertex, you need to invoke the Mesh Viewer and Event Browser windows. In the Event Browser window, click Draw to open the corresponding VS. The information about the drawn vertices is displayed in the Mesh Viewer window.
The Mesh Viewer window is shown in the dark blue area in the preceding figure. When you right-click in the window, options are displayed. If a D3D11 image is used, an additional debugging option is displayed. In the preceding figure, OpenGL ES is used and thus this option is unavailable. After the corresponding vertex information is modified, Preview is also displayed.
VS In indicates the content that is being drawn. VS Out indicates the content that has been drawn. The checkerboard display area can be rotated. You can click and drag the left mouse button to switch the view angle.
If the EID selected in Event Browser contains multiple draws, right-click in the checkerboard display area. The corresponding vertex information is displayed.
Pixel debugging is performed on the Texture Viewer window. Select an .rdc image, and right-click FBO window. The corresponding pixel information is displayed in Pixel Context panel.
If the selected pixel is modified, the History button is available. You can click the button to view the drawing history.
If the current call to be debugged is selected, you can click Debug to skip the pixel history and directly go to the debugger. The pixel input is automatically filled.
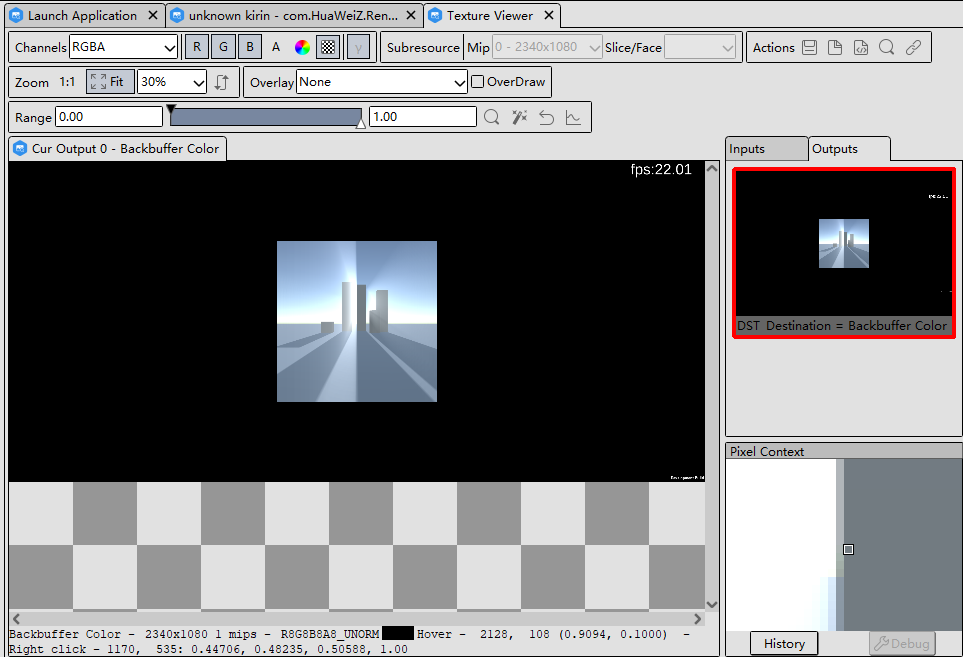
Pay attention to the following points during pixel debugging: