Graphics Profiler contains two command line tools: trace_recorder and trace_processor, which are stored in the cli folder in the Graphics Profiler installation directory. Both tools share the infrastructure with the GUI application. Therefore, you can use the Graphics Profiler settings page to configure the preferred trace directory and ADB parameters, and make sure that the command line tools also use them.
Because the infrastructure is shared, the current command line tool cannot be used when another tool or the GUI has been started.
Trace Recorder
The trace_recorder tool can capture a trace using the provided trace configuration. The easiest way to obtain a configuration file is to copy it from the GUI. After configuring recording, click Recording config and then click Copy to clipboard to copy the configuration file.
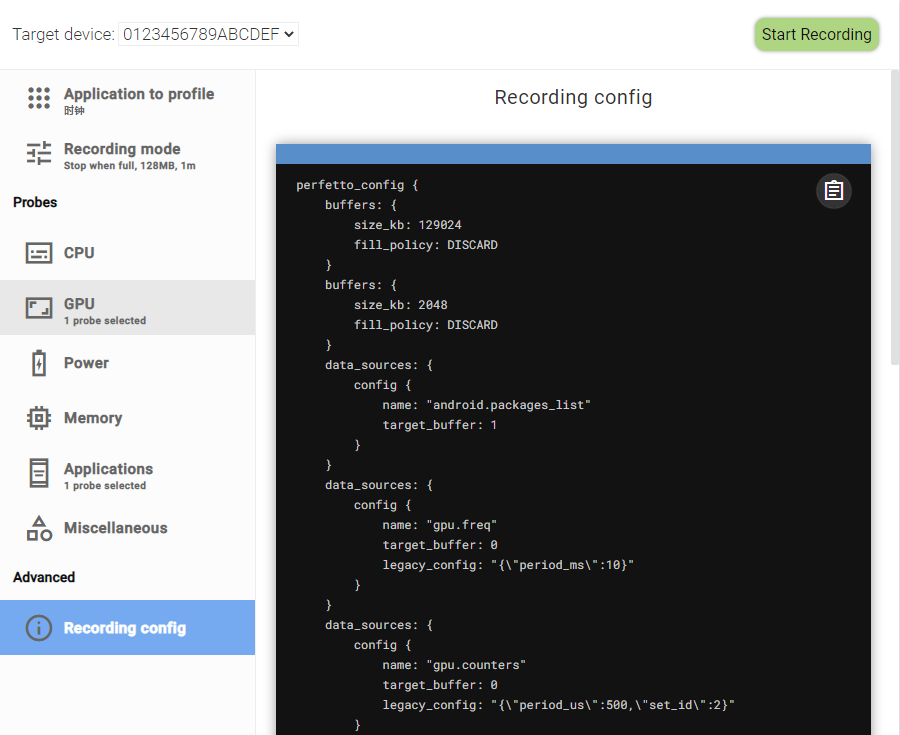
After creating a configuration file, Trace Recorder can be called using trace_recorder record <path to trace config> -d <device UID>. If the device UID is omitted, the first device available in the list will be used. You can view the device UID on the GUI or by executing the trace_recorder devices command. You can wait for the end of a tracing session or stop it while recording is in progress by pressing Ctrl+C. In Ring Buffer mode, the tracing session does not automatically stop and must be manually stopped. Therefore, you need to press Ctrl+C to end the recording.
The query command is as follows:
trace_processor query -f <path to SQL file> -o <output JSON path> <path to the trace file>
Alternatively, you can export a trace as a SQLite database using the following command:
trace_processor export <path to the trace file> <output database file>
The generated database can be used with the sqlite3 Python package.
Error Handling
You can handle CLI exit codes in your scripts. The CLI tools of Graphics Profiler may return the following codes:
Code | Description |
|---|---|
0 | Everything is done as expected. |
1 | Program internal error. |
2 | Failed to obtain the device list. |
3 | No device is available for recording. |
4 | The selected device cannot be used for recording. |
5 | The trace configuration file cannot be found or opened. |
6 | Failed to record a trace. |
7 | Failed to execute SQL query. |
8 | Failed to export a trace. |