Viewing Counters on the GUI
- Open an .rdc file with the tool.
- Choose from the main menu.
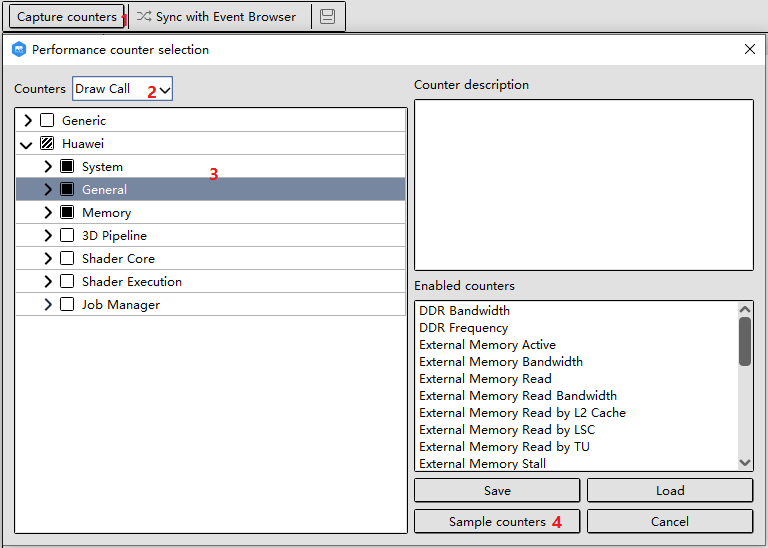
- Click Capture counters in the Performance Counter Viewer window. Select the target options and click Sample counters.
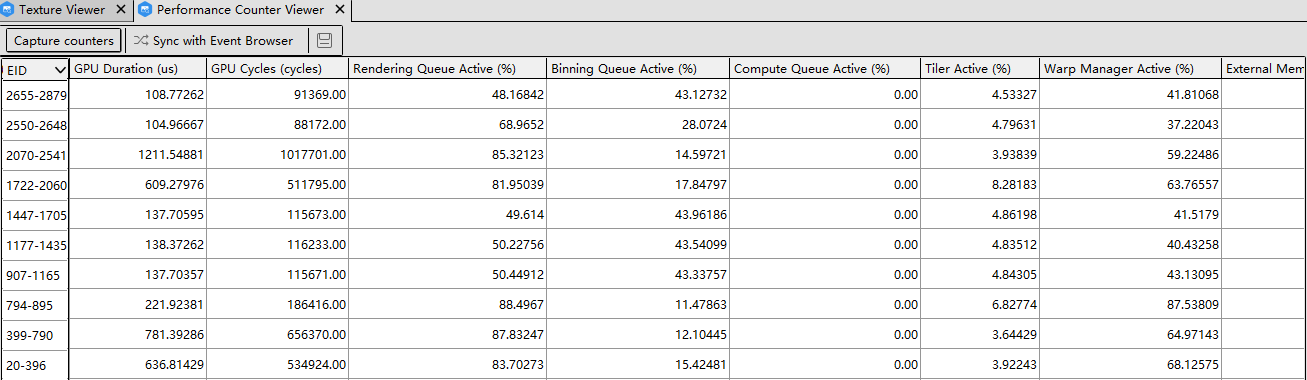
- The selected options are displayed in a table, and the Performance Counter window is added.

- Open the Performance Counter window and view the data of selected options displayed graphically.
Viewing Performance Counter
- Move the cursor to the EID on the Performance Counter window. The waiting window is displayed initially. After several seconds, the thumbnail corresponding to the EID is displayed, which is the same as the output texture in the Texture Viewer window. Labels are displayed for all data rows below the cursor. Each of the labels contains the data name of the row where the cursor is located and the counter data in the EID column where the cursor is located. The data is consistent with that in the Performance Counter Viewer window.
- When the cursor moves horizontally in a data row, the label is displayed at the cursor position. The label displays the data name in the row where the cursor is located and the counter data in the EID column where the cursor is located.
- Right-click any position in the window and choose Hide/Show Average from the shortcut menu. The average values of counters can be displayed or hidden in the right pane.

Viewing Counters Grouped by Program
The counters can be grouped and displayed by program.
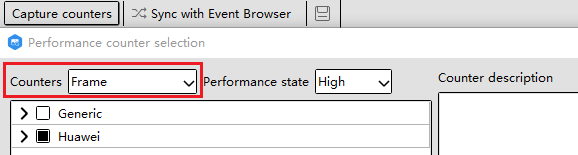
- Capture counters by program.
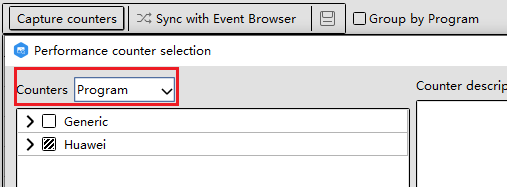
- Click Sample counters.
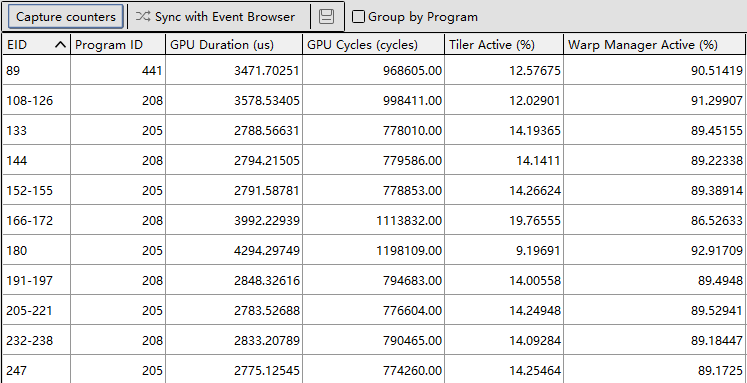
- Select Group by Program.
Approximate Value of the Top Shader
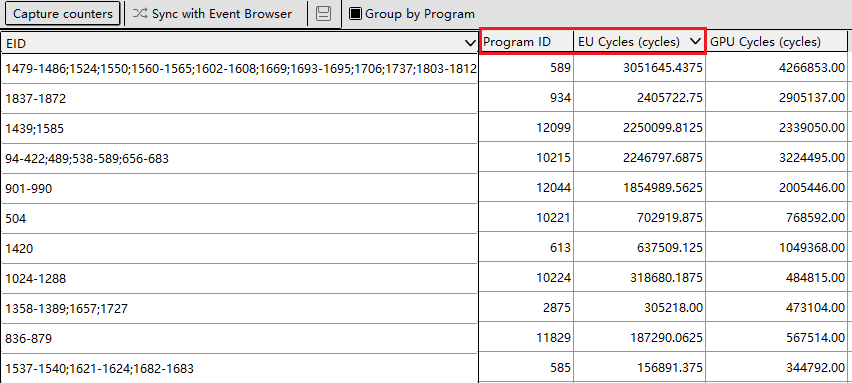
Classify Vulkan pipelines or OpenGL ES programs by EU Active.
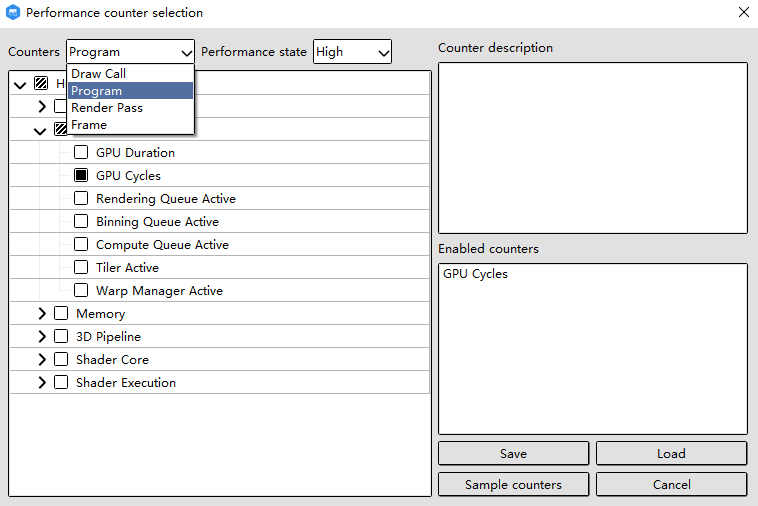
- Open any Vulkan or OpenGL ES .rdc file and capture counters in Program mode.
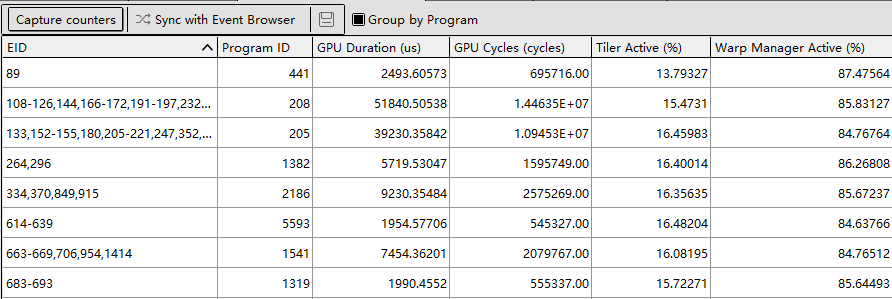
- After the counter capture is complete, select Group by Program. This option allows aggregating counters of draws of the same pipeline or program in multiple non-consecutive ranges.
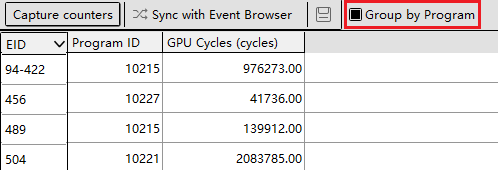
The generated table contains all used pipelines or programs which are sorted by EU Cycles.