Function Overview
During app development, the product manager and technical team can cooperate with each other through app debugging to verify data reporting, preventing event missing and event attribute setting errors. The app debugging function can display the data reported by apps in real time and verify SDK integration, enhancing the accuracy of collected data.
Typical Application Scenarios
- Verify SDK integration and data reporting.
- View event and attribute reporting in real time to detect and handle exceptions in time.
[h2]Case
After the Analytics SDK is integrated into an app, you can use this function to verify SDK integration and event reporting.
[h2]Procedure
- Enable the debug mode on the device and ensure that you have a stable Internet connection. Open the app to be verified.
- For Android apps, please refer to Setting the Debug Mode.
- For HarmonyOS (Java) apps, please refer to Setting the Debug Mode.
- For HarmonyOS (JavaScript) apps, please refer to Setting the Debug Mode.
- For iOS apps, please refer to Setting the Debug Mode.
- For macOS apps, please refer to Setting the Debug Mode.
- For web apps, please refer to Setting the Debug Mode.
- For quick apps, please refer to Setting the Debug Mode.
- For quick games, please refer to Setting the Debug Mode.
- For WeChat mini-programs, please refer to Setting the Debug Mode.
- Sign in to AppGallery Connect and click My projects.
- Find your project, and click the app for which you want to view analysis data.
- Go to .
- View the app debugging report. For details, please refer to Viewing the App Debugging Report.
[h2]Viewing the App Debugging Report
- Go to the app debugging report page.
This page displays events reported in the last 60 seconds and those reported in the last 30 minutes. Select an app to be debugged and select a device for testing. You can manage all test devices, including deleting the devices.

Before using the DebugView, ensure that the device time is correct. If the device time is incorrect, events may be delayed or missing in the analysis report.
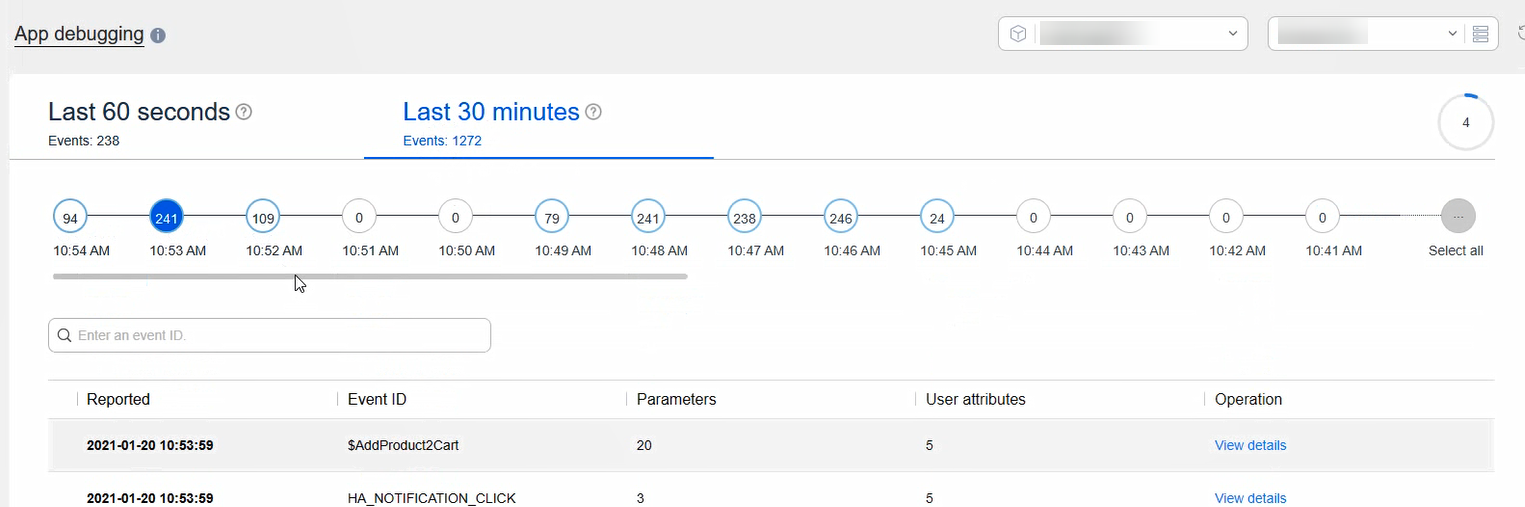
- View debugging event details, which are updated in real time.
By default, the Last 60 seconds page displays the received debugging data in reverse chronological order. You can view the time when an event was reported, event ID, as well as the numbers of parameters and user attributes contained in an event.

Click Update data in real time to enable or disable data update. Data is updated every 5 seconds if this function is enabled.
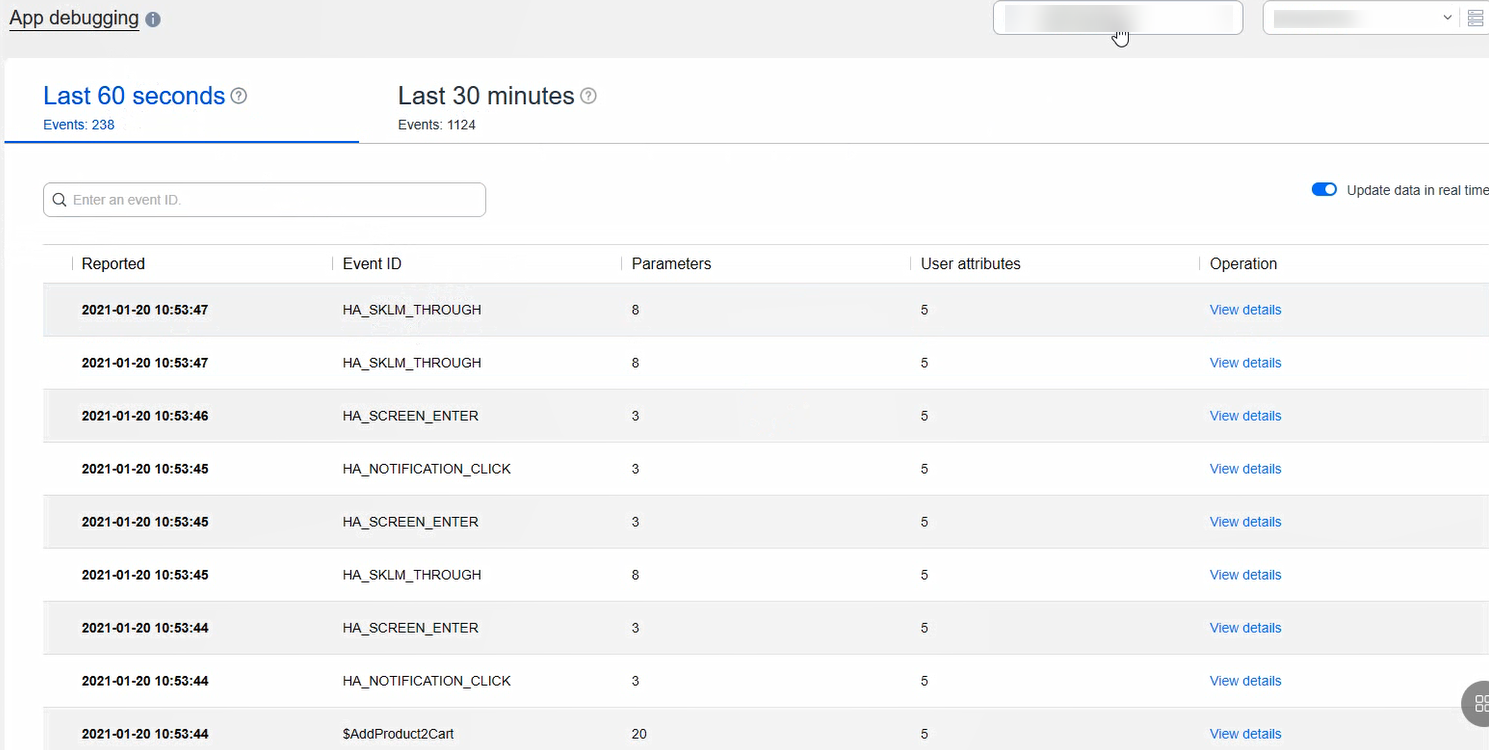
- View debugging event details in the last 30 minutes.
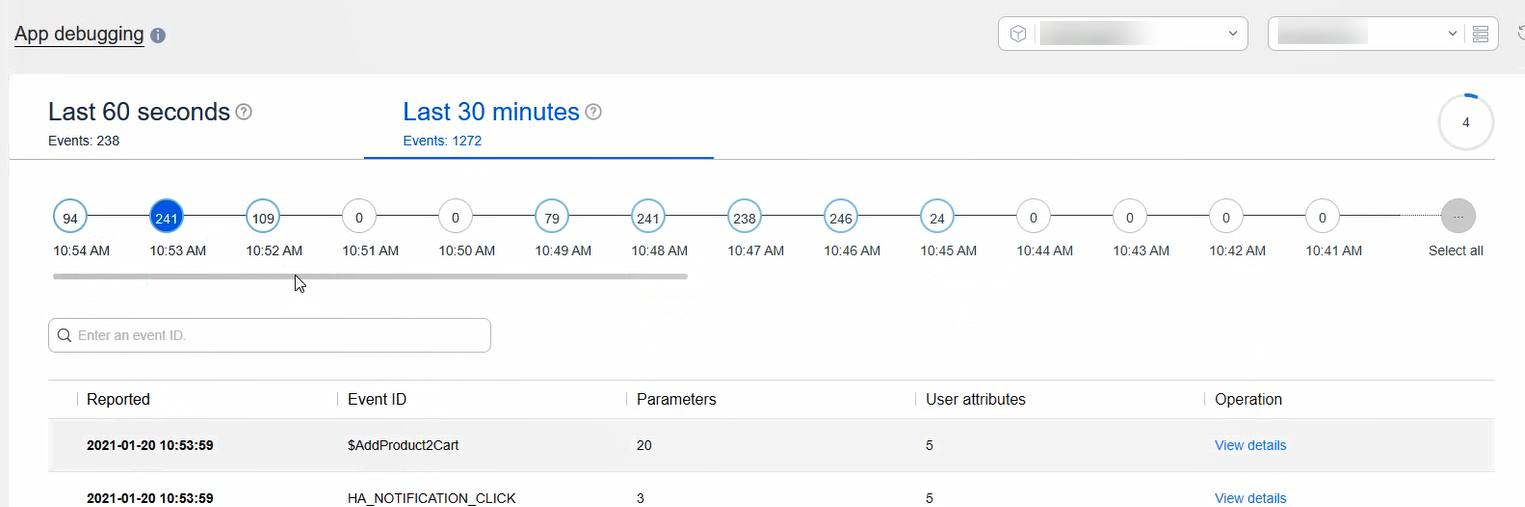
This page displays a time axis of the last 30 minutes, with each point indicating one minute. The number in the circle indicates the number of debugging events received in this minute. When you click a number, the data displayed in the table below is updated synchronously. You can click View details to view the details of an event.
- View popular events in the last 30 minutes.
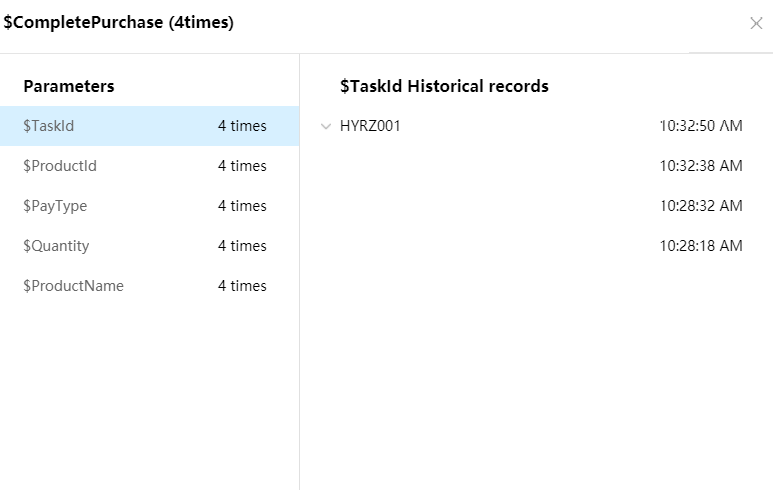
This card displays the IDs of events reported in the last 30 minutes in descending order by the number of event occurrences. If you click an event, the number of times a parameter is reported, parameter values, and the update time sequence of each parameter value are displayed.
- View user attributes.
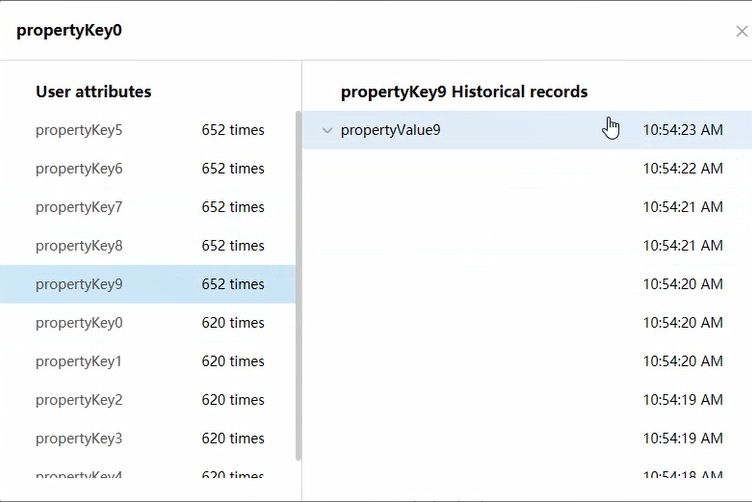
This card displays user attributes reported in the last 30 minutes in descending order by the number of reporting times. You can click a user attribute to view its reporting times, values, and update time sequence.