The HMS Core Map SDK allows you to add different shapes on a map, including polylines, polygons, circles, and Bezier curves.
[h2]Adding a Polyline
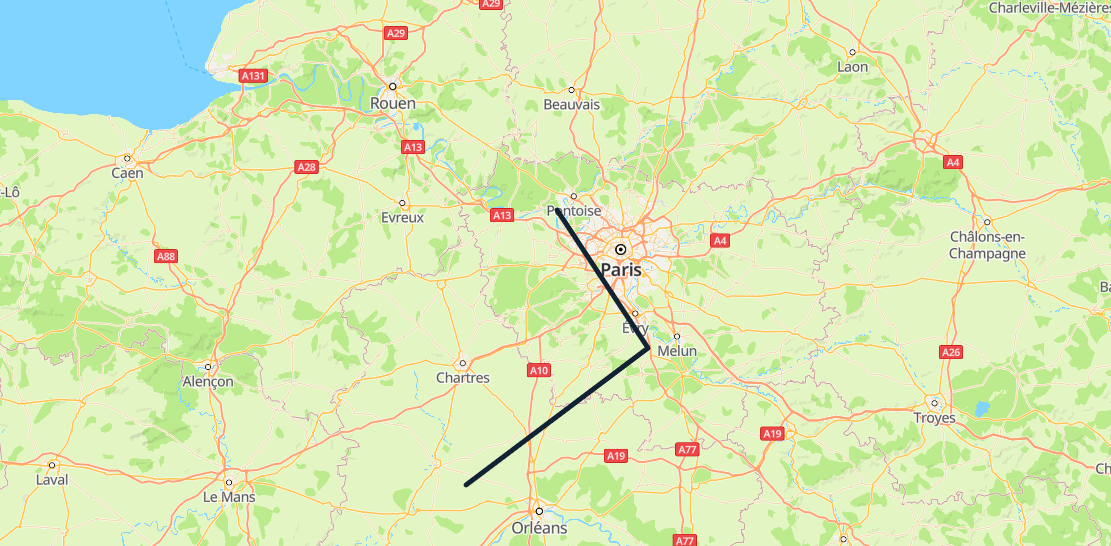
Call the HWMapJsSDK.HWPolyline(polylineOptions) method to add a polyline on the map.
var map;
var polyline;
function initMap() {
    var mapOptions = {};
    mapOptions.center = {lat: 48.856613, lng: 2.352222};
    mapOptions.zoom = 8;
    map = new HWMapJsSDK.HWMap(document.getElementById('map'), mapOptions);
    polyline = new HWMapJsSDK.HWPolyline({
        map: map,
        path: [
            {lat: 49, lng: 2},
            {lat: 48.5, lng: 2.5},
            {lat: 48, lng: 1.5}
        ],
        strokeColor: '#112233',
        strokeWeight: 5,
    });
} 
[h2]Removing a Polyline
To remove a polyline from a map, call the setMap() method and pass null as a parameter of the method.
polyline.setMap(null);
Note: The previous method cannot be used to delete a polyline. It simply removes the polyline from the map. To delete a polyline, you need to remove it from the map and set the polyline itself to null.
polyline.setMap(null);
polyline = null;
[h2]Modifying a Polyline
Call methods provided by HWPolyline to modify polyline attributes. For example, call the setStrokeWeight(strokeWeight) method to modify the polyline width. For more methods, please refer to HWPolyline.
<tr>
    <td>Polyline StrokeWeight:</td>
    <td><input id="strokeWeightInput" type="text" value="2"/></td>
</tr>
<script>
    var strokeWeight = Number(document.getElementById("strokeWeightInput").value);
    polyline.setStrokeWeight(strokeWeight);
</script>
The following table describes the polyline attributes that can be customized.
| Attribute | Description |
|---|---|
| setPath(path) | Sets the path. |
| setShowDir(showDir:boolean) | Checks whether the direction arrow is displayed. |
| setStrokeColor(strokeColor) | Sets the stroke color. The color can be set in the following ways:
|
| setStrokeLineDash(strokeLineDash) | Sets the dashed line type of a polyline. |
| setStrokeWeight(strokeWeight) | Sets the stroke width. |
| setVisible(visible) | Sets the visibility. |
| setZIndex(zIndex) | Sets the z-index, that is, the overlay relationship on the Z axis. |
[h2]Listening for Polyline Events
The following table describes polyline events. For details, please refer to HWPolyline Events.
| Event | Description |
|---|---|
| click | Click on a polyline. |
| dbclick | Double-click on a polyline. |
| mousedown | Mouse button press. |
| mouseup | Mouse button release. |
The following sample code is to listen for polyline click events. To set this listener on the map, call the addListener('click', callback) method of the HWPolyline object.
function handleClick() {
    alert("On Polyline click.");
}
polyline.addListener('click', handleClick);
Polygon
A polygon consists of multiple points with longitudes and latitudes. Different from a polyline, a polygon is a closed area used to define what is inside it.
[h2]Adding a Polygon
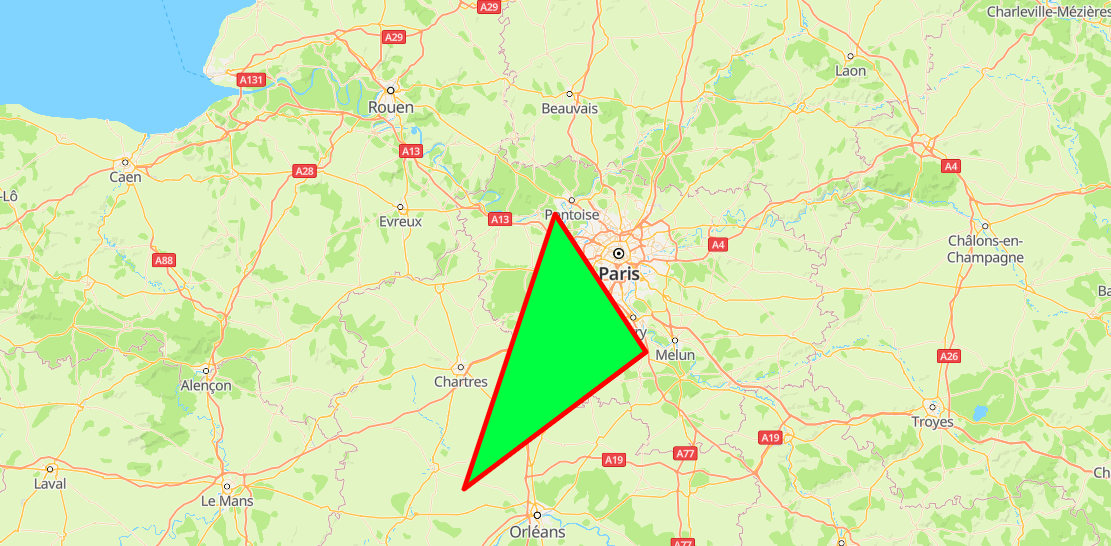
Call the HWMapJsSDK.HWPolygon(polygonoptions) method to create a polygon on the map.
var map;
var polygon;
function initMap() {
    var mapOptions = {};
    mapOptions.center = {lat: 48.856613, lng: 2.352222};
    mapOptions.zoom = 8;
    map = new HWMapJsSDK.HWMap(document.getElementById('map'), mapOptions);
    polygon = new HWMapJsSDK.HWPolygon({
        map : map,
        paths: [
            [
                {lat: 49, lng: 2},
                {lat: 48.5, lng: 2.5},
                {lat: 48, lng: 1.5}
            ],
        ],
        fillColor: '#00ff41',
        strokeColor: '#ff0000',
        strokeWeight: 5,
    });
} 
[h2]Removing a Polygon
To remove a polygon from a map, call the setMap() method and pass null as a parameter of the method.
polygon.setMap(null);
Note: The previous method cannot be used to delete a polygon. It simply removes the polygon from the map. To delete a polygon, you need to remove it from the map and set the polygon itself to null.
polygon.setMap(null);
polygon = null;
[h2]Modifying a Polygon
Call methods provided by HWPolygon to modify polygon attributes. For example, call the setFillColor(fillColor) method to modify the fill color of the polygon.
<tr>
    <td>Polygon FillColor:</td>
    <td><input id="fillColorInput" type="text" value="#999999"/></td>
</tr>
<script>
    var fillColor = document.getElementById("fillColorInput").value;
    polygon.setFillColor(fillColor);
</script>
The following table describes the polygon attributes that can be customized.
| Attribute | Description |
|---|---|
| setFillColor(fillColor) | Sets the fill color of a polygon. |
| setStrokeColor(strokeColor) | Sets the stroke color. |
| setStrokeWeight(strokeWeight) | Sets the stroke width. |
| setVisible(visible) | Sets the visibility. |
[h2]Listening for Polygon Events
The following table describes polygon events. For details, please refer to HWPolygon Events.
| Event | Description |
|---|---|
| click | Click on a polygon. |
| dbclick | Double-click on a polygon. |
| mousedown | Mouse button press. |
| mouseup | Mouse button release. |
The following sample code is to listen for polygon click events. To set this listener on the map, call the addListener('click', callback) method of the HWPolygon object.
function handleClick() {
    alert("On Polygon click.");
}
polygon.addListener('click', handleClick);
Circle
There are two types of circles: solid circle and hollow circle. By default, a circle is hollow. You can control the circle type using circle attributes.
[h2]Adding a Circle
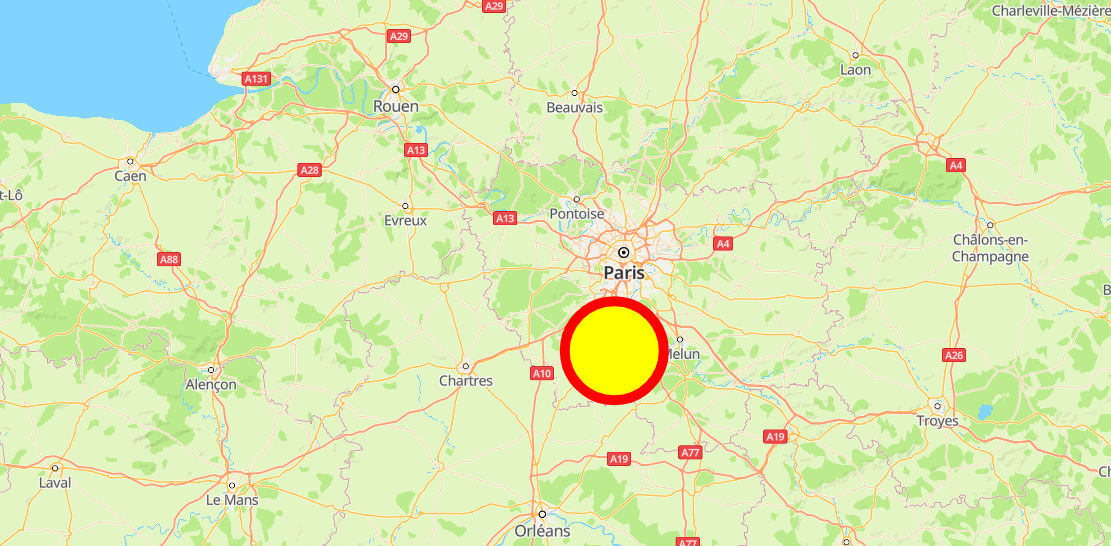
Call the HWMapJsSDK.HWCircle(circleOptions) method to create a circle on the map.
var map;
var circle;
function initMap() {
    var mapOptions = {};
    mapOptions.center = {lat: 48.856613, lng: 2.352222};
    mapOptions.zoom = 8;
    map = new HWMapJsSDK.HWMap(document.getElementById('map'), mapOptions);
    circle = new HWMapJsSDK.HWCircle({
        map: map,
        center: {lat: 48.5, lng: 2.3},
        radius: 20000,
        fillColor: 'yellow',
        strokeColor:'red',
        strokeWeight: 10,
    });
} 
[h2]Removing a Circle
To remove a circle from a map, call the setMap() method and pass null as a parameter of the method.
circle.setMap(null);
Note: The previous method cannot be used to delete a circle. It simply removes the circle from the map. To delete a circle, you need to remove it from the map and set the circle itself to null.
circle.setMap(null);
circle = null;
[h2]Modifying a Circle
Call methods provided by HWCircle to modify circle attributes. For example, call the setCenter(center) method to modify the circle center.
<tr>
    <td>Center Lat:</td>
    <td><input id="centerLatInput" type="text" value="48.6"/></td>
</tr>
<tr>
    <td>Center Lng:</td>
    <td><input id="centerLngInput" type="text" value="2.4"/></td>
</tr>
<script>
    var lat = Number(document.getElementById("centerLatInput").value);
    var lng = Number(document.getElementById("centerLngInput").value);
    circle.setCenter({lat: lat, lng: lng});
</script>
The following table describes the circle attributes that can be customized.
| Attribute | Description |
|---|---|
| setCenter(center) | Sets the center of a circle. |
| setRadius(radius) | Sets the radius of a circle. |
| setFillColor(fillColor) | Sets the fill color of a circle. |
| setStrokeColor(strokeColor) | Sets the stroke color of a circle's outline. |
| setStrokeWeight(strokeWeight) | Sets the stroke width of a circle's outline. |
| setVisible(visible) | Sets whether a circle is visible. |
[h2]Listening for Circle Events
The following table describes circle events. For details, please refer to HWCircle Events.
| Event | Description |
|---|---|
| click | Click on a circle. |
| dbclick | Double-click on a circle. |
| mousedown | Mouse button press. |
| mouseup | Mouse button release. |
The following sample code is to listen for circle click events. To set this listener on the map, call the addListener('click', callback) method of the HWCircle object.
function handleClick() {
    alert("On Circle click.");
}
circle.addListener('click', handleClick);
Bezier Curve
A Bezier curve is a smooth curve drawn based on the coordinates of three or four arbitrary points.
[h2]Adding a Bezier Curve
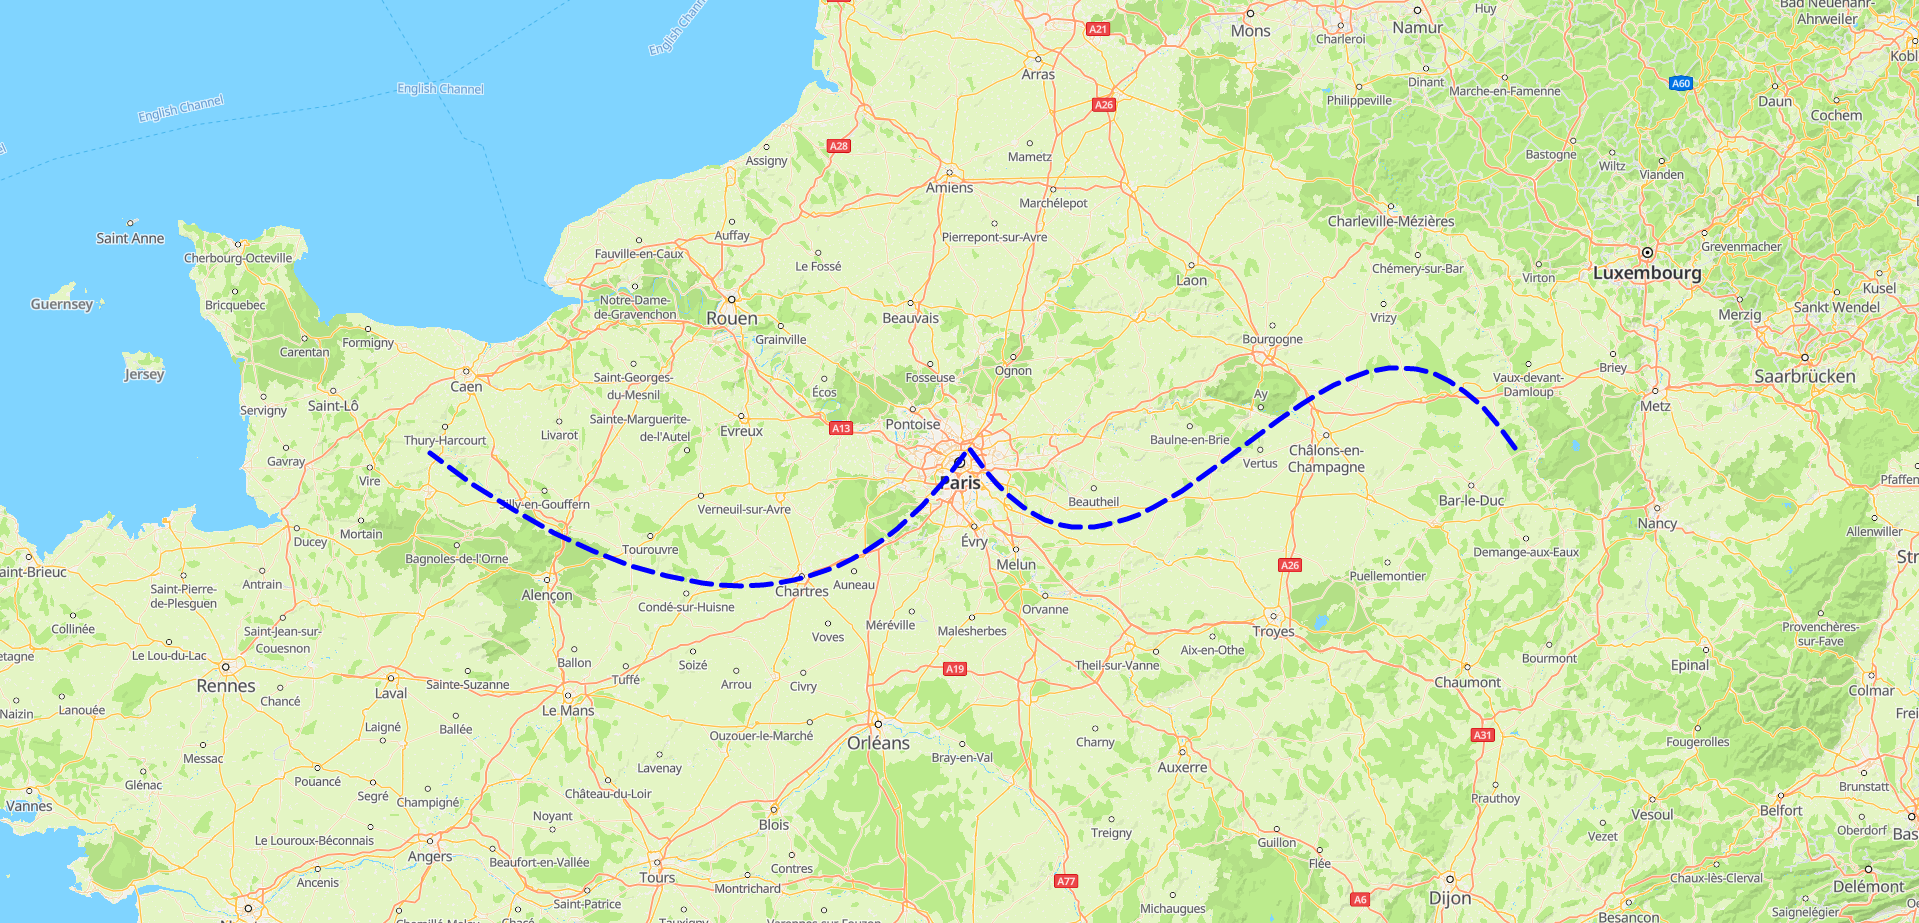
Call the HWMapJsSDK.HWBezierCurve(BezierCurveOptions) method to add a Bezier curve on the map.
var map;
var bezierCurve;
function initMap() {
    var mapOptions = {};
    mapOptions.center = {lat: 48.856613, lng: 2.352222};
    mapOptions.zoom = 8;
    map = new HWMapJsSDK.HWMap(document.getElementById('map'), mapOptions);
    const paths = [
    [
        { lng: 5.399, lat: 48.910} // Start point.
    ],
    [
        { lng: 4.399, lat: 49.910}, // Control point 1.
        { lng: 3.399, lat: 47.910}, // Control point 2.
        { lng: 2.399, lat: 48.910} // Waypoint 1.
    ],
    [
        { lng: 1.399, lat: 47.910}, // Control point 1.
        { lng: -0.601, lat: 48.910} // Waypoint 2.
    ],
];
bezierCurve = new HWMapJsSDK.HWBezierCurve({
        map: map,
        paths,
        strokeColor: 'blue',
        strokeWeight: 5,
        strokeLineDash: [20, 10]
    })
} 
[h2]Removing a Bezier Curve
To remove a Bezier curve from a map, call the setMap() method and pass null as a parameter of the method.
bezierCurve.setMap(null);
Note: The previous method cannot be used to delete a Bezier curve. It simply removes the Bezier curve from the map. To delete a Bezier curve, you need to remove it from the map and set the Bezier curve itself to null.
bezierCurve.setMap(null);
bezierCurve = null;
[h2]Modifying a Bezier Curve
Call methods provided by HWBezierCurve to modify Bezier curve attributes. For example, call the setStrokeWeight(strokeWeight) method to modify the Bezier curve width. For more methods, please refer to HWBezierCurve.
<tr>
    <td>BezierCurve StrokeWeight:</td>
    <td><input id="strokeWeightInput" type="text" value="2"/></td>
</tr>
<script>
    var strokeWeight = Number(document.getElementById("strokeWeightInput").value);
    bezierCurve.setStrokeWeight(strokeWeight);
</script>
The following table describes the Bezier curve attributes that can be customized.
| Attribute | Description |
|---|---|
| setStrokeColor(strokeColor) | Sets the stroke color. The color can be set in the following ways:
|
| setStrokeLineDash(strokeLineDash) | Sets the dotted line type of a Bezier curve. |
| setStrokeWeight(strokeWeight) | Sets the stroke width. |
| setVisible(visible) | Sets the visibility. |
| setZIndex(zIndex) | Sets the z-index, that is, the overlay relationship on the Z axis. |
[h2]Listening for Bezier Curve Events
The following table describes Bezier curve events supported by HWBezierCurve. For details, please refer to HWBezierCurve Events.
| Event | Description |
|---|---|
| click | Click on a Bezier curve. |
| dbclick | Double-click on a Bezier curve. |
| mousedown | Mouse button press. |
| mouseup | Mouse button release. |
The following sample code is to listen for Bezier curve events. To set this listener on the map, call the addListener('click', callback) method of the HWBezierCurve object.
function handleClick() {
    alert("On BezierCurve click.");
}
bezierCurve.addListener('click', handleClick);