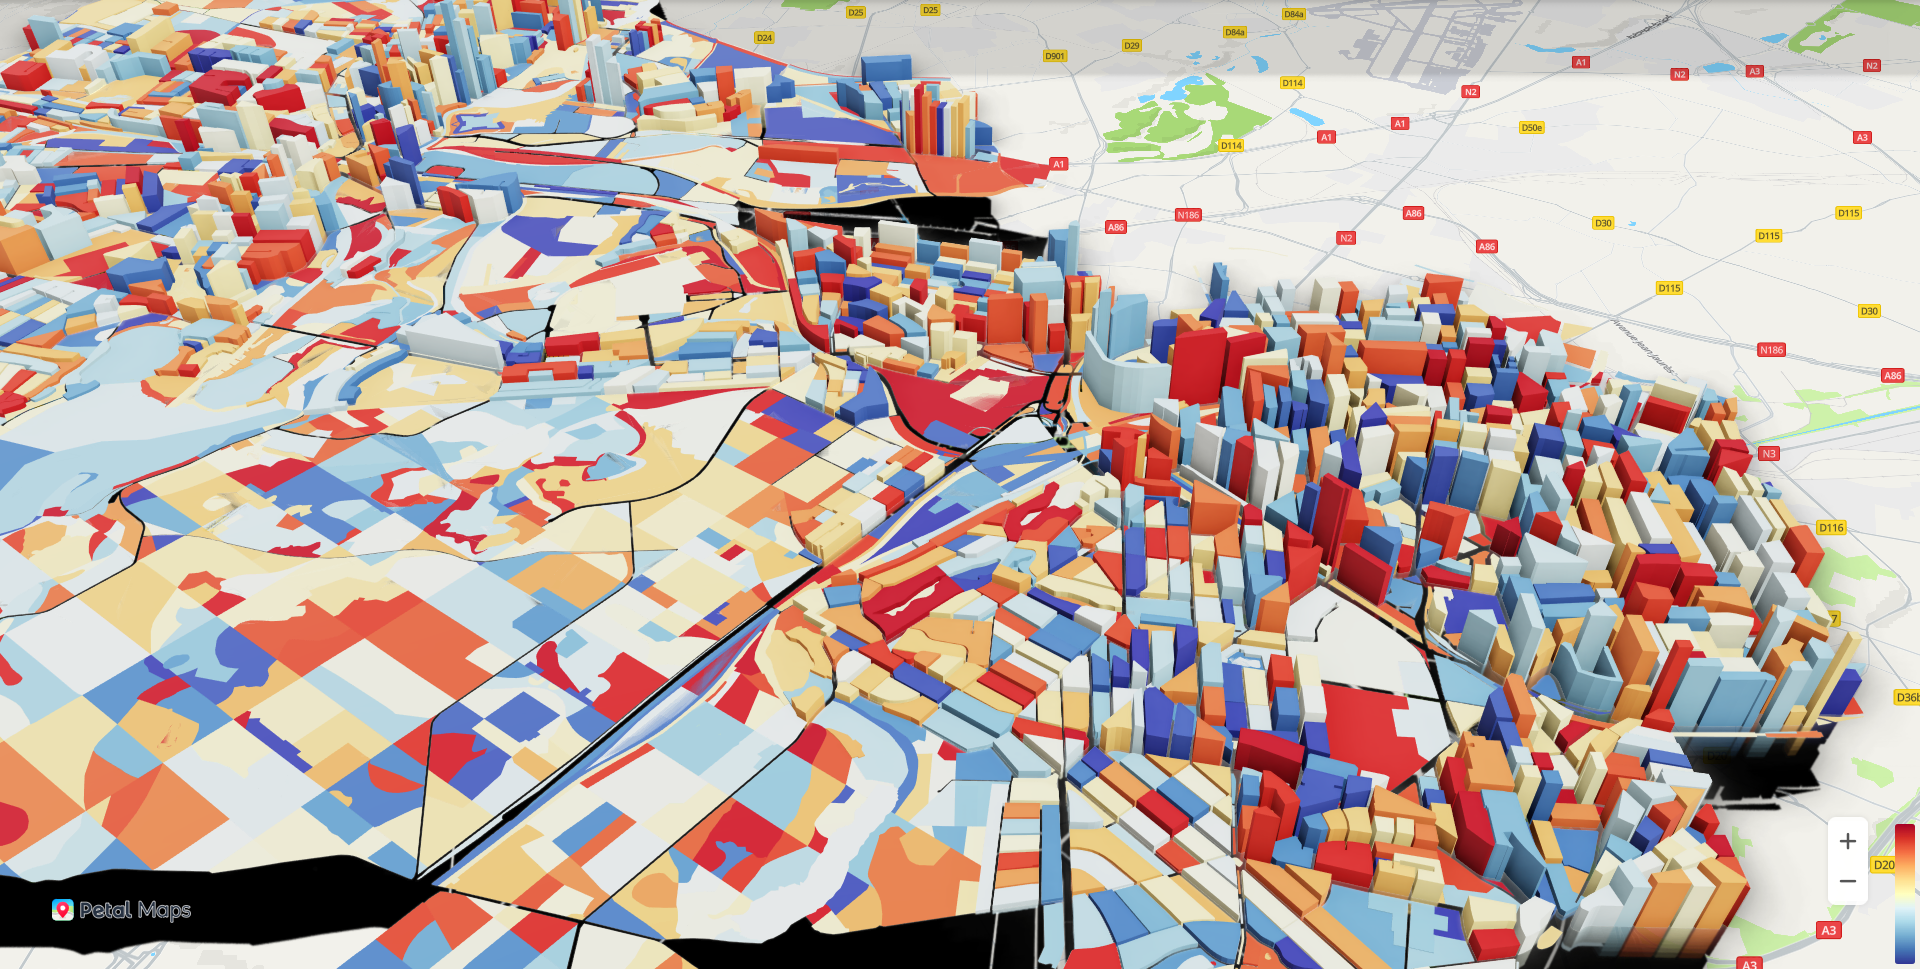
Map Kit provides the data visualization plugin echarts-extension-hwmap.min.js. It can work with ECharts to display a large amount of 2D/3D geographical point, line, and plane data, achieving cool rendering effects such as the scatter chart, heatmap, and 3D bar chart.
Procedure
- Add the Map Kit API file and relevant plugin. For ECharts plugin versions, the echarts.js version must be later than 5 and the echarts-gl.js version must match the echarts.js version.
<script src="https://mapapi.cloud.huawei.com/mapjs/v1/api/js?callback=initMap&key=API KEY"></script>
<script src="https://polyfill.io/v3/polyfill.min.js?features=default"></script>
<script type="text/javascript" src="assets/js/echarts.js"></script>
<script type="text/javascript" src="assets/js/echarts-gl.js"></script>
<script src="https://mapapi.cloud.huawei.com/mapjs/v1/api/js/echarts-extension-hwmap.min.js"></script>
- Add the data source.
- Set attributes, such as series and hwmap/hwmap3D (longitude-latitude system). The hwmap3D attribute does not support setting of sourceType. By default, the source type is a vector graph, and overlays are not supported.
- For details about basic attributes of hwmap and hwmap3D, please refer to MapOptions. New attributes for hwmap and hwmap3D are as follows:
- hwmap
- renderOnMoving: indicates whether to enable real-time rendering. The default value is true (yes).
- roam: indicates whether to allow gestures. The default value is true (yes).
- hwmap3D
- pitch: tilt angle, in degrees. The maximum value is 60.
- boxHeight: height of a bar chart or scatter chart.
- hwmap
- For details about the series attribute, please refer to the ECharts official website. The coordinateSystem attribute should be set to hwmap or hwmap3D.
- For details about basic attributes of hwmap and hwmap3D, please refer to MapOptions. New attributes for hwmap and hwmap3D are as follows:
- Call chart.setOption and pass the set attributes to render the map and ECharts.

The hwmap3D attribute does not support setting of sourceType. By default, the source type is a vector graph, and overlays are not supported.
2D scatters are incompatible with Internet Explorer earlier than version 10. Heatmaps in ECharts are incompatible with Internet Explorer 10 or earlier. 3D and GL maps are incompatible with Internet Explorer.
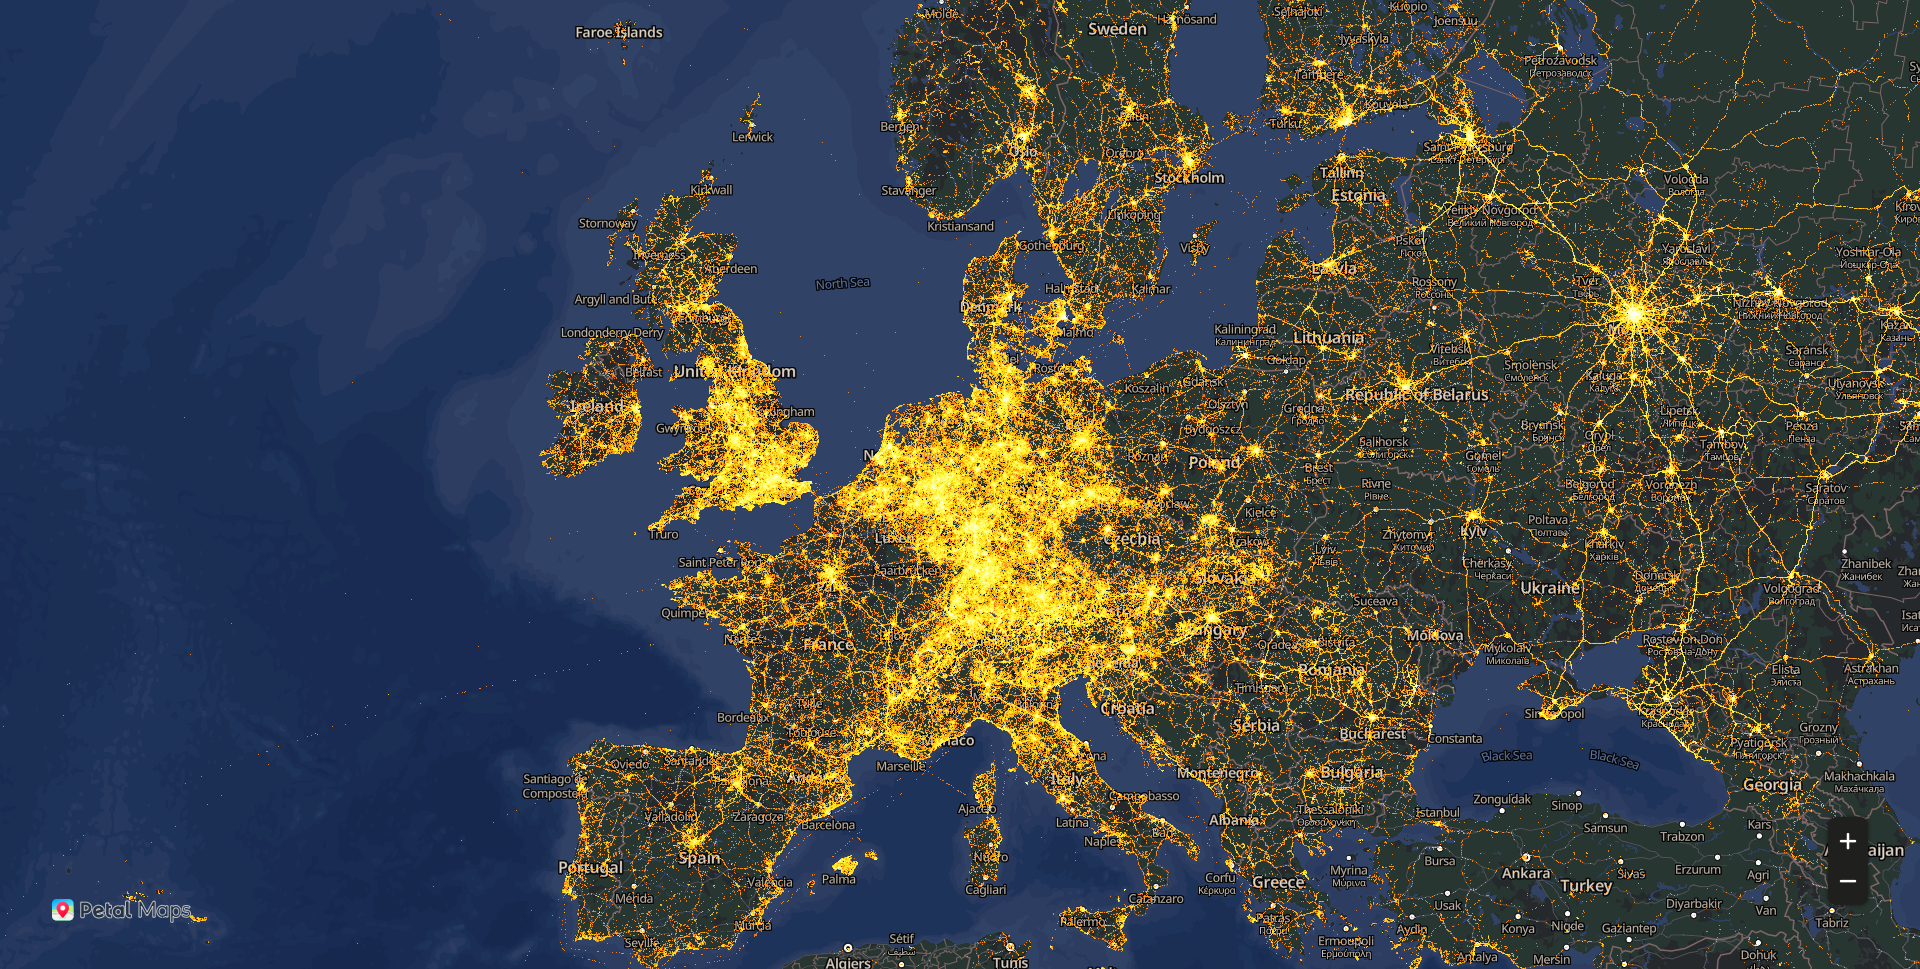
[h2]ScatterGL
The sample code is as follows:
JavaScript
window.initMap = function() {
  $.getJSON('assets/json/scatterGL.json', function (data) {
    var chart = echarts.init(document.getElementById("echarts-map"));
    var option = {
      hwmap: {
        language: 'en',
        center: [ 2.352222, 48.856613],
        zoom: 15,
        presetStyleId: 'night',
        renderOnMoving: false,
        style:[]
      },
      series: [
        {
          type: 'scatterGL',
          progressive: 1e6,
          coordinateSystem: 'hwmap',
          symbolSize: 1,
          zoomScale: 0.002,
          blendMode: 'lighter',
          large: true,
          itemStyle: {
            color: '#f12201'
          },
          postEffect: {
            enable: true
          },
          sampling: 'average',
          silent: true,
          dimensions: ['lng', 'lat'],
          data: data,
          animation:false
        }
      ]
    };
    option && chart.setOption(option);
  })
}
HTML
<!DOCTYPE html>
<html lang="en">
<head>
  <base href="../../">
  <meta charset="utf-8">
  <meta name="renderer" content="webkit">
  <meta http-equiv="cleartype" content="on">
  <meta http-equiv="x-dns-prefetch-control" content="on">
  <meta http-equiv="X-UA-Compatible" content="IE=edge,chrome=1">
  <title>an example for echarts-extension-hwmap</title>
  <link rel="icon" href="data:;base64,=">
  <script src="https://mapapi.cloud.huawei.com/mapjs/v1/api/js?callback=initMap&key=API KEY"></script>
  <script src="https://polyfill.io/v3/polyfill.min.js?features=default"></script>
  <script type="text/javascript" src="echarts.js"></script>
  <script type="text/javascript" src="echarts-gl.js"></script>
  <script src="https://mapapi.cloud.huawei.com/mapjs/v1/api/js/echarts-extension-hwmap.min.js"></script>
  <script type="text/javascript" src="jquery.min.js"></script>
  <link rel="stylesheet" href="index.css">
</head>
<body>
  <div id="echarts-map"></div>
  <script src="index.js" type="text/javascript"></script>
</body>
</html>
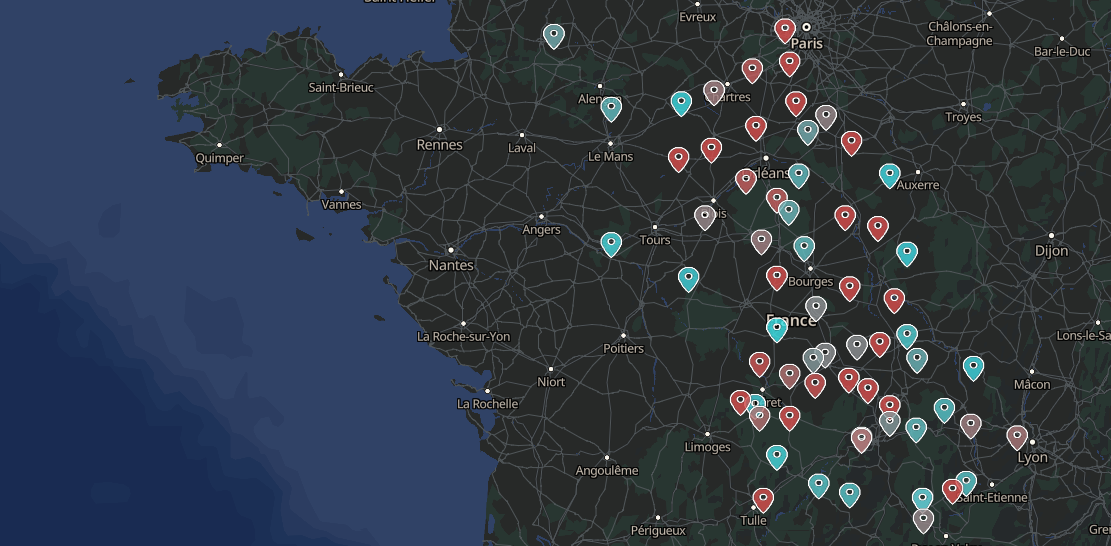
[h2]Scatter3D
The sample code is as follows:
JavaScript
const chart = echarts.init(document.getElementById('echarts-map'));
window.initMap = function() {
  $.getJSON('assets/json/scatter3D.json', (data) => {
    chart.setOption({
      visualMap: [{
        show: false,
        seriesIndex: 0,
        text: ['scatter3D'],
        left: 'right',
        calculable: true,
        max: 35,
        inRange: {
          color: ['#6694aa', '#38e5eb', '#d94d4c'],
        },
      }],

      hwmap3D: {
        language:'en',
        presetStyleId: 'night',
        center: {lng: 0.95, lat: 47.156613},
        zoom: 6,
        boxHeight: 0,
      },
      series: [{
        name: 'scatter3D',
        type: 'scatter3D',
        coordinateSystem: 'hwmap3D',
        symbol: 'path://M512 490.666667C453.12 490.666667 405.333333 442.88 405.333333 384 405.333333 325.12 453.12 277.333333 512 277.333333 570.88 277.333333 618.666667 325.12 618.666667 384 618.666667 442.88 570.88 490.666667 512 490.666667M512 85.333333C346.88 85.333333 213.333333 218.88 213.333333 384 213.333333 608 512 938.666667 512 938.666667 512 938.666667 810.666667 608 810.666667 384 810.666667 218.88 677.12 85.333333 512 85.333333Z',
        symbolSize: [20, 25],
        opacity: 1,
        label: {
          show: false,
          formatter: '{b}',
        },
        itemStyle: {
          borderWidth: 0.5,
          borderColor: '#fff',
        },
        data,
      }],
    });
    window.onresize = chart.resize;
  });
};
HTML
<!doctype html>
<html>
<head>
  <base href="../../">
  <meta charset="utf-8">
  <title>Map3D - ECHARTS-GL</title>
  <link rel="icon" href="data:;base64,=">
  <meta name="viewport" content="width=device-width, initial-scale=1, user-scalable=no">
  <meta name="apple-mobile-web-app-capable" content="yes">
  <script src="https://mapapi.cloud.huawei.com/mapjs/v1/api/js?callback=initMap&key=API KEY"></script>
  <script src="https://polyfill.io/v3/polyfill.min.js?features=default"></script>
  <script type="text/javascript" src="echarts.min.js"></script>
  <script type="text/javascript" src="echarts-gl.js"></script>
  <script src="https://mapapi.cloud.huawei.com/mapjs/v1/api/js/echarts-extension-hwmap.min.js"></script>
  <script type="text/javascript" src="jquery.min.js"></script>
  <link rel="stylesheet" href="index.css">
</head>
<body>
  <div id="echarts-map"></div>
  <script src="index.js" type="text/javascript"> </script>
</body>
</html>
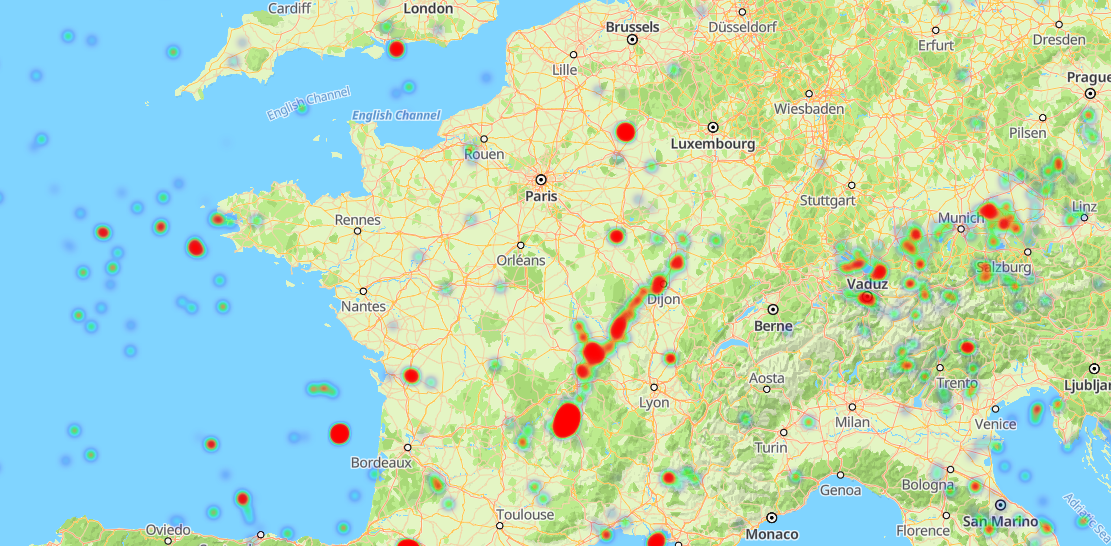
[h2]Heatmap
The sample code is as follows:
JavaScript
var chart = echarts.init(document.getElementById('echarts-map'));
window.initMap=function(){
  $.getJSON('assets/json/heatmap.json', function (data) {
    var option = {
      hwmap: {
        center: [9.888685440170336, 49.799172724734234],
        zoom: 4,
        // presetStyleId: 'night',
        language: 'en',
        renderOnMoving: true,
        echartsLayerInteractive: true,
        largeMode: false
      },
      visualMap: {
        show: true,
        right: 20,
        min: 0,
        max:1,
        seriesIndex: 0,
        calculable: true,
        inRange: {
          color: ['#7e06eb','#0a06eb',  '#06d6eb', '#00ff2b','#eb7a06','#eb0606', 'red']
        }
      },
      animation: false,
      series: [
        {
          type: 'heatmap',
          coordinateSystem: 'hwmap',
          data: data,
          pointSize: 5,
          blurSize: 6
        }
      ]
    };
    chart.setOption(option);
  });
}
HTML
<!DOCTYPE html>
<html lang="en">
<head>
  <base href="../../">
  <meta charset="utf-8">
  <meta name="renderer" content="webkit">
  <meta http-equiv="X-UA-Compatible" content="IE=edge,chrome=1">
  <title>an example for echarts-extension-hwmap</title>
  <link rel="icon" href="data:;base64,=">
  <script src="https://mapapi.cloud.huawei.com/mapjs/v1/api/js?callback=initMap&key=API KEY"></script>
  <script src="https://polyfill.io/v3/polyfill.min.js?features=default"></script>
  <script type="text/javascript" src="echarts.min.js"></script>
  <script src="https://mapapi.cloud.huawei.com/mapjs/v1/api/js/echarts-extension-hwmap.min.js"></script>
  <script type="text/javascript" src="jquery.min.js"></script>
  <link rel="stylesheet" href="index.css">
</head>
<body>
  <div id="echarts-map"></div>
  <script src="index.js" type="text/javascript"> </script>
</body>
</html>
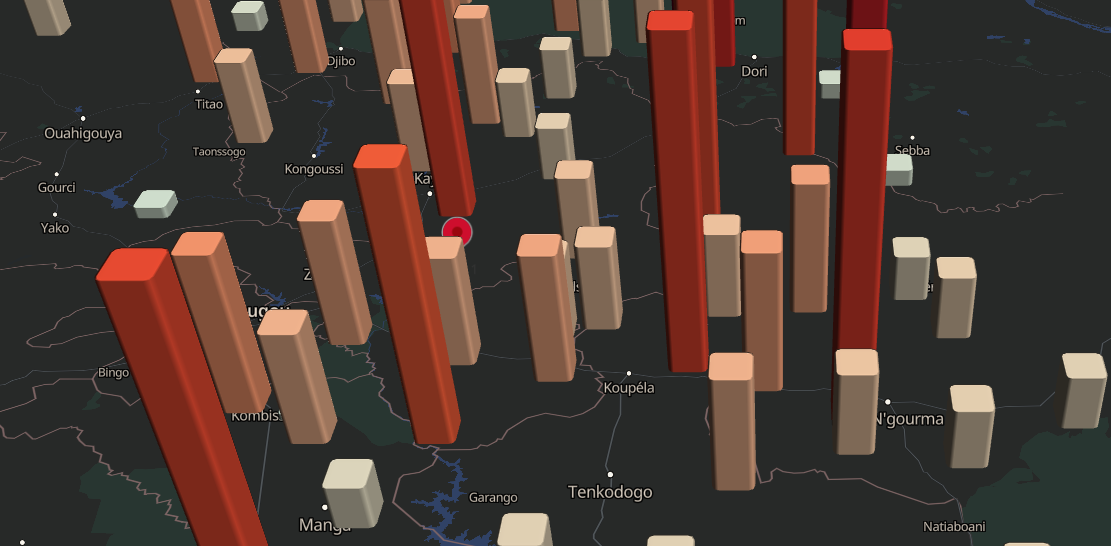
[h2]Bar3D
The sample code is as follows:
JavaScript
const chart = echarts.init(document.getElementById('echarts-map'));
window.initMap = function() {
  $.getJSON('assets/json/bar3DData.json', (data) => {
    const options = {
      visualMap: [{
        show: false,
        min: 0,
        max: 100,
        seriesIndex: 0,
        calculable: true,
        inRange: {
          color: ['#a5f3fa', '#e8c6a3', '#f3683c', '#d73027', '#a50026'],
        },
      }],
      hwmap3D: {
        presetStyleId: 'night',
        sourceType: 'raster',
        center: {lng: -0.93, lat: 12.73},
        zoom: 9,
        pitch: 60,
        boxHeight: 120,
        language: 'en',
      },
      series: [{
        type: 'bar3D',
        roam: true,
        shading: 'realistic',
        coordinateSystem: 'hwmap3D',
        barSize: 5,
        bevelSize: 0.3,
        silent: true,
        data,
      }],
    };

    chart.setOption(options);
    const map = chart.getModel().getComponent('hwmap3D').getHWMap();

    const customPoi = new HWMapJsSDK.HWCustomPoi({
      map,
      icon: {
        anchor: 'bottom',
        scale: 1,
        opacity: 1,
      },
      label: {
        color: '#333',
        fontSize: '14px',
        text: 'point 1',
        offsetX: 0,
        offsetY: 0,
      },
      position: {lng: -0.93, lat: 12.73},
      zIndex: 0,
      collisionEnabled: true,
      variableLabelAnchor: ['top', 'bottom'],
    });
  });
};
HTML
<!DOCTYPE html>
<html lang="en">
<head>
  <base href="../../">
  <meta charset="utf-8">
  <meta name="renderer" content="webkit">
  <meta http-equiv="cleartype" content="on">
  <meta http-equiv="x-dns-prefetch-control" content="on">
  <meta http-equiv="X-UA-Compatible" content="IE=edge,chrome=1">
  <title>an example for echarts-extension-hwmap</title>
  <link rel="icon" href="data:;base64,=">
  <script src="https://mapapi.cloud.huawei.com/mapjs/v1/api/js?callback=initMap&key=API KEY"></script>
  <script src="https://polyfill.io/v3/polyfill.min.js?features=default"></script>
  <script type="text/javascript" src="echarts.min.js"></script>
  <script type="text/javascript" src="echarts-gl.js"></script>
  <script src="https://mapapi.cloud.huawei.com/mapjs/v1/api/js/echarts-extension-hwmap.min.js"></script>
  <script type="text/javascript" src="jquery.min.js"></script>
  <link rel="stylesheet" href="index.css">
</head>
<body>
  <div id="echarts-map"></div>
  <script src="index.js" type="text/javascript"> </script>
</body>
</html>
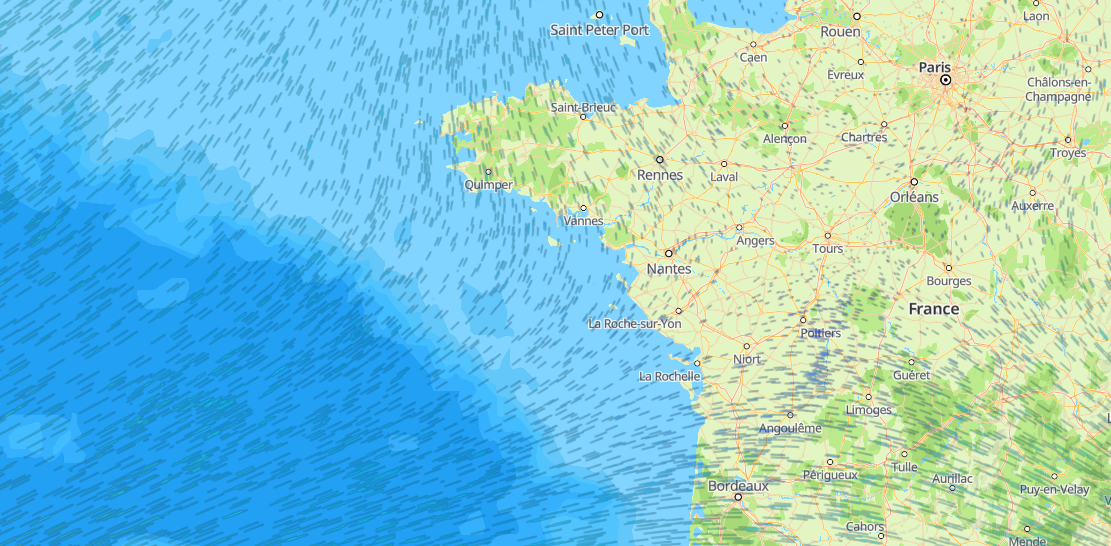
[h2]FlowGL
The sample code is as follows:
JavaScript
var chart = echarts.init(document.getElementById("echarts-map"));
window.initMap = function() {
  $.getJSON('assets/json/flowGL.json', function (data) {
    var max = 0;
    var min = Infinity;
    data.map(item =>{
      item.push(Math.sqrt(item[2] * item[2] + item[3] * item[3]))
    })
    data.map(item=> {
      max = Math.max(item[4], max);
      min = Math.min(item[4], min);
    })
    const option = {
      hwmap: {
        center: {lng:9.888685440170336, lat: 49.799172724734234},
        zoom: 1,
        language: 'en',
        style:[],
        renderOnMoving: true,
      },
      visualMap: {
        left: 'right',
        min,
        max,
        dimension: 4,
        inRange: {
          color: ['#0a06eb',  '#06d6eb','#eb7a06','#eb0606', 'red']
        },
        calculable: true,
        textStyle: {
          color: '#fff'
        }
      },
      series: [
        {
          type: 'flowGL',
          coordinateSystem: 'hwmap',
          data: data,
          supersampling: 4,
          particleType: 'line',
          particleDensity: 128,
          particleSpeed: 1,
          gridWidth: Math.floor(max),
          gridHeight: Math.floor(max),
          itemStyle: {
            opacity: 0.7
          }
        }
      ]
    };
    chart.setOption(option);
  })
}
HTML
<!DOCTYPE html>
<html lang="en">
<head>
  <base href="../../">
  <meta charset="utf-8">
  <meta name="renderer" content="webkit">
  <meta http-equiv="X-UA-Compatible" content="IE=edge,chrome=1">
  <title>an example for echarts-extension-hwmap</title>
  <link rel="icon" href="data:;base64,=">
  <script src="https://mapapi.cloud.huawei.com/mapjs/v1/api/js?callback=initMap&key=API KEY"></script>
  <script src="https://polyfill.io/v3/polyfill.min.js?features=default"></script>
  <script type="text/javascript" src="echarts.min.js"></script>
  <script type="text/javascript" src="echarts-gl.js"></script>
  <script src="https://mapapi.cloud.huawei.com/mapjs/v1/api/js/echarts-extension-hwmap.min.js"></script>
  <script type="text/javascript" src="jquery.min.js"></script>
  <link rel="stylesheet" href="index.css">
</head>
<body>
  <div id="echarts-map"></div>
  <script src="index.js" type="text/javascript"> </script>
</body>
</html>
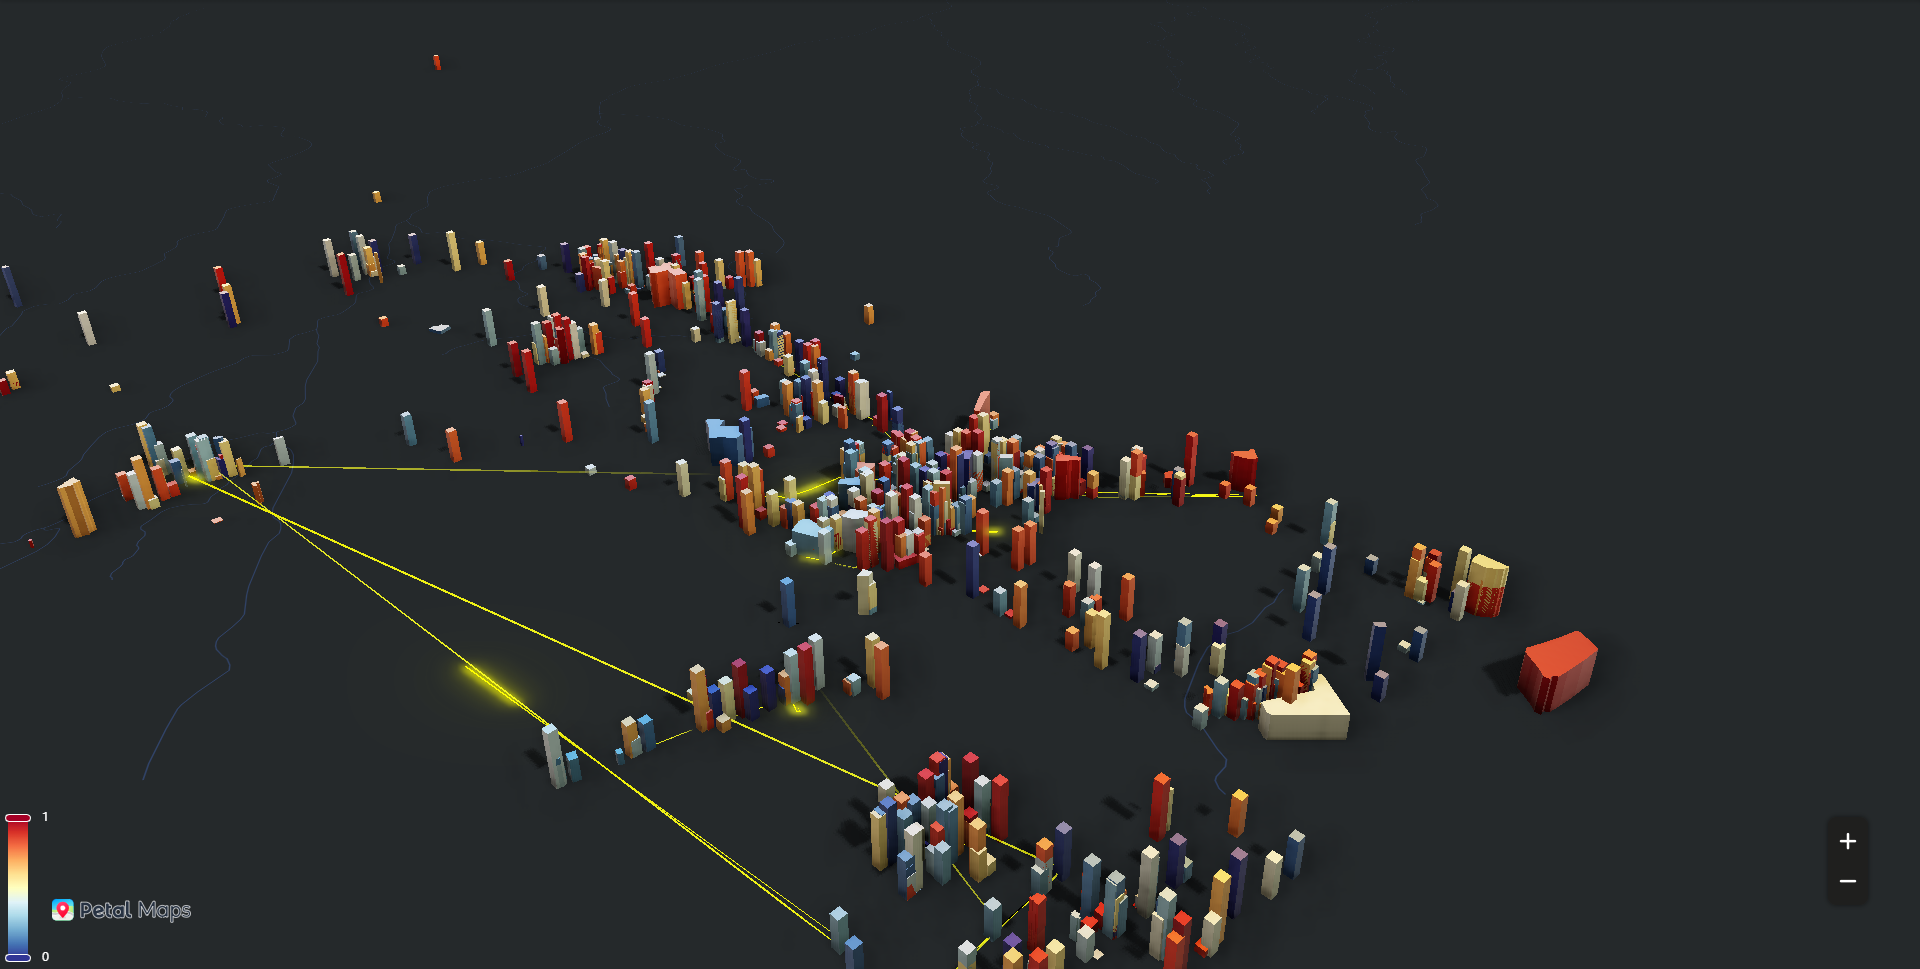
[h2]Lines3D
The sample code is as follows:
JavaScript
window.initMap = function () {
  var myChart = echarts.init(document.getElementById("echarts-map"))
  $.getJSON("assets/json/buildingsgeo.json", function(buildingsGeoJSON) {
    echarts.registerMap('buildings', buildingsGeoJSON)
    var regionsData = buildingsGeoJSON.features.map(function(feature) {
      return {
        name: feature.properties.name,
        value: Math.random(),
        height: Math.random() * 1000,
        label: feature.properties.name
      };
    })
    $.getJSON("assets/json/taxiRoutes.json", function(taxiRoutes) {
      var echartsOption = {
        visualMap: {
          show: true,
          seriesIndex: 1,
          min: 0,
          max: 1,
          inRange: {
            color: [
              '#313695',
              '#4575b4',
              '#74add1',
              '#abd9e9',
              '#e0f3f8',
              '#ffffbf',
              '#fee090',
              '#fdae61',
              '#f46d43',
              '#d73027',
              '#a50026'
            ]
          },
          calculable: true,
          textStyle: {
            color: '#fff'
          }
        },
        hwmap3D: {
          presetStyleId:'night',
          center: [13.5371, 22.801624],
          zoom: 12,
          language: 'en',
          pitch: 100,
          postEffect: {
            enable: true,
            SSAO: {
              enable: true,
              intensity: 1.3,
              radius: 5
            },
            screenSpaceReflection: {
              enable: false
            }
          },
          groundPlane: {
            show: true,
            color: '#333'
          },
          light: {
            main: {
              intensity: 6,
              shadow: true,
              shadowQuality: 'high',
              alpha: 30
            },
            ambient: {
              intensity: 0
            },
            ambientCubemap: {
              texture: 'assets/ambientCubemapTexture.hdr',
              exposure: 2,
              diffuseIntensity: 1,
              specularIntensity: 2
            }
          }
        },
        series: [{
          type: 'lines3D',
          coordinateSystem: 'hwmap3D',
          effect: {
            show: true,
            constantSpeed: 5,
            trailWidth: 2,
            trailLength: 0.4,
            trailOpacity: 1,
            spotIntensity: 10
          },
          blendMode: 'lighter',
          polyline: true,
          lineStyle: {
            width: 0.1,
            color: 'yellow',
            opacity: 0.0
          },
          data: taxiRoutes
        }, {
          type: 'map3D',
          map: 'buildings',
          data: regionsData,
          shading: 'realistic',
          instancing: true,
          coordinateSystem: 'hwmap3D',
          silent: true,
          realisticMaterial: {
            metalness: 1,
            roughness: 0.2,
          },
          groundPlane: {
            show: true,
            color: '#333'
          },
          boxWidth: 200,
          boxHeight: 1,
          viewControl: {
            minBeta: -360,
            maxBeta: 360,
            autoRotate: true
          },
        }]
      }
      myChart.setOption(echartsOption)
    })
  })
}
HTML
<!DOCTYPE html>
<html lang="en">
<head>
  <base href="../../">
  <meta charset="utf-8">
  <meta name="renderer" content="webkit">
  <meta http-equiv="cleartype" content="on">
  <meta http-equiv="x-dns-prefetch-control" content="on">
  <meta http-equiv="X-UA-Compatible" content="IE=edge,chrome=1">
  <title>an example for echarts-extension-hwmap</title>
  <link rel="icon" href="data:;base64,=">
  <script src="https://mapapi.cloud.huawei.com/mapjs/v1/api/js?callback=initMap&key=API KEY"></script>
  <script src="https://polyfill.io/v3/polyfill.min.js?features=default"></script>
  <script type="text/javascript" src="echarts.min.js"></script>
  <script type="text/javascript" src="echarts-gl.js"></script>
  <script src="https://mapapi.cloud.huawei.com/mapjs/v1/api/js/echarts-extension-hwmap.min.js"></script>
  <script type="text/javascript" src="jquery.min.js"></script>
  <link rel="stylesheet" href="index.css">
</head>
<body>
  <div id="echarts-map"></div>
  <script src="index.js" type="text/javascript"> </script>
</body>
</html>
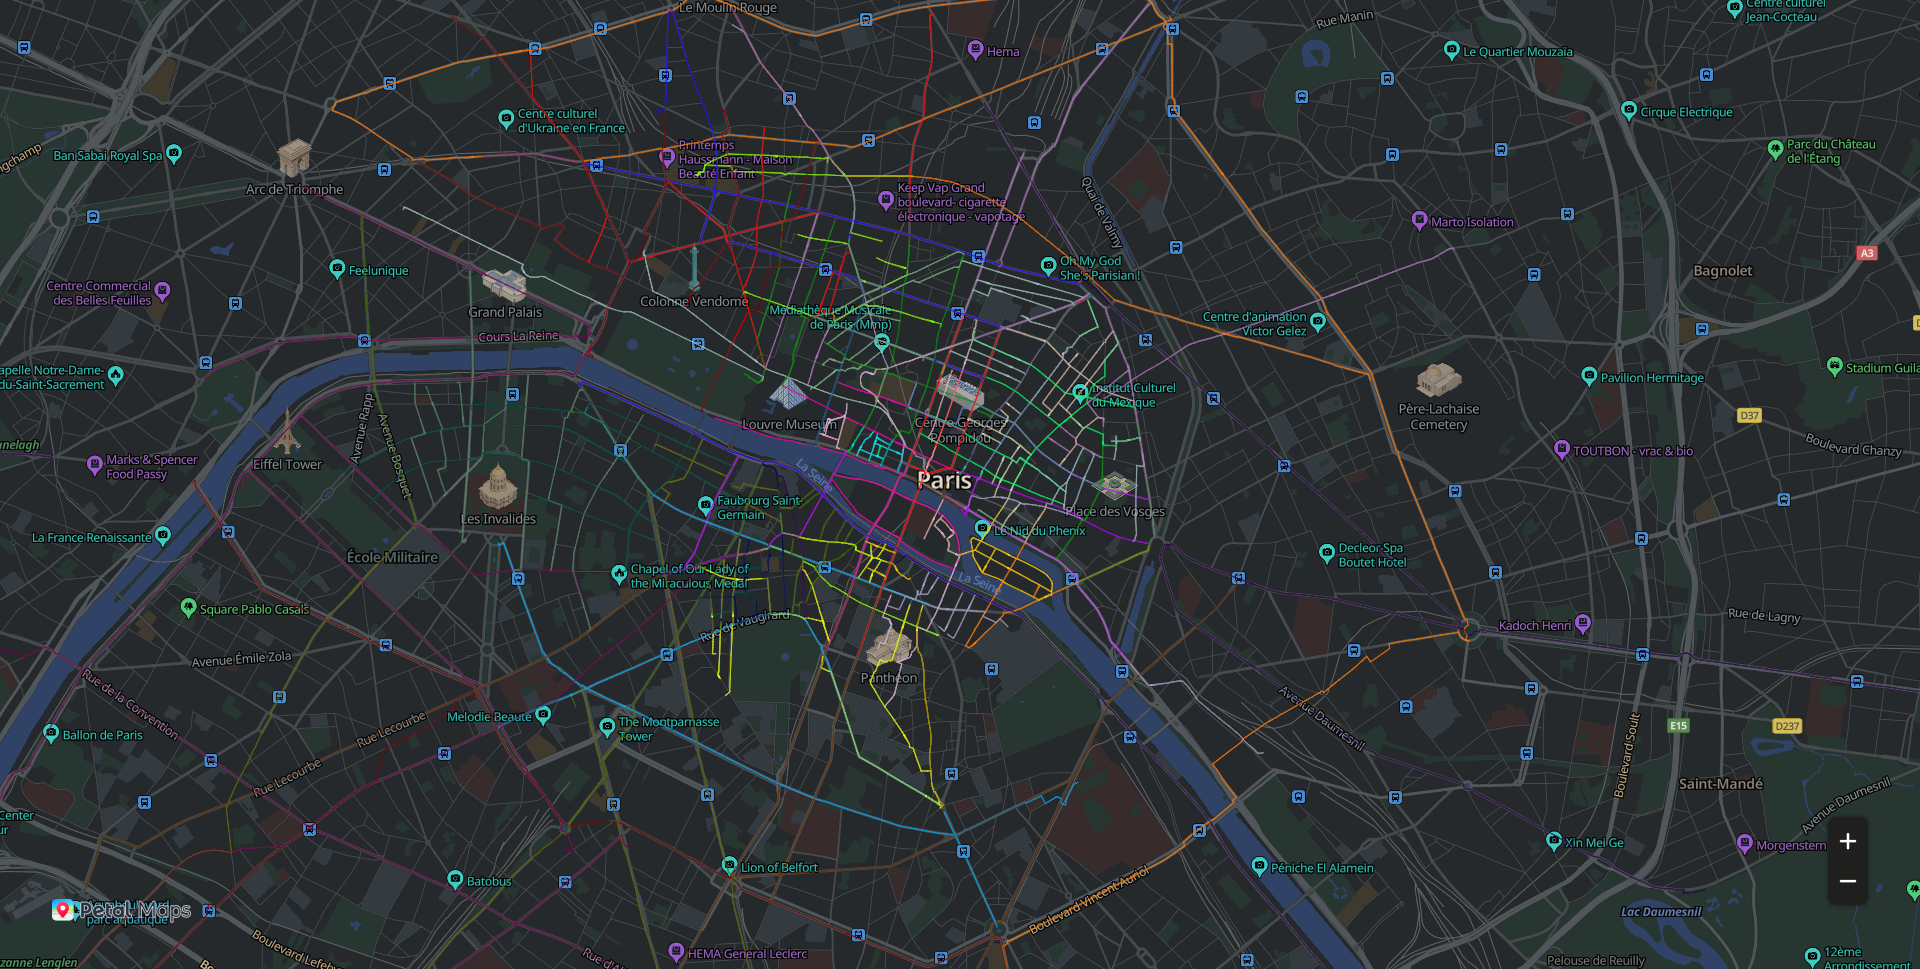
[h2]Lines
The sample code is as follows:
JavaScript
var chart = echarts.init(document.getElementById('echarts-map'));
window.initMap = function(){
  $.getJSON('assets/json/lines.json', function (data) {
    const options={
      hwmap: {
        center: [ 2.352222, 48.856613],
        zoom: 14,
        resizeEnable: true,
        presetStyleId: 'night',
        renderOnMoving: false,
        language: 'en',
        echartsLayerInteractive: true,
        largeMode: false
      },
      series: [{
        type: 'lines',
        coordinateSystem: 'hwmap',
        polyline: true,
        data: data,
        silent: true,
        lineStyle: {
          opacity: 0.3,
          width: 1
        },
        progressiveThreshold: 500,
        progressive: 200
      }, {
        type: 'lines',
        coordinateSystem: 'hwmap',
        polyline: true,
        data: data,
        lineStyle: {
          width: 0
        },
        effect: {
          constantSpeed: 20,
          show: true,
          trailLength: 0.1,
          symbolSize: 1.5
        },
        zlevel: 1
      }]
    }
    chart.setOption(options)
  });
}
HTML
<!DOCTYPE html>
<html lang="en">
<head>
  <base href="../../">
  <meta charset="utf-8">
  <meta name="renderer" content="webkit">
  <meta http-equiv="cleartype" content="on">
  <meta http-equiv="x-dns-prefetch-control" content="on">
  <meta http-equiv="X-UA-Compatible" content="IE=edge,chrome=1">
  <title>an example for echarts-extension-hwmap</title>
  <link rel="icon" href="data:;base64,=">
  <script src=""></script>
  <script src="https://mapapi.cloud.huawei.com/mapjs/v1/api/js?callback=initMap&key=API KEY"></script>
  <script src="https://polyfill.io/v3/polyfill.min.js?features=default"></script>
  <script type="text/javascript" src="echarts.min.js"></script>
  <script src="https://mapapi.cloud.huawei.com/mapjs/v1/api/js/echarts-extension-hwmap.min.js"></script>
  <script type="text/javascript" src="jquery.min.js"></script>
  <link rel="stylesheet" href="index.css">
</head>
<body>
  <div id="echarts-map"></div>
  <script src="index.js" type="text/javascript"> </script>
</body>
</html>
[h2]Polygons3D
The sample code is as follows:
JavaScript
var chart = echarts.init(document.getElementById('echarts-map'));
window.initMap=function(){
  $.getJSON('assets/json/polygons3D.json', function (data) {
    console.log(data)
    chart.setOption({
      visualMap: {
        left: 'right',
        min: 0,
        max: 1,
        inRange: {
          color: [
            '#313695',
            '#4575b4',
            '#74add1',
            '#abd9e9',
            '#e0f3f8',
            '#ffffbf',
            '#fee090',
            '#fdae61',
            '#f46d43',
            '#d73027',
            '#a50026'
          ]
        },
        textStyle: {
          color: '#fff'
        }
      },
      hwmap3D: {
        presetStyle:'night',
        language:'en',
        center: {lat: 48.856613, lng: 2.352222},
        zoom: 12,
        pitch: 50,
        postEffect: {
          enable: true,
          screenSpaceAmbientOcclusion: {
            enable: true,
            intensity: 1.2,
            radius: 5
          },
          screenSpaceReflection: {
            enable: true
          }
        },
        temporalSuperSampling: {
          enable: true
        },
        light: {
          main: {
            intensity: 1,
            shadow: false,
            shadowQuality: 'high'
          },
          ambient: {
            intensity: 0
          },
          ambientCubemap: {
            texture: 'assets/pisa.hdr',
            exposure: 1,
            diffuseIntensity: 0.5,
            specularIntensity: 2
          }
        }
      },
      series: [{
        type: 'polygons3D',
        coordinateSystem: 'hwmap3D',
        data,
        shading: 'realistic',
        silent: true,
        multiPolygon: true,
        progressiveThreshold: 500,
        progressive: 500,
        realisticMaterial: {
          metalness: 0,
          roughness: 1,
        }
      }]
    });
    window.addEventListener('resize', function () {
      chart.resize();
    });
  });
}
HTML
<!doctype html>
<html>
<head>
  <base href="../../">
  <meta charset="utf-8">
  <title>Map3D - ECHARTS-GL</title>
  <link rel="icon" href="data:;base64,=">
  <meta name="viewport" content="width=device-width, initial-scale=1, user-scalable=no">
  <meta name="apple-mobile-web-app-capable" content="yes">
  <script src="https://mapapi.cloud.huawei.com/mapjs/v1/api/js?callback=initMap&key=API KEY"></script>
  <script src="https://polyfill.io/v3/polyfill.min.js?features=default"></script>
  <script type="text/javascript" src="echarts.min.js"></script>
  <script type="text/javascript" src="echarts-gl.js"></script>
  <script src="https://mapapi.cloud.huawei.com/mapjs/v1/api/js/echarts-extension-hwmap.min.js"></script>
  <script type="text/javascript" src="dat.gui.js"></script>
  <script type="text/javascript" src="jquery.min.js"></script>
  <link rel="stylesheet" href="index.css">
</head>
<body>
  <div id="echarts-map"></div>
  <script src="index.js" type="text/javascript"> </script>
</body>
</html>