You can add a heatmap layer on top of a map to display colored points on the map. A set of these points will highlight an area on the map. For example, you can use a heatmap to show earthquake distribution, or use a heatmap to show traffic congestion that can remind users to avoid congested areas.
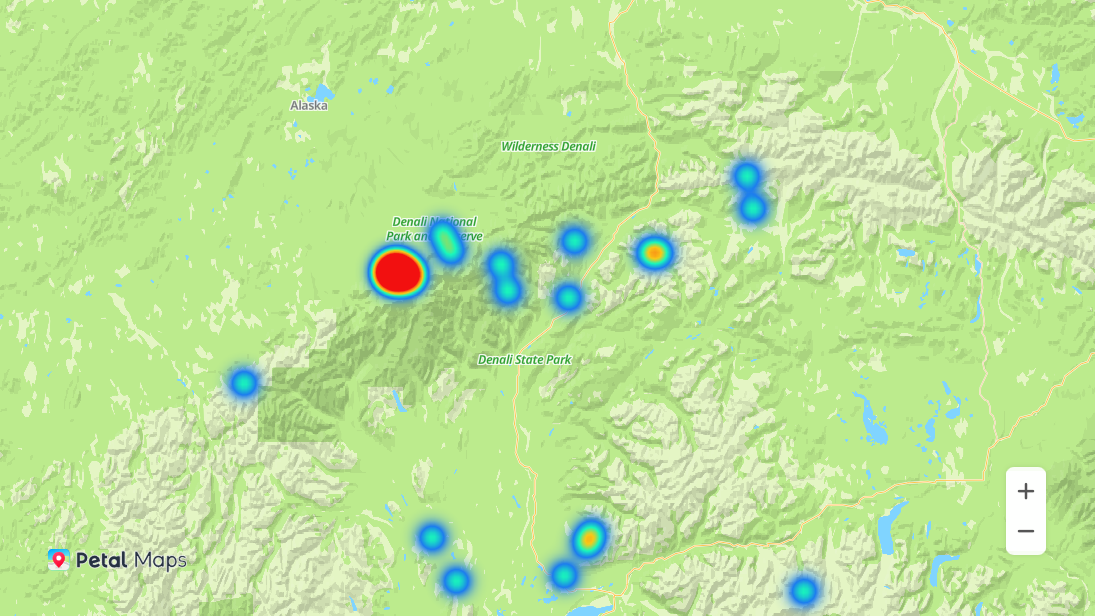
Adding a Heatmap
- Add a set of points to be displayed. The sample code shows coordinates of some example points:
const points = [
    {
        "location": {
            "lng": -151.5129,
            "lat": 63.1016
        }
    },
    {
        "location": {
            "lng": -150.4048,
            "lat": 63.1224
        }
    },
    {
        "location": {
            "lng": -151.3597,
            "lat": 63.0781
        }
    },
    {
        "location": {
            "lng": -118.497,
            "lat": 34.299667
        }
    },
]
Click points.zip to download the complete set of example coordinate points.
- Call HWMapJsSDK.HWHeatmapLayer(map, points, opts) to add a heatmap layer.
function initMap() {
    var mapOptions = {};
    mapOptions.center = {
        lat: 46.8755,
        lng: -112.516333
    };
    mapOptions.zoom = 4;
    mapOptions.language = 'en';

    // Initialize the map.
    map = new HWMapJsSDK.HWMap(document.getElementById('map'), mapOptions);
    // Initialize the heatmap.
    heatMap = new HWMapJsSDK.HWHeatmapLayer(map, points);
}
Customizing a Heatmap
You can set attributes listed in the table below to customize how a heatmap will be rendered. For details, please refer to HeatmapLayerOption.
| Attribute | Description |
|---|---|
| radius | Radius of a heatmap, in pixels. The value must be greater than or equal to 1. The default value is 30. |
| intensity | Intensity of a heatmap. The value must be greater than or equal to 0. The default value is 1. |
| opacity | Transparency of a heatmap. The value ranges from 0 to 1. The default value is 1. |
| colors | Heatmap color. Default colors: [
// The first color in the array must be in RGBA format and the transparency must be 0.
'rgba(45, 29, 238, 0)',
'rgba(29, 125, 238, 1)',
'rgba(25, 247, 187, 1)',
'rgba(249, 201, 23, 1)',
'rgba(249, 122, 23, 1)',
'rgba(242, 16, 16, 1)',
] |