InTouch Report
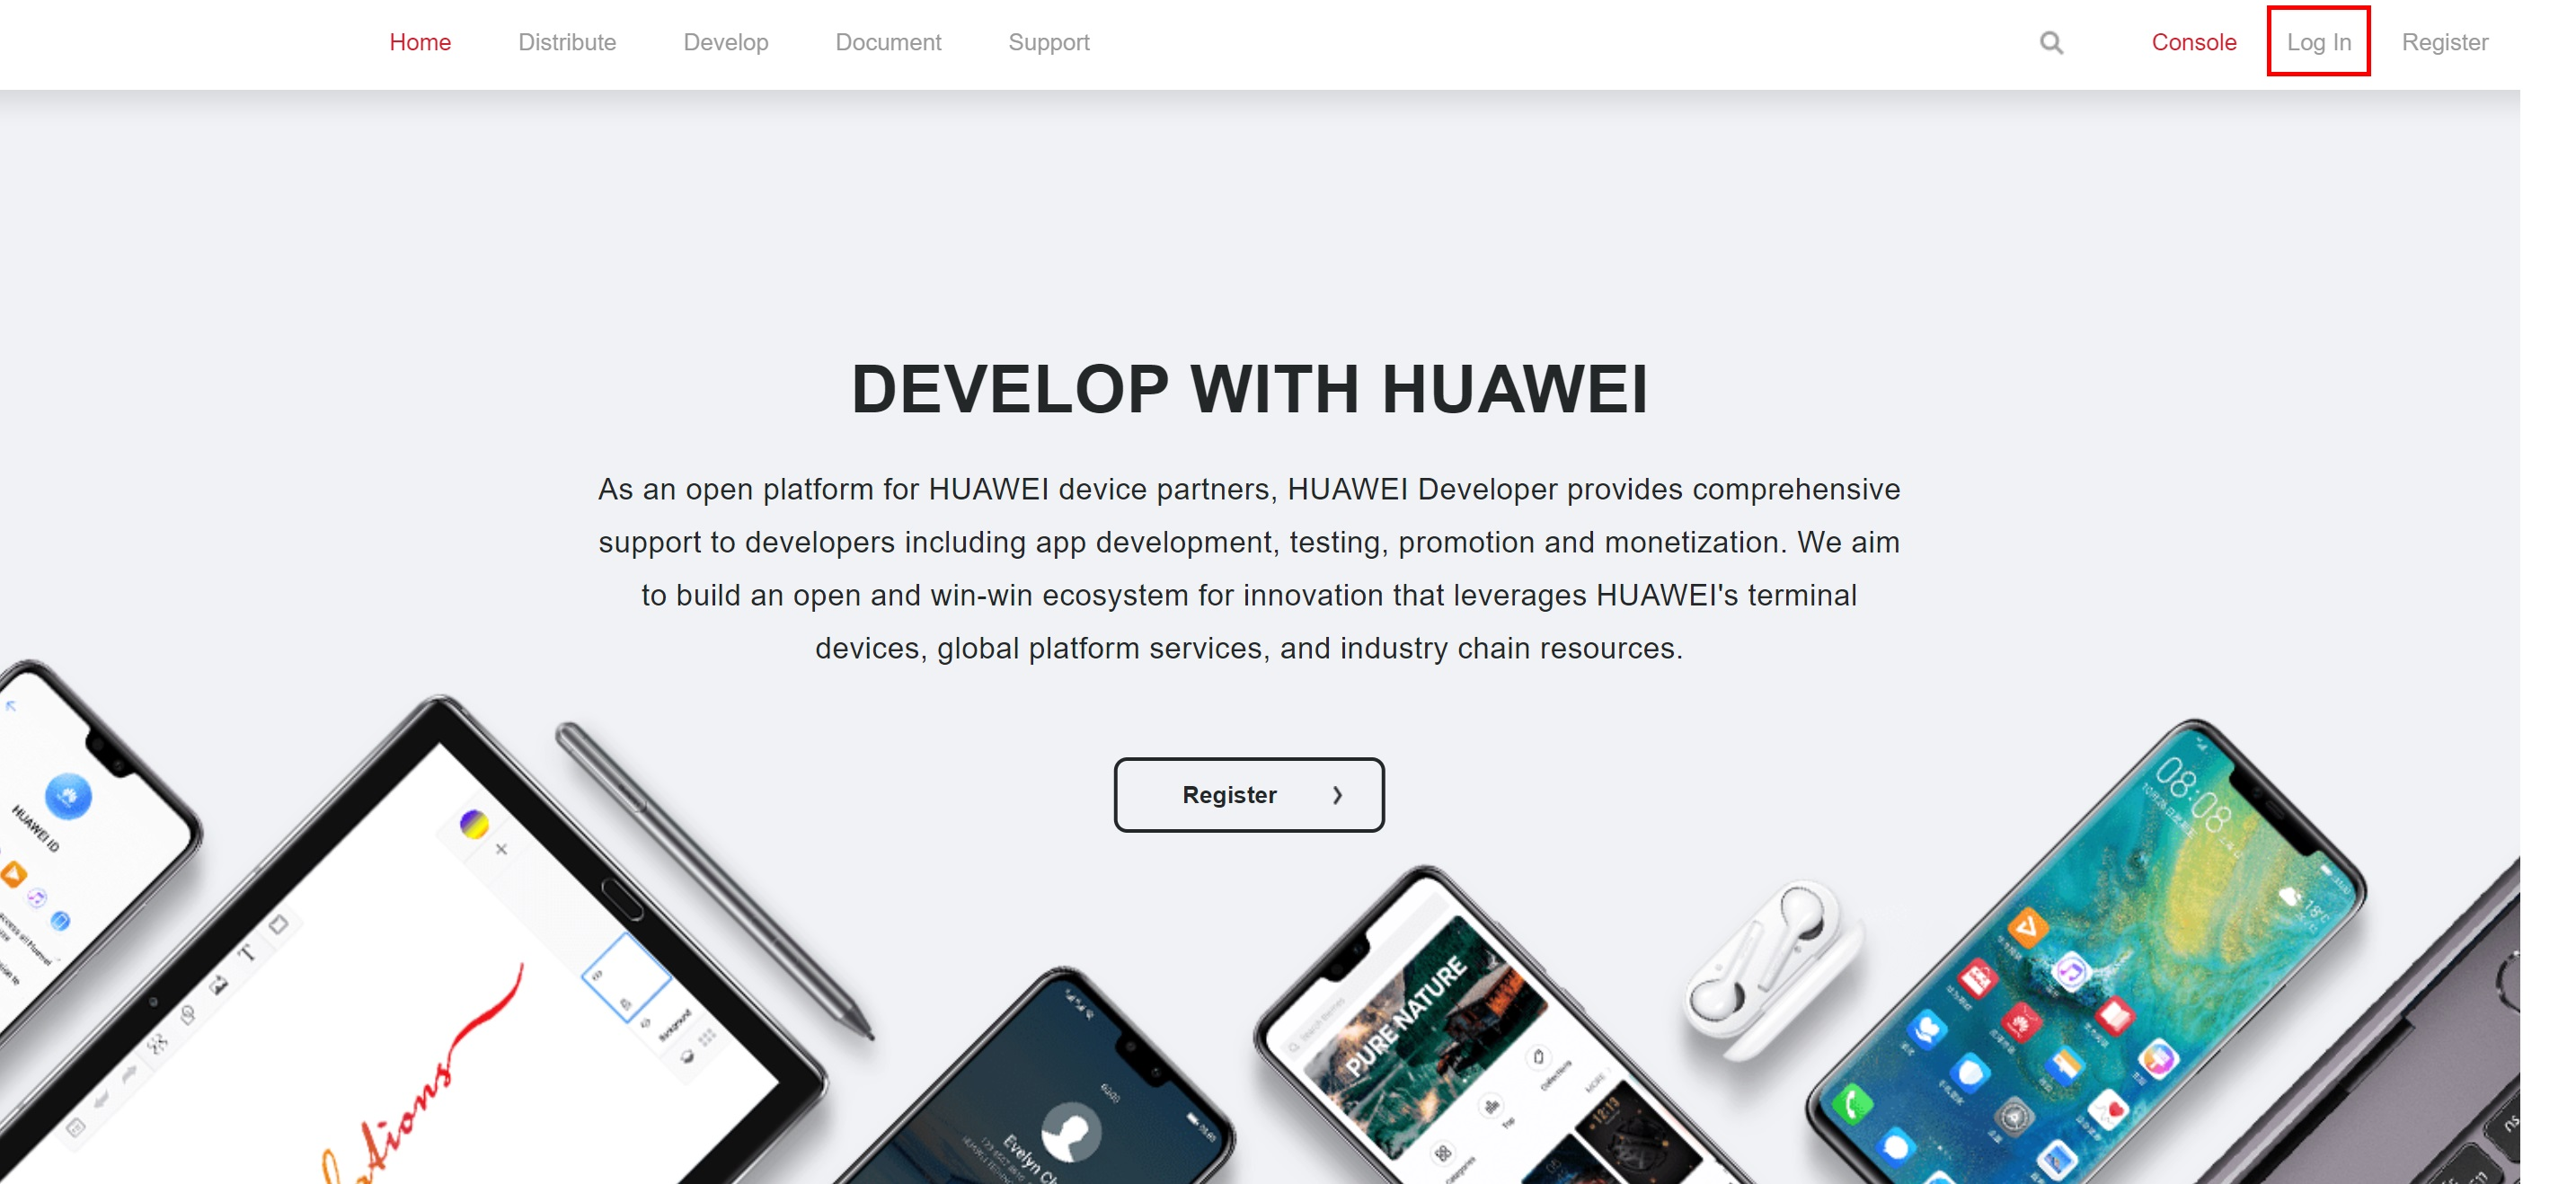
Step 1: Sign in to HUAWEI Developers and click Console in the upper right corner.

Step 2: Go to My report > InTouch report.
Using the InTouch Report

2.1 Operation Trend
Function: Collects statistics on game downloads and new users by channel, sub-channel, and partner, and statistics on active and retention users in the statistical period.

2.1.1 Presentation
The presentation types include Time, Partner, Region, Country, Project, Promotion Channel, and Application. For details about the presentation types, move the pointer to the question mark next to Presentation.


2.1.2 Data Presentation
The indicator categories include Promotion, Active, Consumption, and Retention. You can select the check boxes as needed. For details about the indicator categories, move the pointer to the question mark next to Index.


2.1.3 Details

You can select relevant dimensions as needed to query and export data.

- Currency unit: The options include CNY, LOCAL, and USD.
- Chart: Data is displayed in a chart. You can zoom/restore, refresh, or download the chart, or export the chart to an Excel file.
- Table: You can view data and export it to an Excel file.
2.2 Application Promotion
Collects statistics on game downloads by channel, sub-channel, partner, and activity name, statistics on active and paid users, and statistics on new users by channel, sub-channel, and partner in the statistical period.
2.2.1 Instructions
For details, please refer to section 2.1 "Operation Trend."

Collects statistics on subscription times, subscription success times, subscription conversion rate, new user retention rate, and unsubscribed users of relevant indicators by channel, sub-channel, partner, activity name, and payment channel.
2.3.1 Instructions
For details, please refer to section 2.1 "Operation Trend."
2.4 Leaderboard of Game
Collects statistics on game rankings by Game Start Sessions, Game Start Users, Game Success Download Times, Game New Users, and Game Revenue in the statistical period.
2.4.1 Instructions
For details, please refer to section 2.1 "Operation Trend."

2.5 Leaderboard of Joint Marketing
Collects statistics on joint-marketing game rankings by dimensions such as New VIPs of Channel, Total VIPs of Channel, New Paid VIPs of Channel, and Paid VIPs of Channel in the statistical period.
2.5.1 Instructions
You can select different dimensions as needed to view the trend curve and export data. For details about presentation dimensions or indicators, move the pointer to the question mark next to Presentation or Index, as shown in the screenshot below.

2.6 App User Retention
Collects statistics on app user retention of all games or selected games by selected dimensions in the statistical period. You can view app user retention data in a time range of 31 days.

2.6.1 Instructions
For details, please refer to section 2.1 "Operation Trend."
2.6.2 New Tab Page for Specified Content

You can select one or more games as needed to query their data in a stacked chart, tile chart, or table. Data in the table can be exported.
2.7 First Paid Return Code
Collects statistics on the first payment times and first payment success rate by payment channel, partner, promotion channel, and activity.
2.7.1 Instructions
For details, please refer to section 2.1 "Operation Trend."

2.8 Subscription Renewal
Collects statistics on subsequent daily payment of new VIP users. Data in a time range of 31 days before the current period can be collected.
2.8.1 Instructions
For details, please refer to section 2.1 "Operation Trend."
