Stack capturing of heap memory by DevEco
The Allocation template of DevEco Studio Profiler helps you analyze the information about heap memory allocation and release, memory mapping, and call stacks.
- Open the IDE and choose Profiler.
- Click Allocation.
- Click Create Session to create a recording session.
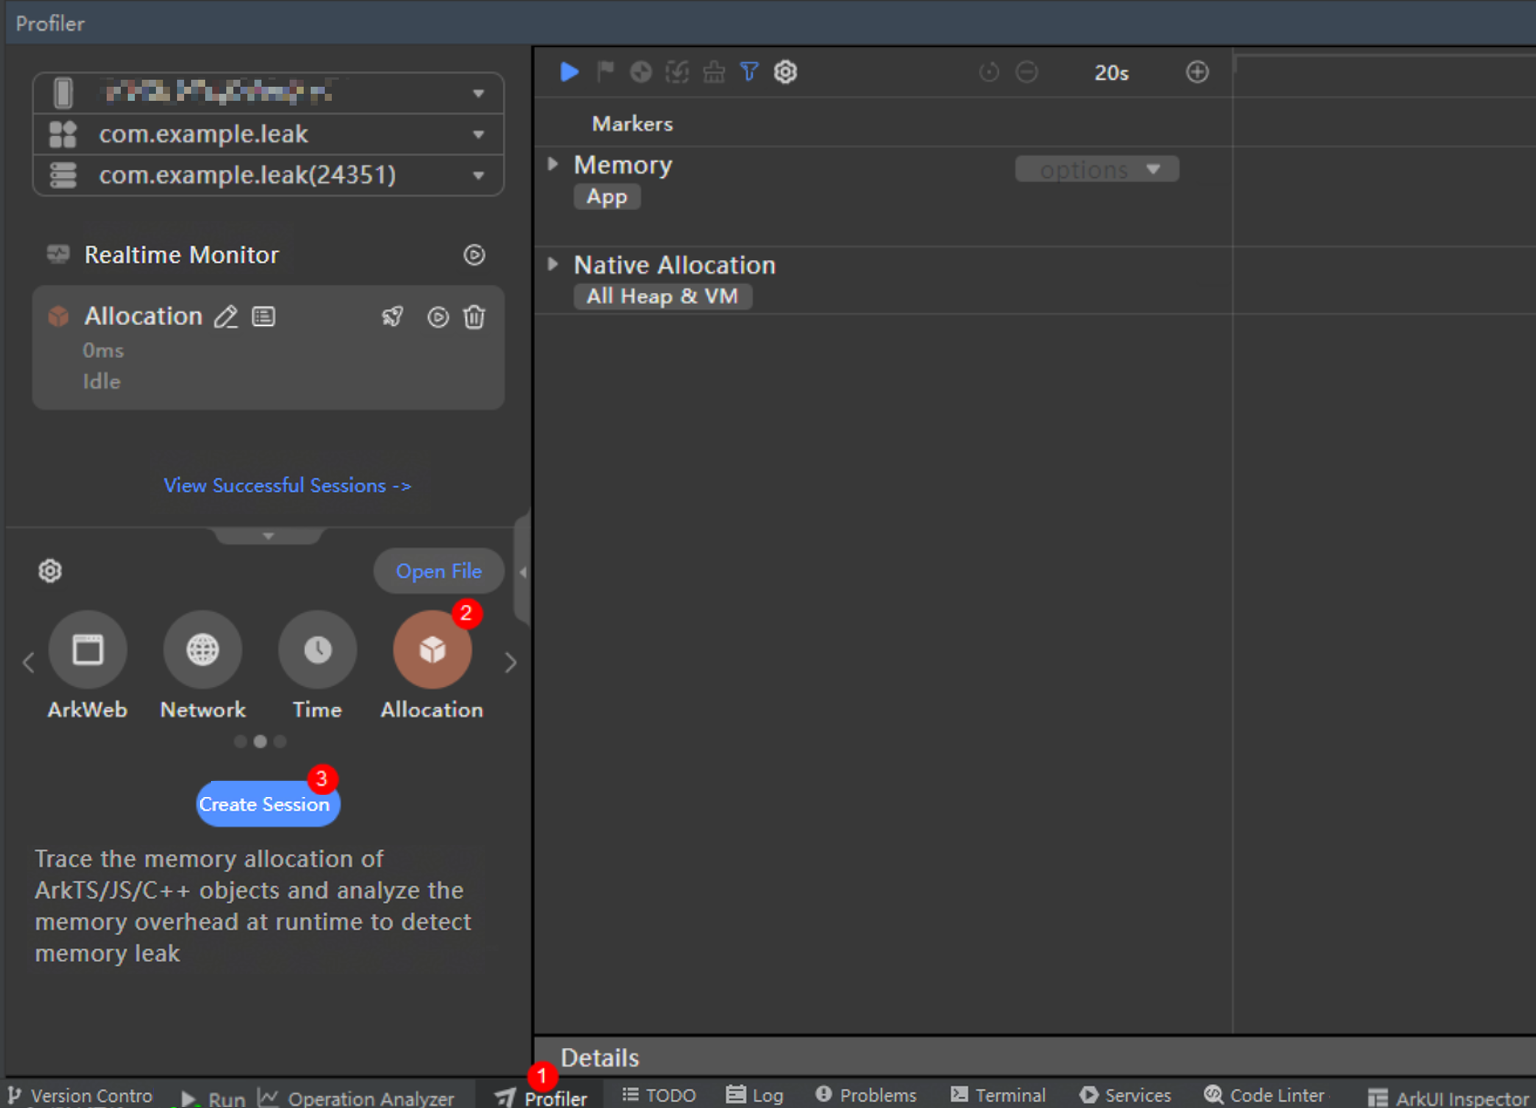
- Select Memory from the filter.

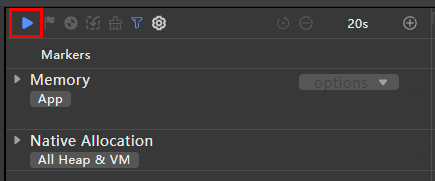
- Click the button to start stack capturing.
- After the recording is complete, click the recording result and analyze the growth trend of each memory in Memory.
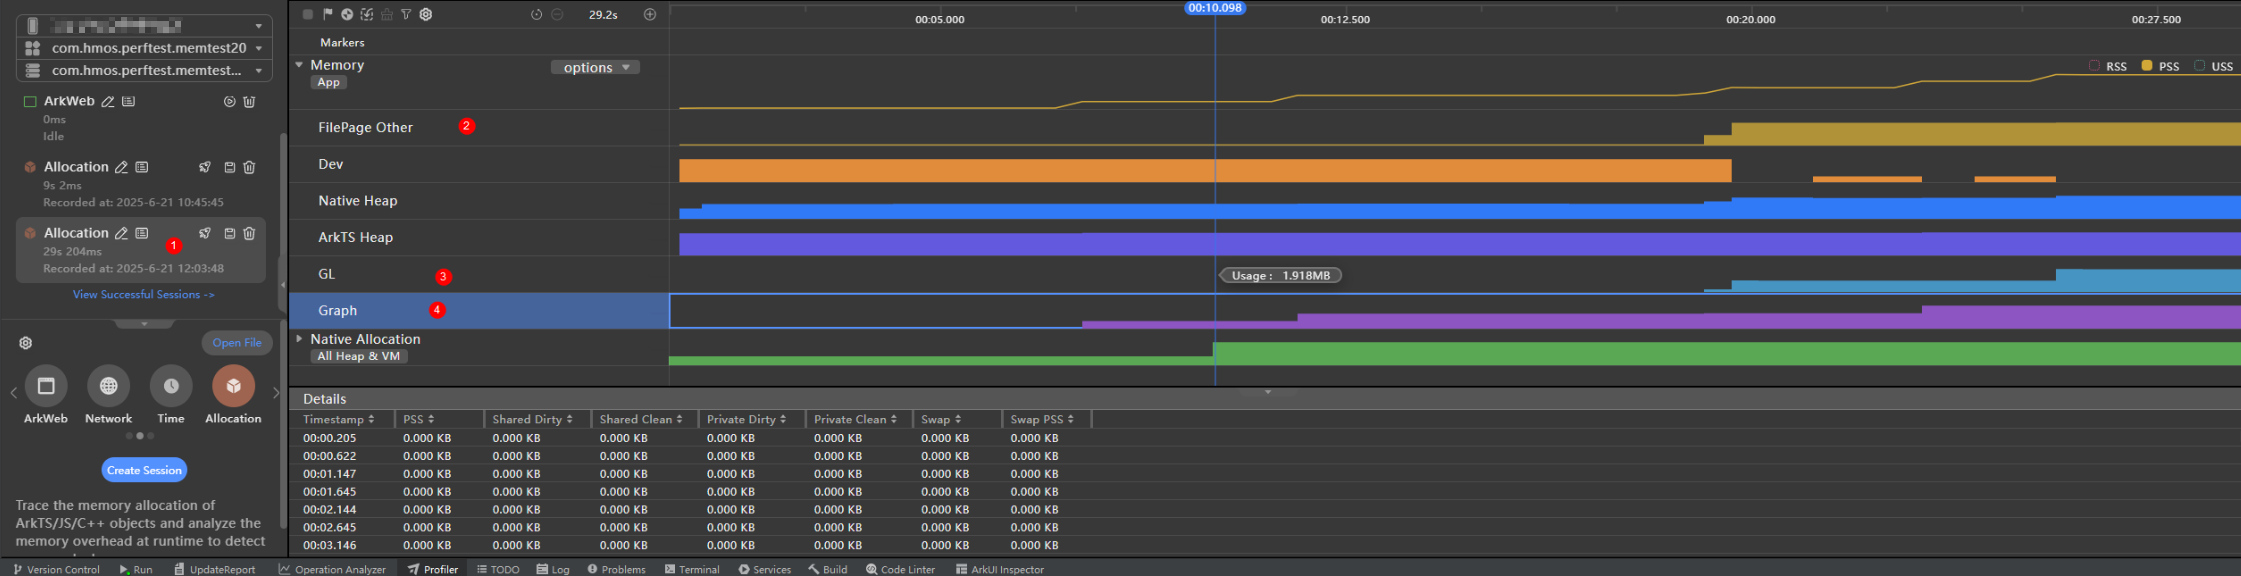
- FilePage Other: ashmem memory used by the app
- GL: GPU memory used by the app
- Graph: ION memory used by the app
When these types of memory increase, serious problems such as system suspension and artifacts may occur. In such cases, rectify the problems as soon as possible. For details, see the analysis methods for ashmem and ION memory leaks in Analyzing Memory Leaks.