Native memory refers to the heap memory allocated using malloc, new, realloc, or calloc function in the code and the memory address space mapped through mmap. Native memory occupies a large proportion of the process memory and is prone to memory leakage. When analyzing native memory distribution and usage, you need some tools, tests, and analysis skills. The Allocation template of DevEco Studio Profiler can be used to record functions such as malloc and free in the basic library and capture native memory allocation and release records, including the size and stack data, to analyze the native memory usage.
Stack capturing of DevEco heap memory allocation and release
The Allocation template of DevEco Studio Profiler helps users analyze the information about heap memory allocation and release, memory mapping, and call stack, including the released and unreleased memory. The procedure is as follows:
- Open the IDE and choose Profiler.
- Click Allocation.
- Click Create Session to create a recording channel.
- Set the filter option and choose Native Allocation.
- Configure the stack capturing properties.
- Click the record button and start tuning.
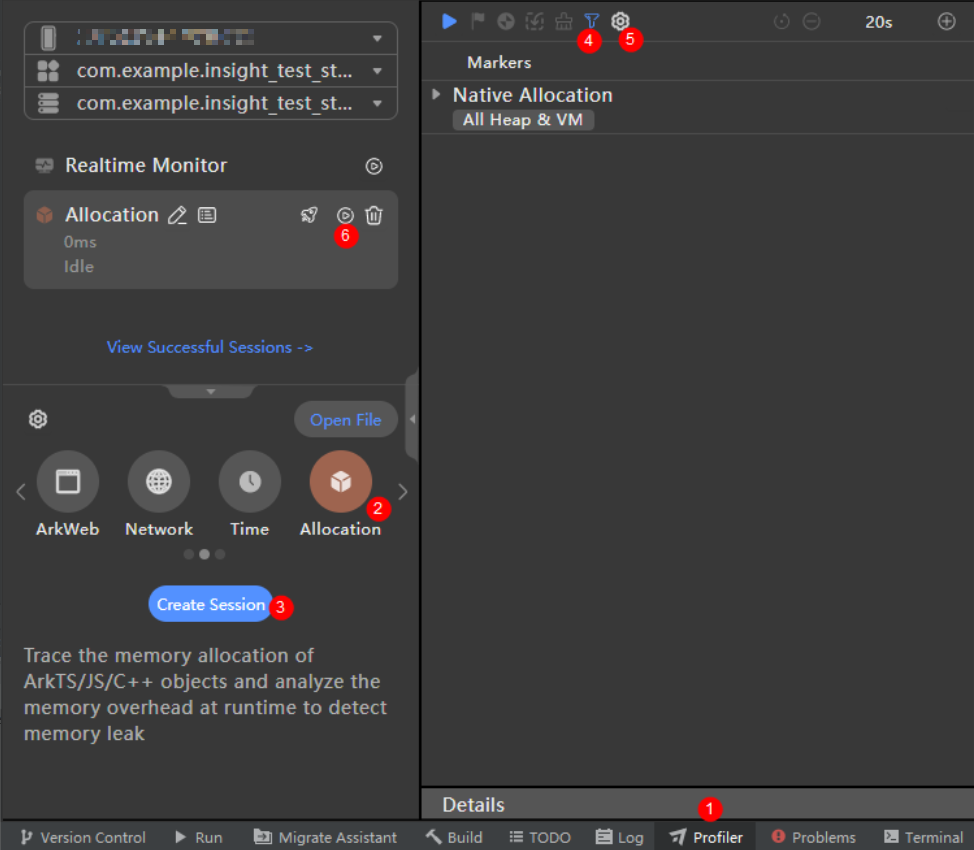

- Exercise caution when recording ArkTS Allocation at the same. If Native Allocation and ArkTS Allocation are recorded at the same time, performance issues may occur. You are advised to set the filter option in step 4 to filter ArkTS Allocation before recording Native Allocation.
- Applications not running the debug version cannot be recorded. Currently, only native stacks of applications running the debug version can be captured. If applications not running the debug version are captured, no stack information can be obtained.
- Note the rocket icon next to the recording button. After the rocket icon is selected, the process will be restarted during tuning. If you need to record the native memory allocation of a process from the start, select the rocket icon before clicking the recording button.
Stack capturing properties when the Allocation template of DevEco Studio Profiler is used
This section describes the properties configured in step 5 of the previous section.
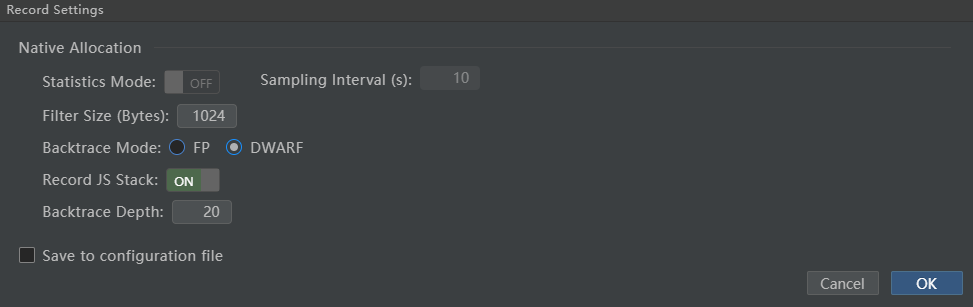
- Statistics Mode: Enabling this mode means that the same call stacks within 10 seconds will be accumulated. In this case, IDE displays only one stack, the number of occurrences, and total unreleased memory of the stack. Single call stacks are not recorded. When Statistics Mode is disabled, the occurrence time of each memory allocation stack is recorded in detail. You can enable Statistics Mode in scenarios requiring high performance.
- Sampling Interval (s): It is used only when Statistics Mode is enabled, indicating the sampling interval.
- Filter Size (Bytes): When it is enabled, memory allocation operations whose sizes are smaller than 1024 bytes are filtered and not recorded.
- Backtrace Mode: It indicates the backtrace mode. When FP is selected, the backtrace efficiency is high and the performance is good. When DWARF is enabled, stacks can be added or removed accurately in scenarios where FP cannot be selected, such as register reuse and compilation optimization.
- Record JS Stack: It determines whether to enable JS stack trace. Once it is enabled, you can capture the call chain of heap memory allocation from JS layer to Native layer.
- Backtrace Depth: It indicates backtrace depth. When Backtrace Mode is set to DWARF, this parameter indicates the total stack size. When Backtrace Mode is set to FP, this parameter indicates the native stack size.
When analyzing the data in the Allocation template of DevEco Studio Profiler, you can select All Heap to analyze the heap memory data. All Anonymous VM column displays the allocated anonymous memory, which is usually the memory allocated and released through mmap and munmap functions. The memory allocation is automatically performed by the process, and developers can hardly control it.
Memory allocation statistics
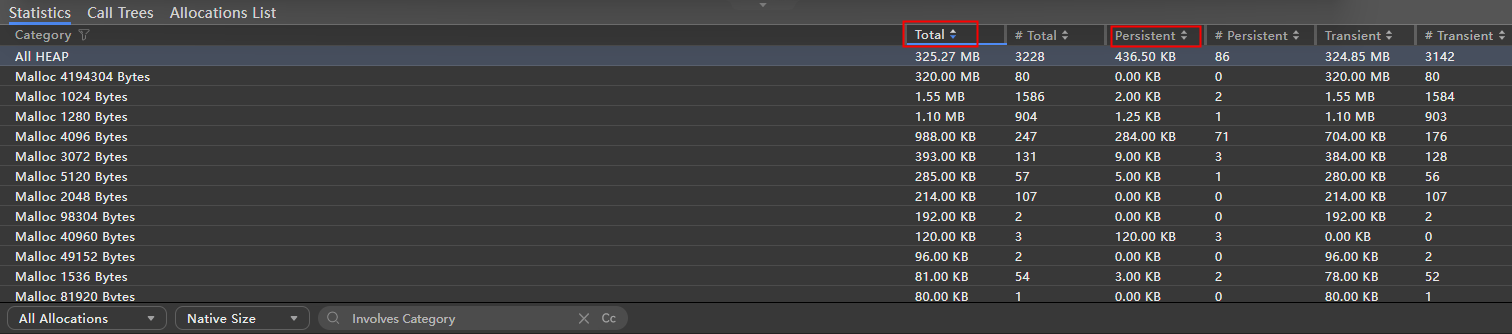
After selecting Statistics, you can view the size of native memory allocated to the process during stack capturing. You can view the total memory allocated to the process in the Total column.
You can view the total memory that is allocated but not released by the process in the Persistent column. In addition, you can view the size clustering information of memory allocation and sort the information as required.
Call stack information
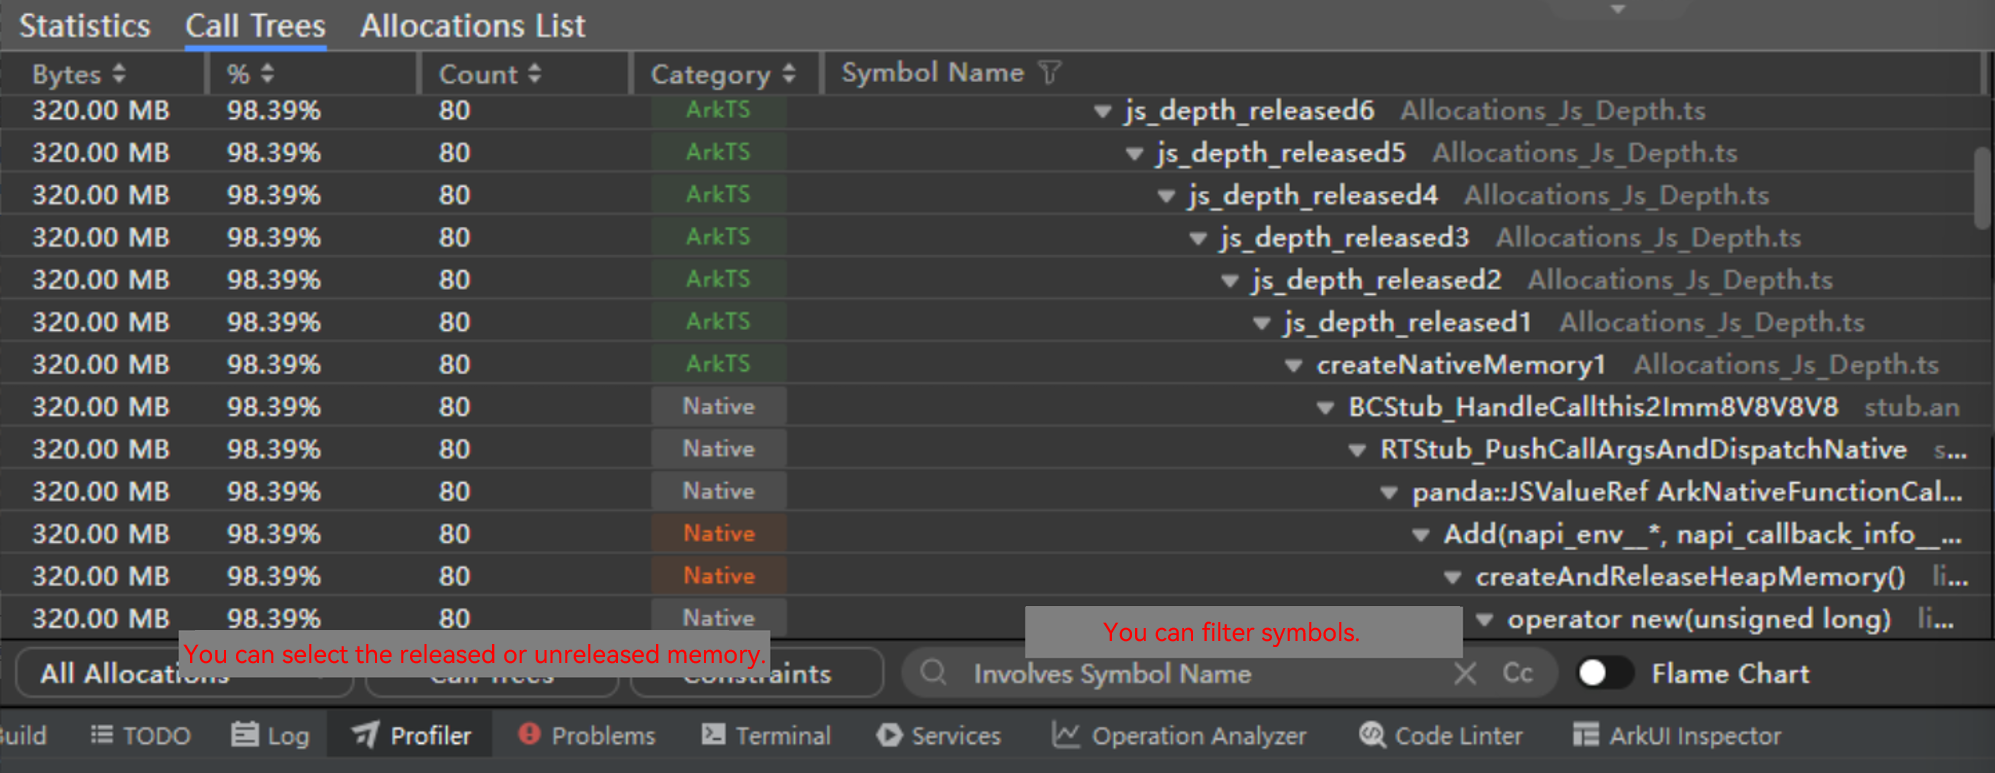
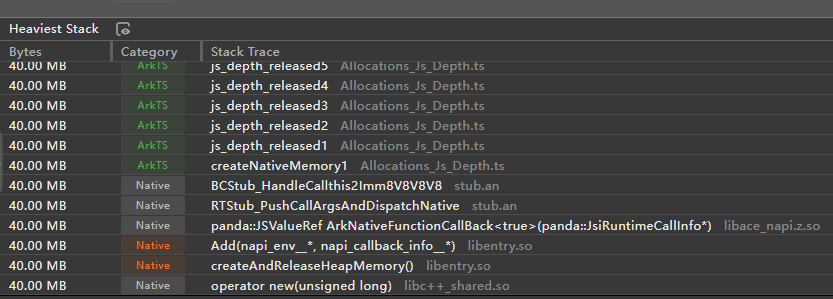
After selecting Call Trees, you can expand the stack to be analyzed. The stack is in the sequence of call chains from top to bottom. The bottom of the stack is usually the operator new function. The green part in the following figure is the ArkTS stack, which can be captured after Record JS Stack is enabled. You can choose to view the released or unreleased memory as required and search for the symbols to be filtered.
Statistics mode information
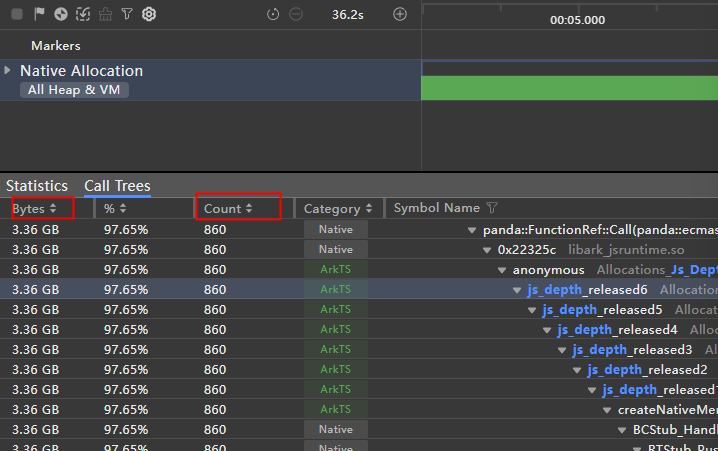
When Statistics Mode is selected, the captured information is simplified. The specific time of each call stack is not displayed. Instead, the information is displayed periodically in cluster mode. Therefore, the native memory allocation changes in a period are not displayed. You can view the total number of stack occurrences and the total size in the Count column, as shown in the following figure.
After capturing a trace using the Allocation template, you can analyze the trace as follows:
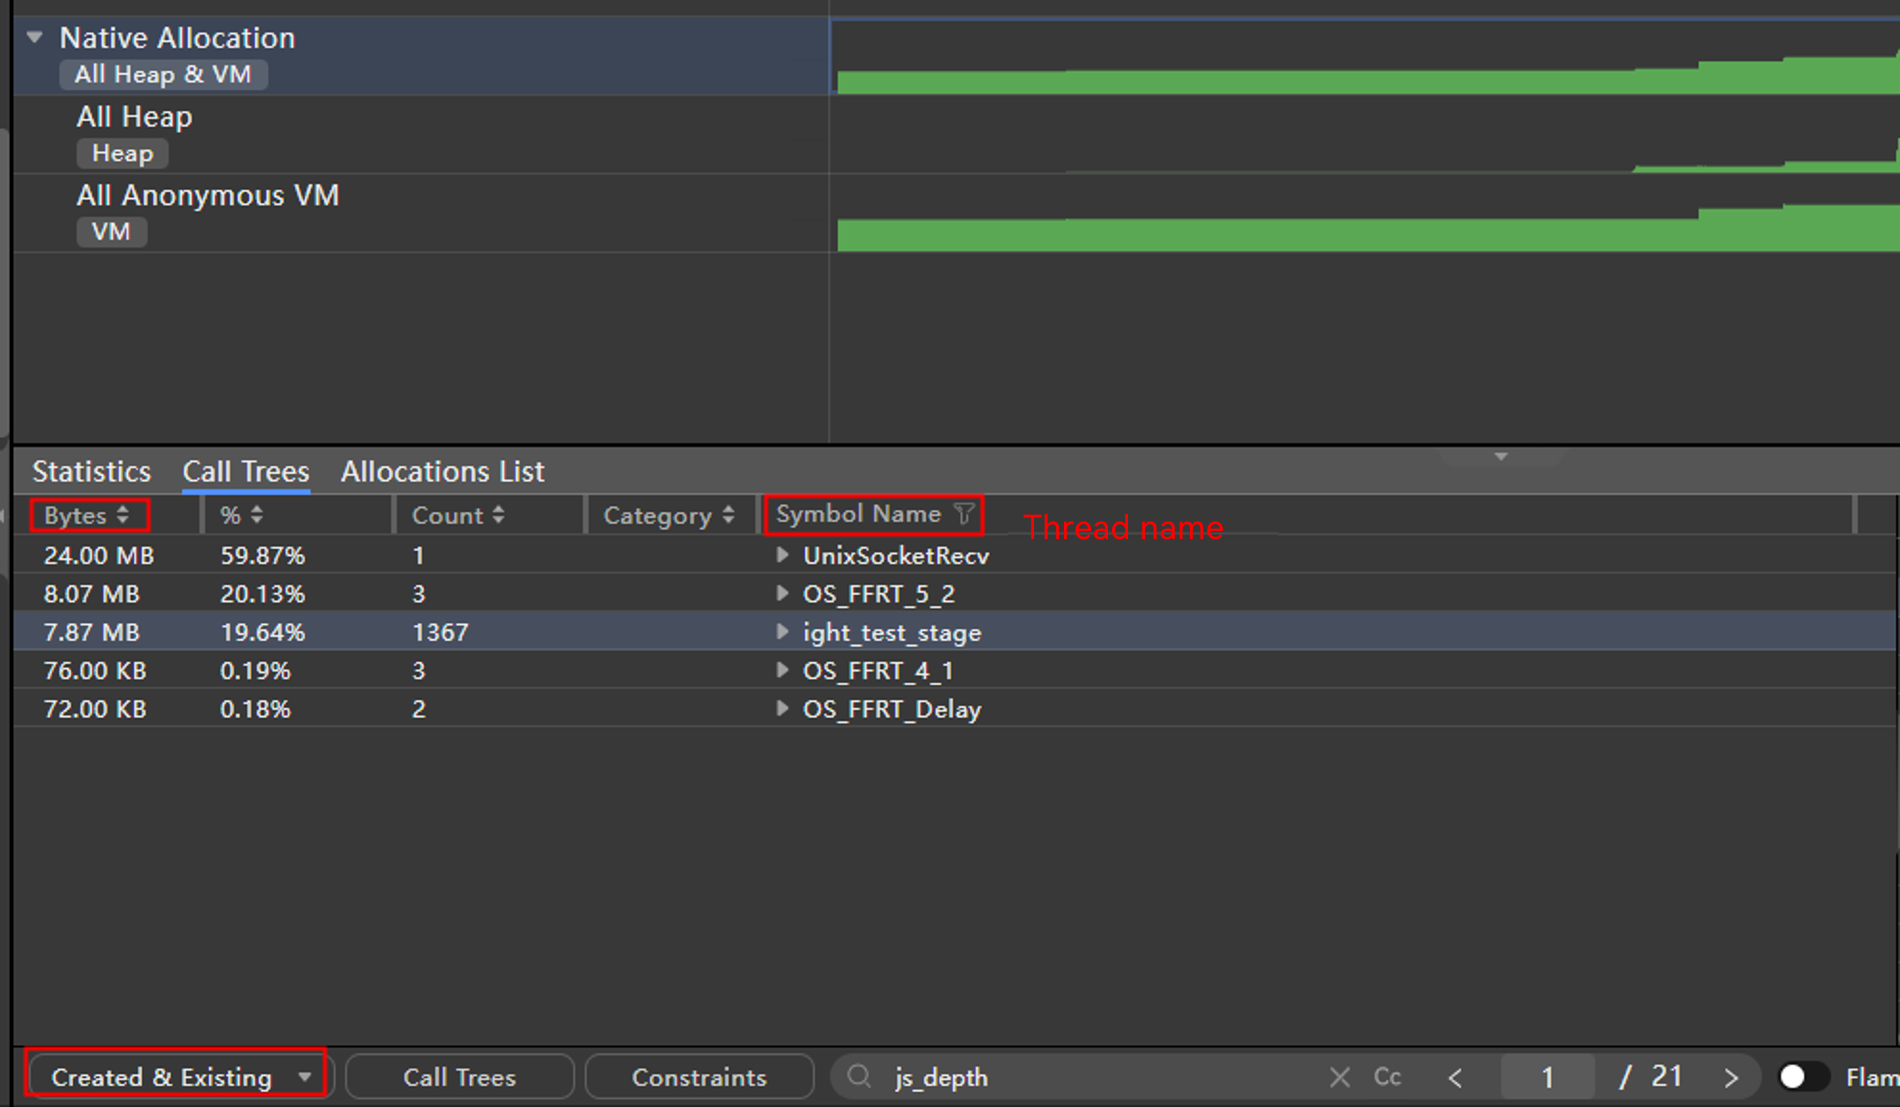
- Analyzing top threads with memory allocation: Select Created & Existing. In the Call Trees column, you can view the memory that is not released in different threads and analyze the threads with more memory leaks first. In the Allocation List column, you can search for thread names to further analyze the call stack.
When the ArkTS/JS code logic on the application triggers an NAPI call and the native layer is allocated with memory, the ArkTS/JS stack is transmitted to the Profiler and native stack for stitching, showing a complete call chain. Therefore, the Profiler can be used to analyze not only memory leakage issues, but also service logic and calling relationships.
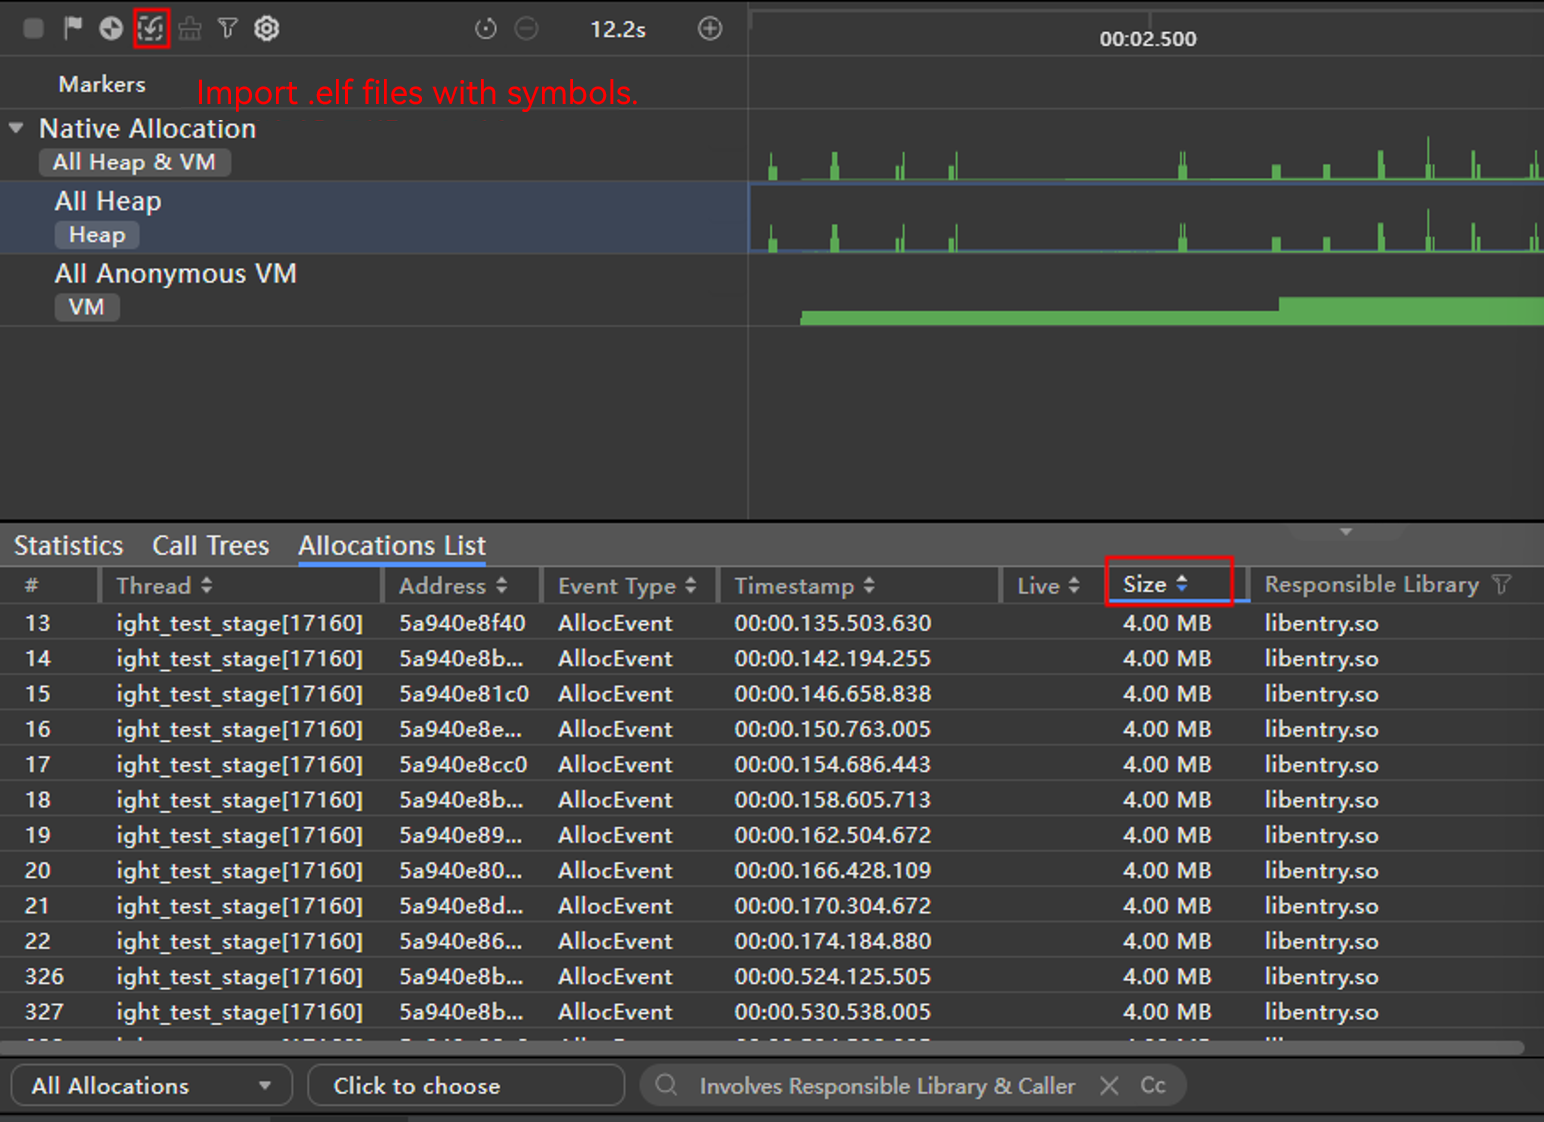
- Analyzing top call stacks for memory allocation: When capturing stacks using non-statistical mode, you can sort the memory allocation size of all call stacks in the Allocations List column and focus on the stacks with a large amount of memory allocated. If some frames in the call stack contain only addresses but not symbols, you need to import .elf files with symbols and then parse the files again. The import button is next to the filter option.
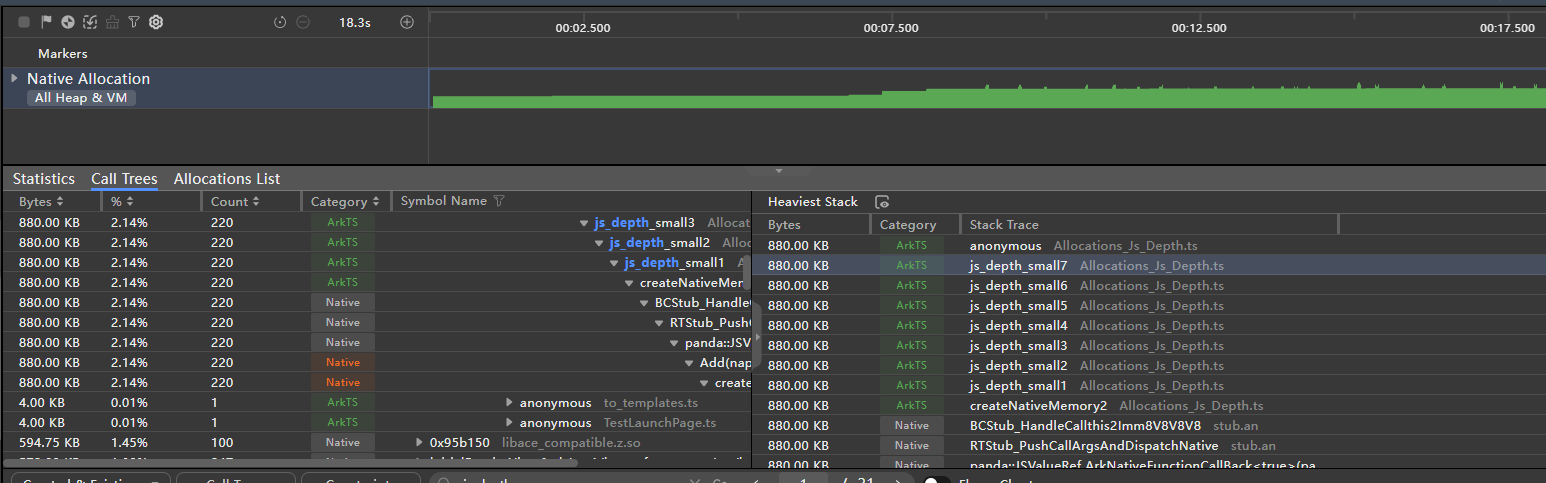
- Analyzing the specific call chain: After finding the call stack to be analyzed in Call Trees or Allocations List, find the call stacks to be analyzed. You can clearly see the specific call chain in Heaviest Stack on the right. The call chain displays the call logic from top to bottom.
Question: Why is it not unavailable to capture data of applications not running the debug version?
Answer: Due to security restrictions, the Profiler does not support capturing data of applications not running the debug version.
Question: Why is the heap memory size captured by the Allocation template smaller than the native heap value in the hidumper command output?
Answer: The Allocation template collects stacks of the user mode memory allocated using malloc, mmap, and other heap memory allocation functions in the target process. The memory that is not released in time and thread cache are not counted, but are included in the native heap of smaps.
Question: Why is the data captured by selecting FP in the Allocation template abnormal on the devices not using the AArch64 architecture?
Answer: After FP is selected in the Allocation template, the tuning of devices not using the AArch64 architecture is not supported.