Overview
When the multi-thread concurrency is involved in app development, you may frequently use the TaskPool or Worker concurrency capability. Serialization and deserialization are involved when objects or methods are transferred across threads. When an object is large and complex, the time required for serialization or deserialization will increase, which deteriorates the overall app performance. However, when analyzing performance issues, you cannot know whether serialization or deserialization is triggered on the system, or whether time-consuming operations are performed.
Therefore, to help you better identify possible time-consuming points related to the main-thread serialization or deserialization in the code, and to encourage you to use the Sendable object when transferring objects across threads, Ark Profiler and DevEco Studio have jointly developed and launched a timeout check tool for the main-thread serialization or deserialization. This tool is integrated into DevEco Profiler and can be enabled when you record app tuning. In the Anomaly lane of the recording result, you can view the tag and related timeout information of the main-thread serialization or deserialization. They can locate the code that takes a long time to serialize or deserialize by aligning the time with that of the current call stack in the ArkTS Callstack lane, and optimize the code through the reconstruction of Sendable or communication data (for example, changing the file buffer to the file path+offset) to improve the app performance.
Tool Introduction
DevEco Studio now supports the detection of the main-thread serialization and deserialization and timeout threshold configuration. It can generate an alarm in the lane when serialization and deserialization operations exceed the threshold and display the call stack information at the time, to help you locate performance problems.
[h2]Functionalities
Currently, DevEco Profiler provides the following functionalities for serialization and deserialization detection:
- Configures the serialization and deserialization timeout threshold.
- Views the time consumed by serialization and deserialization in lanes.
- Selects a time period for serialization or deserialization to view the call stack information during the time period in the ArkTS Callstack lane.
[h2]How to Implement
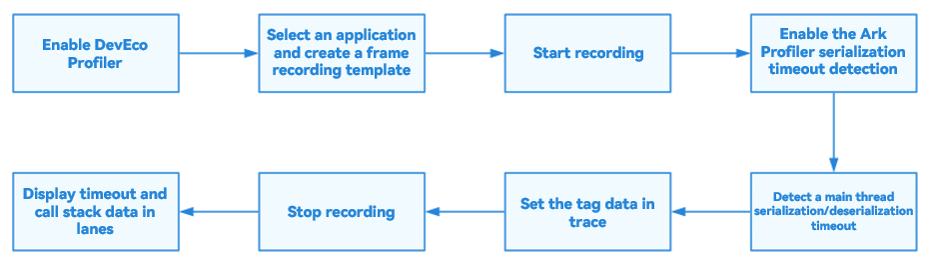
Timeout detection is enabled or disabled by using CDP protocols provided by Ark Profiler. Timeout detection is disabled by default and is enabled when DevEco Profiler is used for recording.
Table 1 Enabling or disabling protocols for timeout detection
Protocol Name | Input Parameter | Protocol Description |
Profiler.enableSerializationTimeoutCheck | threshold: int | Enables the timeout check tool and sets the timeout threshold (ms). |
Profiler.disableSerializationTimeoutCheck | / | Disables the timeout check tool. |
After the Profiler.enableSerializationTimeoutCheck is called, Ark Profiler calculates the time required for each serialization and deserialization API call by the main thread during recording in real time, and compares the time with the specified timeout threshold (8 ms by default). If the time exceeds the threshold, Ark Profiler generates timeout information containing fields listed in the following table.
Table 2 Fields in timeout information
Field | Field Name | Description |
tid | Thread ID | Thread ID, indicating the current timeout thread. |
task | Operation Type | Marks the current operation as serialization or deserialization. |
startTime | Start time | Marks the start time of the current operation. |
duration | Duration | Marks the actual duration of the serialization or deserialization. |
After the timeout information is generated, Ark Profiler sets the information to the trace through the trace setting API and marks the tag as Ark. In this way, a piece of trace information about the main-thread serialization or deserialization timeout is successfully generated and recorded.
- Open DevEco Studio and ensure that the device is connected and the app to be recorded has been installed.
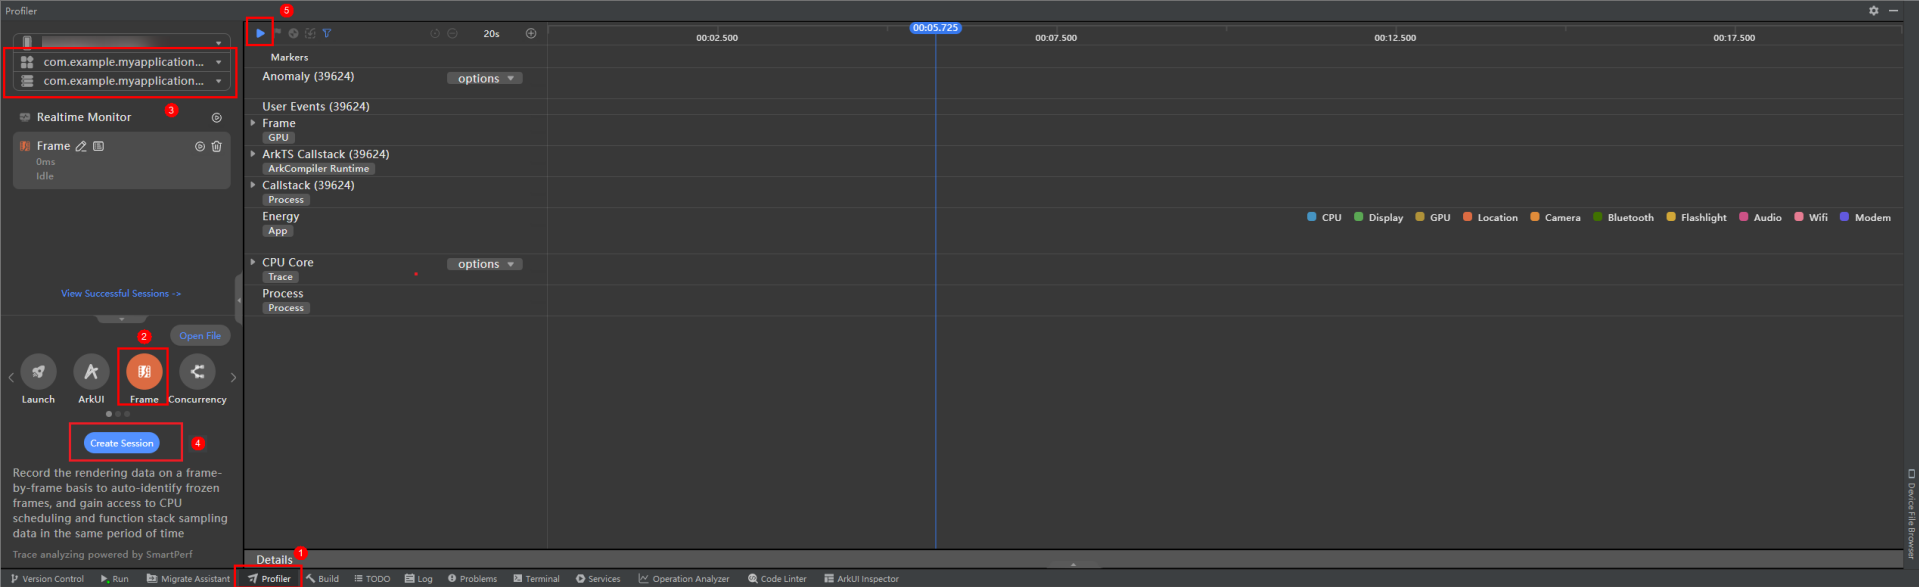
- Start the app, tap Profiler, select the Frame template, select the current app process, tap Create Session, and start to record the Frame Insight scenario data. During the recording, you can operate the app properly.Figure 2 Recording Frame Insight scenario data
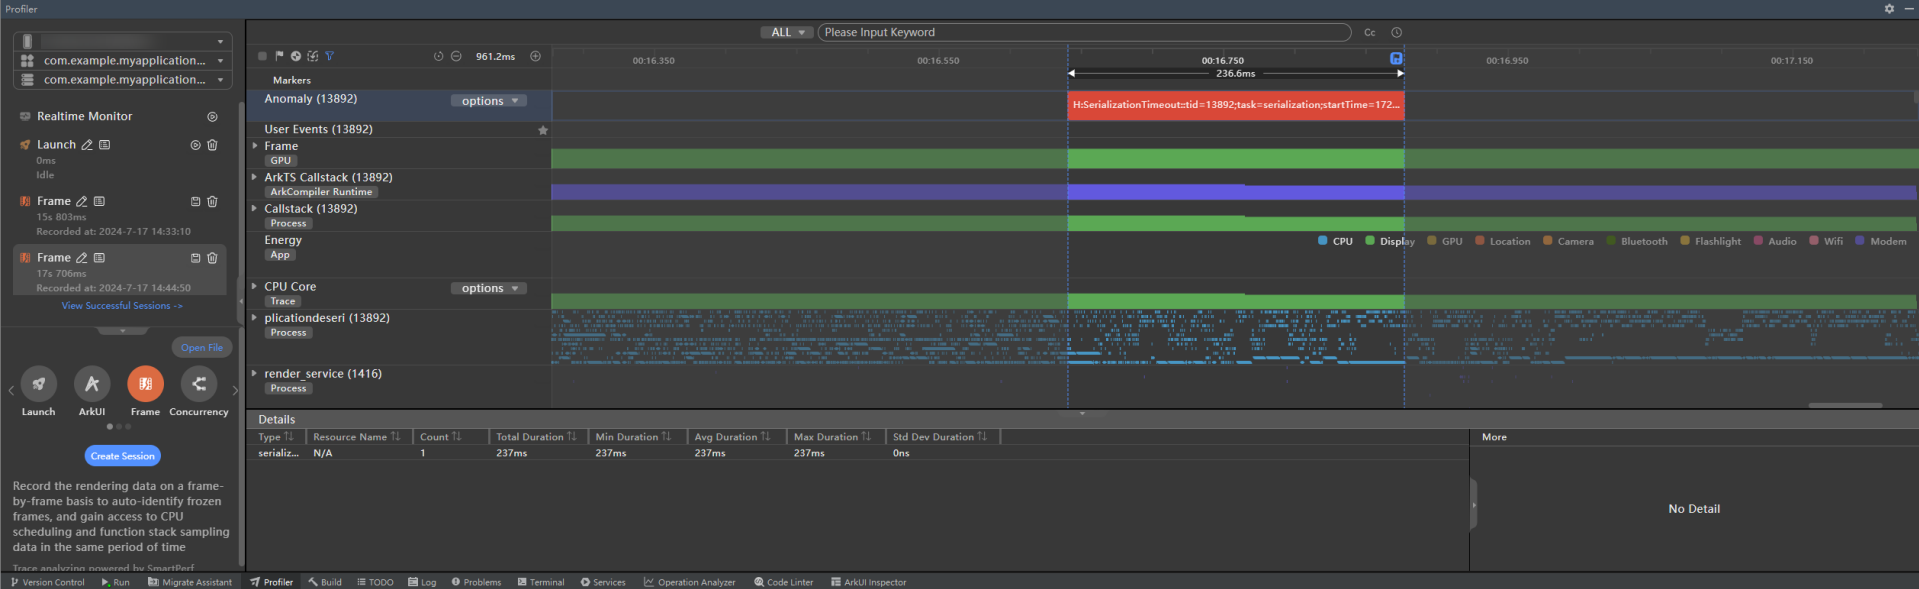
- Stop recording data. After the recording result is displayed, if the main-thread serialization and deserialization times out, the Anomaly lane displays the detection result of the traces for the time consumed in the serialization and deserialization, including the thread ID, start time, duration, and operation type.Figure 3 Main-thread serialization or deserialization timeout
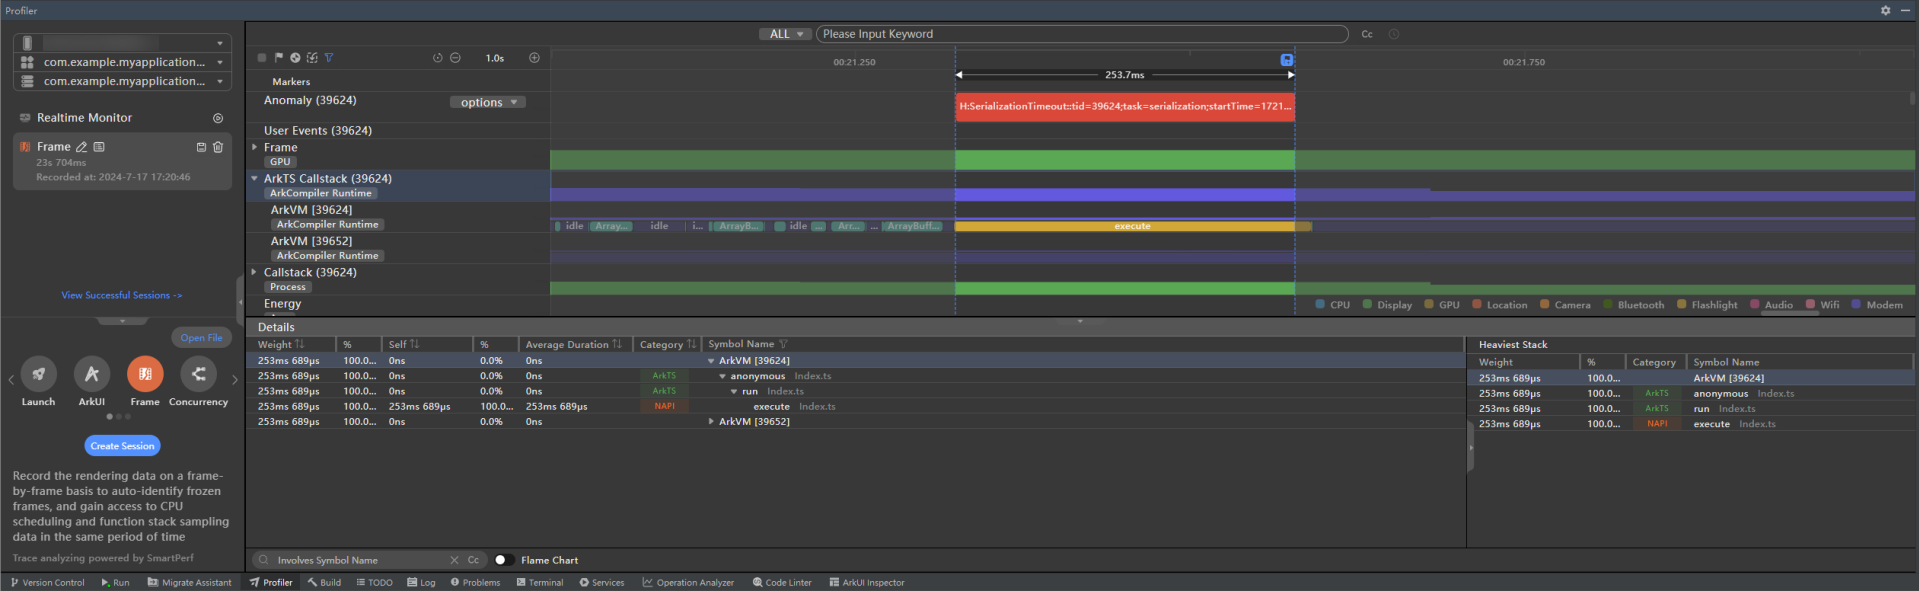
- Select the serialization and deserialization timeout period and tap ArkTS Callstack. The call stack information within this period is displayed. You can locate the call stack that takes a long time by viewing the Symbol Name information. You can double-tap the corresponding call stack to redirect to the corresponding source code.Figure 4 Call stack in the time-consuming phase of serialization or deserialization
- Quickly locate the source code that takes a long time to serialize or deserialize by using the method in step 4. In addition, you can optimize the source code by referring to the reconstruction of the Sendable object or communication data to further optimize the app performance.
Configuring the Serialization or Deserialization Threshold
- Open DevEco Studio and ensure that the device is connected and the app to be recorded has been installed.
- Start the app, click Profiler, select the Frame template, click options in the Anomaly lane, and enter the timeout threshold in the text box that is displayed.Figure 5 Configuring the serialization or deserialization threshold
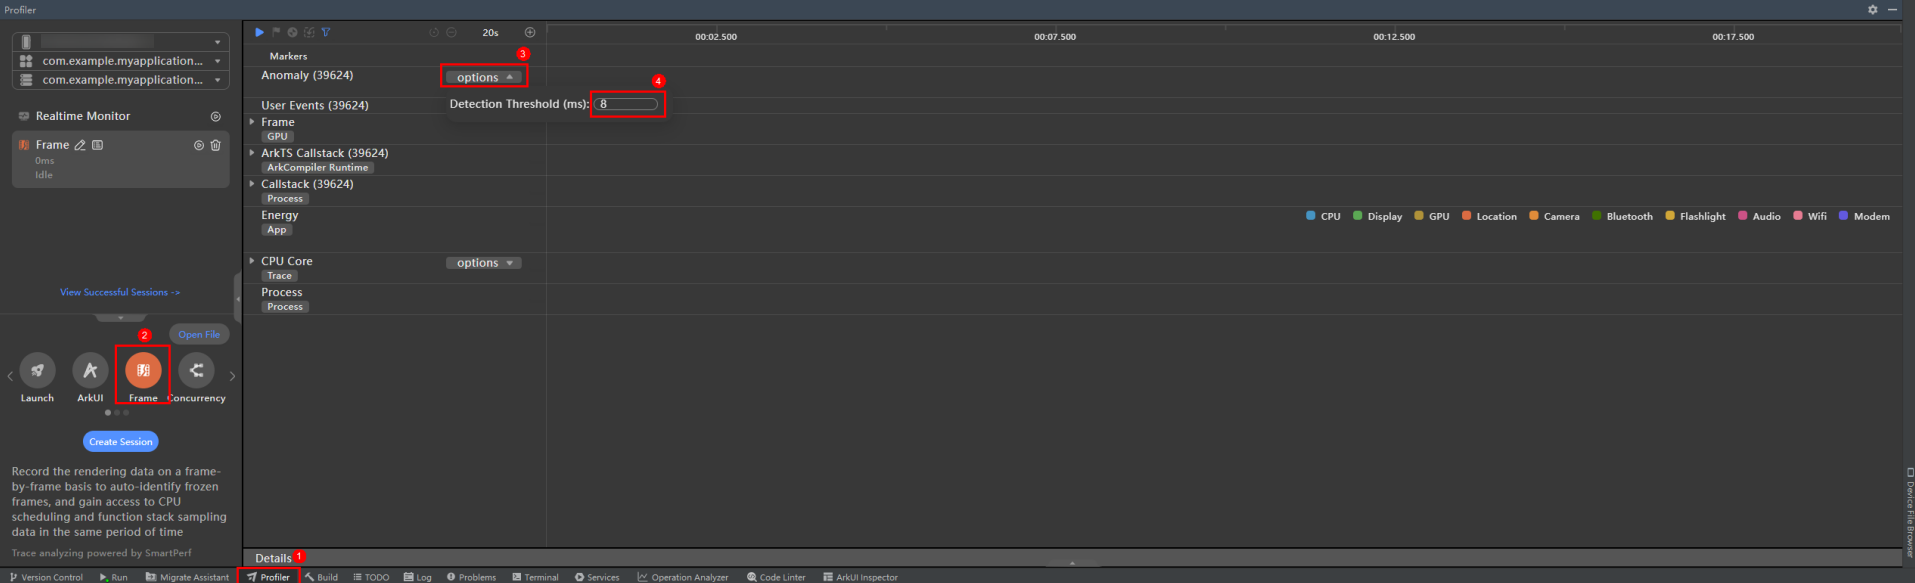
- Start recording data by referring to the preceding steps for detecting the serialization or deserialization performance. In this case, the new timeout threshold has been successfully set and used.
Case Analysis
During app development, serialization or deserialization occurs when a large amount of data is transmitted across concurrent instances. In this scenario, the time overheads will linearly increase with the amount of transmitted data. Especially when serialization or deserialization occurs in the main thread, the overall running performance and smoothness of the app will be compromised.
The Sendable object is passed by reference between different concurrent instances. Compared with serialization, the Sendable object has higher efficiency and can exchange data across instances more efficiently. This solves the problem of passing big data across concurrent instances and passing sample objects with member methods across concurrent instances. Taking a scenario where a book app transfers a large amount of book information across concurrent instances and stores the information in the database as an example, the following description shows how to use the timeout check tool to analyze and locate the time-consuming serialization point, and analyze and compare the time-consuming serialization results before and after the reconstruction of the Sendable object in this scenario. This case involves the following steps:
- Define a large number of book items (50,000 items in the example).
- Assemble the class instance of the book items.
- Use TaskPool to transfer data across concurrent instances and perform related database operations.
Generally, the information about a single book is defined as a class book. The instance is assembled to fill in the data. Finally, the BookDBInfo object that contains all book instances is transferred to the child thread through the TaskPool.
import { taskpool } from '@kit.ArkTS';
class Book {
  recordId_: string = '';
  title_: string = '';
  content_: string = '';
  authorList_: Array<string> | null = null;
  constructor() {
    // Initialize static information related to Book
    // ...
  }
  // omit other member methods
  // ...
}
class BookDBInfo {
  dbName_: string = '';
  seq_: number = 0;
  tableName_: string = '';
  books_: Array<Book> | null = null;
  constructor(dbName: string, tableName: string) {
    this.dbName_ = dbName;
    this.tableName_ = tableName;
  }
}
function prepareBooksInfo() {
  let dbInfo = new BookDBInfo('database1','books');
  dbInfo.books_ = new Array<Book>();
  for (let i = 0; i < 50000; i++) {
    let book = new Book();
    book.authorList_ = new Array<string>();
    // Assemble book information
    // ...
    dbInfo.books_?.push(book);
  }
  let res = taskpool.execute(doDBOperations, dbInfo); // Passing across concurrent instances through taskpool
}
@Concurrent
function doDBOperations(info : BookDBInfo) {
  // Perform database-related operations
  // ...
}
After the serialization timeout check tool is used to detect, the time consumed for serialization in the Anomaly lane exceeds the default threshold (8 ms) and reaches 260 ms.

Tap the ArkTS Callstack lane and select the duration of the serialization and deserialization timeout. You can locate the prepareBooksInfo method in the Index.ts file that is being executed based on the Callstack information. The pseudocode shows that the taskpool.execute method is called, the dbInfo object is transferred to the child thread, which triggers the main-thread serialization and deserialization processes.
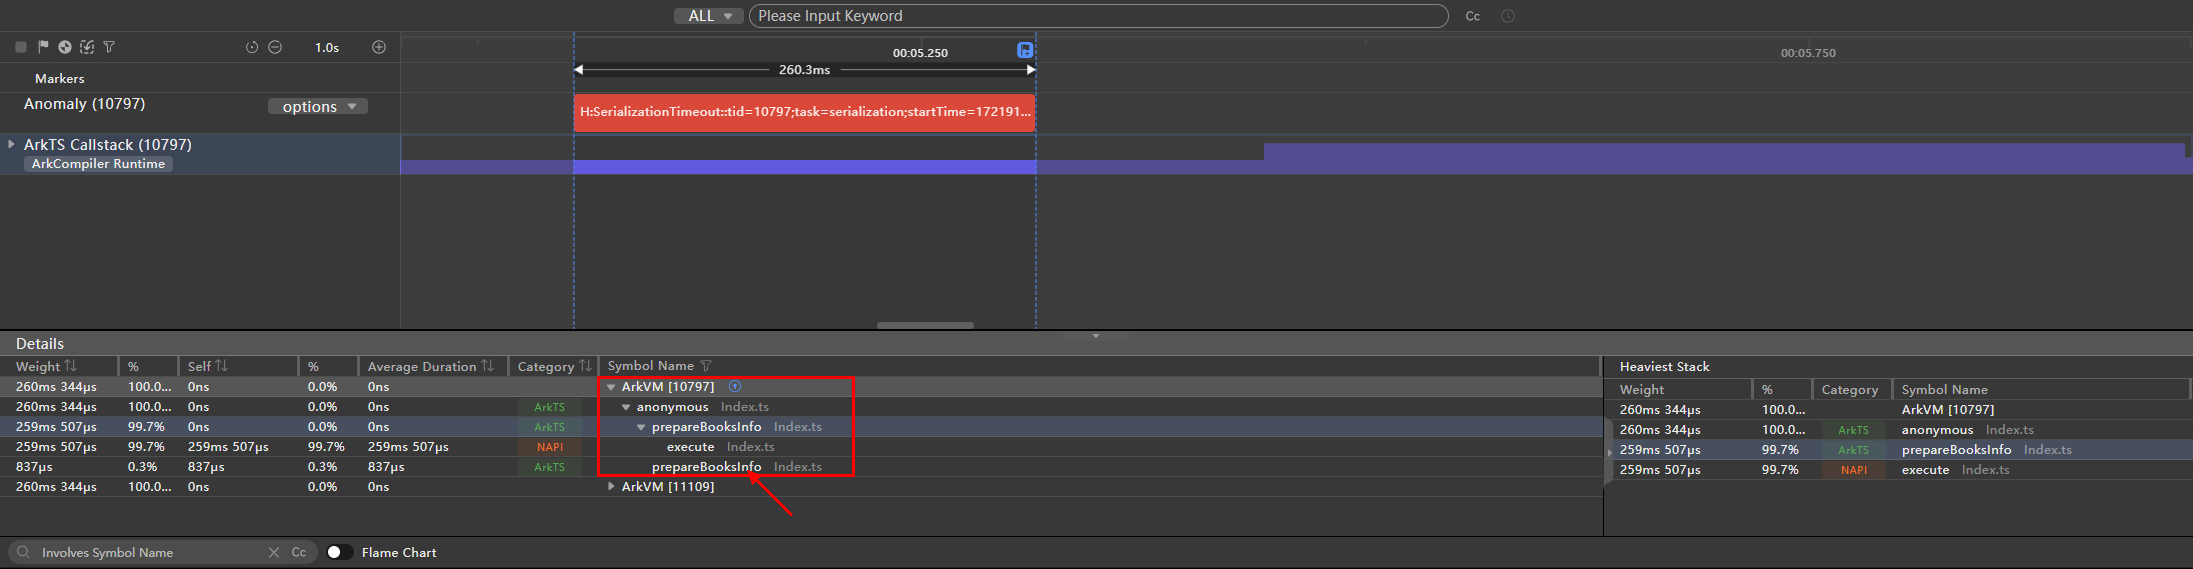
To solve the serialization timeout problem in this scenario, after the Sendable Development is performed on the class related to the dbInfo object in the preceding example, a single book type is defined as Sendable, and the member property is of the Sendable type.
After the optimization, the serialization timeout check tool is used to detect the recording. It is found that the time consumed by serialization is less than the default threshold (8 ms), and there is no timeout trace point in the Anomaly lane.

Table 3 Comparison between the serialization duration
Implementation Solution | Duration |
Sendable is not used. | 260 ms |
Sendable is used. | < 8 ms |
According to the comparison and analysis of the serialization duration obtained before and after the optimization, the Sendable reference transfer mode can effectively shorten the serialization time and improve app performance when a large amount of data is transmitted across threads.
Based on the practice cases, the serialization timeout check tool can effectively detect the time-consuming serialization or deserialization in the main thread of an app, helping you locate the time-consuming serialization point. In addition, the check tool can be used with code reconstruction, such as Sendable Development or reconstruction of communication data, to overcome the performance issue of cross-thread serialization or deserialization.