Overview
The loading completion latency of a web page refers to the time when a page request is sent until the page viewport content is completely loaded. It is recommended that the latency fall below 900 ms. A shorter loading latency enables timely page loading response. This topic describes the web page loading process, key trace points, performance analysis tools, and methods for analyzing the loading latency. In addition, the causes and solutions of long loading latency are provided.
Web Page Loading Process
The web page loading process includes web component initialization, HTML and CSS file parsing after the corresponding web page resources are requested, and JS script execution to build a render tree. In addition, the network process downloads other resources in parallel. Then, the system performs layout calculation based on the render tree to determine the size and position of each element on the page, the geometric information is converted into pixel information through rasterization and then composited for display. The following figure shows the corresponding lane.
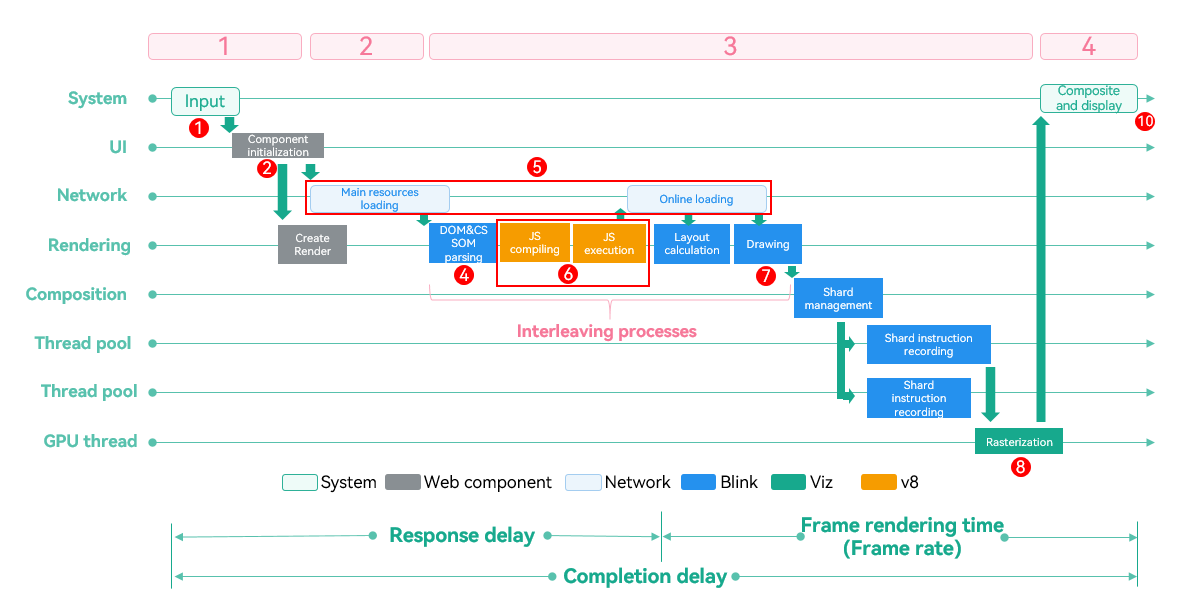
No. | Web Page Loading Process | Key Trace |
|---|---|---|
① | Tap event | From the last DispatchTouchEvent to the component initialization. |
② | Web component initialization | From H:NWebImpl | CreateNWeb to the time before the navigation process |
③ | Navigation process | From NavigationControllerImpl::LoadURLWithParams to the end of NavigationBodyLoader::OnStartLoadingResponseBody. |
④ | DOM and CSSOM parsing | CSSParserImpl::parseStyleSheet and ParseHTML, excluding HTMLDocumentParser::RunScriptsForPausedTreeBuilder. |
⑤ | Waiting for downloading network resources | Before ThrottlingURLLoader::OnReceiveResponse of the main render thread. |
⑥ | JS compilation and execution | EvaluateScript and v8.callFunction. |
⑦ | Rendering | ThreadProxy::BeginMainFrame, excluding v8.callFunction. |
⑧ | Rasterization and synthesis | From the start of ProxyImpl::NotifyReadyToCommitOnImpl to the end of SwapBuffers. |
⑨ | End of a touch event response | NotifyFrameSwapped, UnloadOldFrame or the first SkiaOutputSurfaceImplOnGpu::SwapBuffers. |
⑩ | End of a completion latency | The last SkiaOutputSurfaceImplOnGpu::SwapBuffers. |
[h2]DevEco Profiler
Provided by DevEco Studio, DevEco Profiler is a scenario-specific tuning tool that allows you to check the loading completion latency of a web page. For details about how to use DevEco Profiler, see Introduction to DevEco Profiler. For details about how to determine the loading completion latency, see Using DevEco Profiler to Check the Loading Completion Latency of a Web Page.
[h2]DevTools
DevTools is a web frontend development and debugging tool that allows you to debug an application's frontend pages on a PC. For details about how to use DevTools, see Debugging Frontend Pages by Using DevTools.

- Check whether a delay occurs when a Web component is completely loaded. This can be done by using DevEco Profiler or a screen recording tool. If a delay occurs, continue to analyze the logic.
- Identify key performance bottlenecks: Use DevTools to analyze key lanes and their key performance issues, and learn about the time consumption of the program.
- Select a proper optimization policy based on the issue. Use an appropriate optimization method to tackle the time consumption of the program.
- Check the optimization effect. Capture the trace again after the optimization and check whether the loading completion latency is within 900 ms. If the objective is not achieved, try from other aspects.
[h2]Using DevEco Profiler to Check the Loading Completion Latency of a Web Page
- Use DevEco Profiler to capture the trace and determine the start and end points based on the scenario.
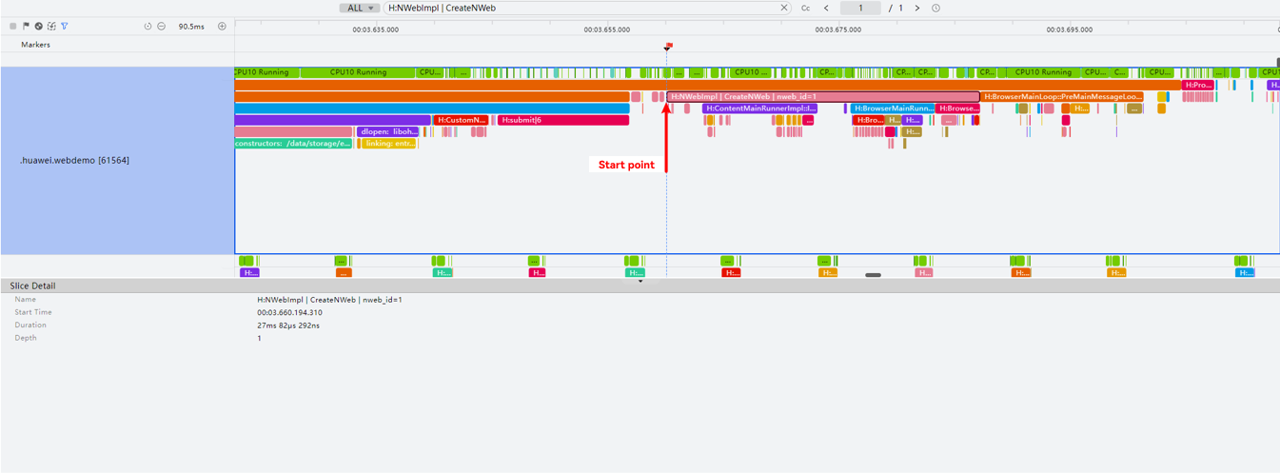
- Determine the start point of the web loading completion latency trace. Tap to switch to a new web page. Use DispatchTouchEvent, type=1 as the start point. The initialization loading of the web page starts with H:NWebImpl | CreateNWeb. This trace point is located in the application's main thread lane, which is responsible for the main logic of the application, receiving multimodal signals, generating frames, and distributing sub-signals. It corresponds to the red flag shown in Figure 3.Figure 3 Web page initialization start point
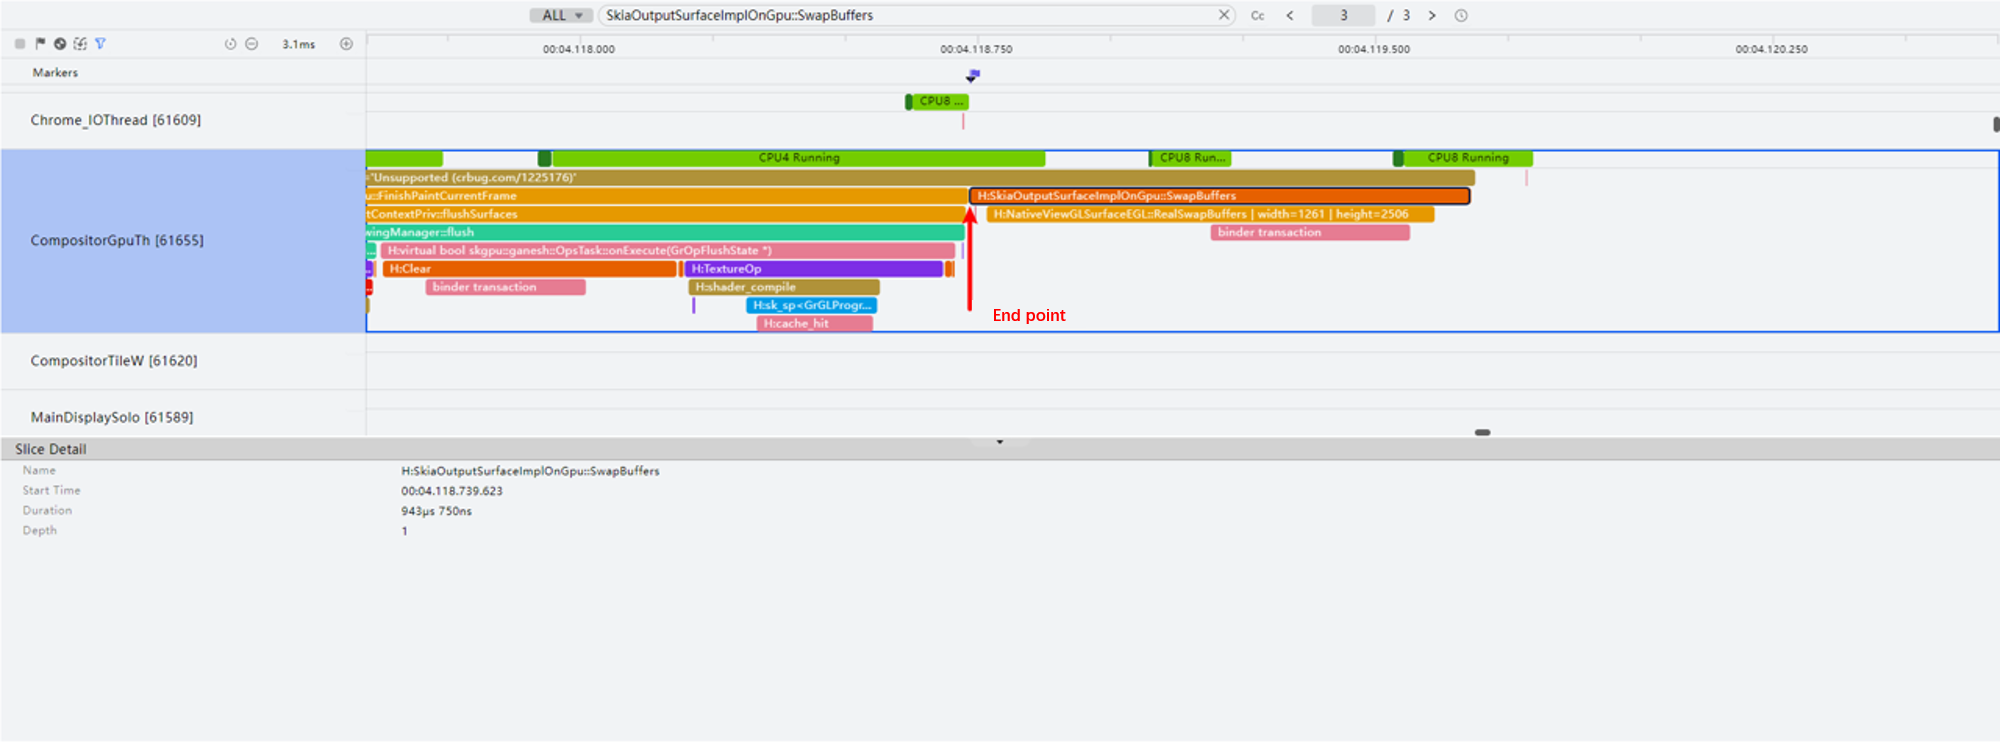
- Determine the end point of the web loading completion latency trace. The last SkiaOutputSurfaceImplOnGpu::SwapBuffers is the end point. This trace point is located in the CompositorGpuTh lane, which is responsible for GPU rasterization, generates signals, and sends them to the graphics subsystem for rendering. It corresponds to the purple flag shown in Figure 4.Figure 4 Web page initialization end point
- Determine the start point of the web loading completion latency trace. Tap to switch to a new web page. Use DispatchTouchEvent, type=1 as the start point. The initialization loading of the web page starts with H:NWebImpl | CreateNWeb. This trace point is located in the application's main thread lane, which is responsible for the main logic of the application, receiving multimodal signals, generating frames, and distributing sub-signals. It corresponds to the red flag shown in Figure 3.
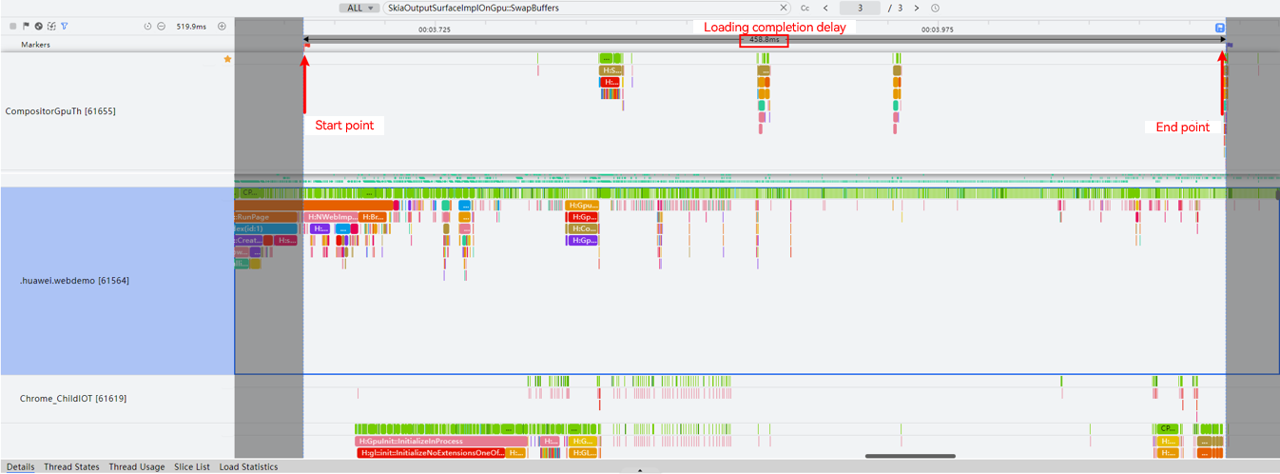
- Zoom out the trace graph, find the start and end points, and select the trace graph within the range from the start point to the end point. In this way, you can view the loading completion latency of the current web page. If the loading completion latency in the area exceeds 900 ms, use DevTools for profiling.
[h2]Using DevTools to Analyze Time-Consuming Areas
You can record traces on the Performance tab page of DevTools and analyze the recorded traces. The analysis process is as follows:
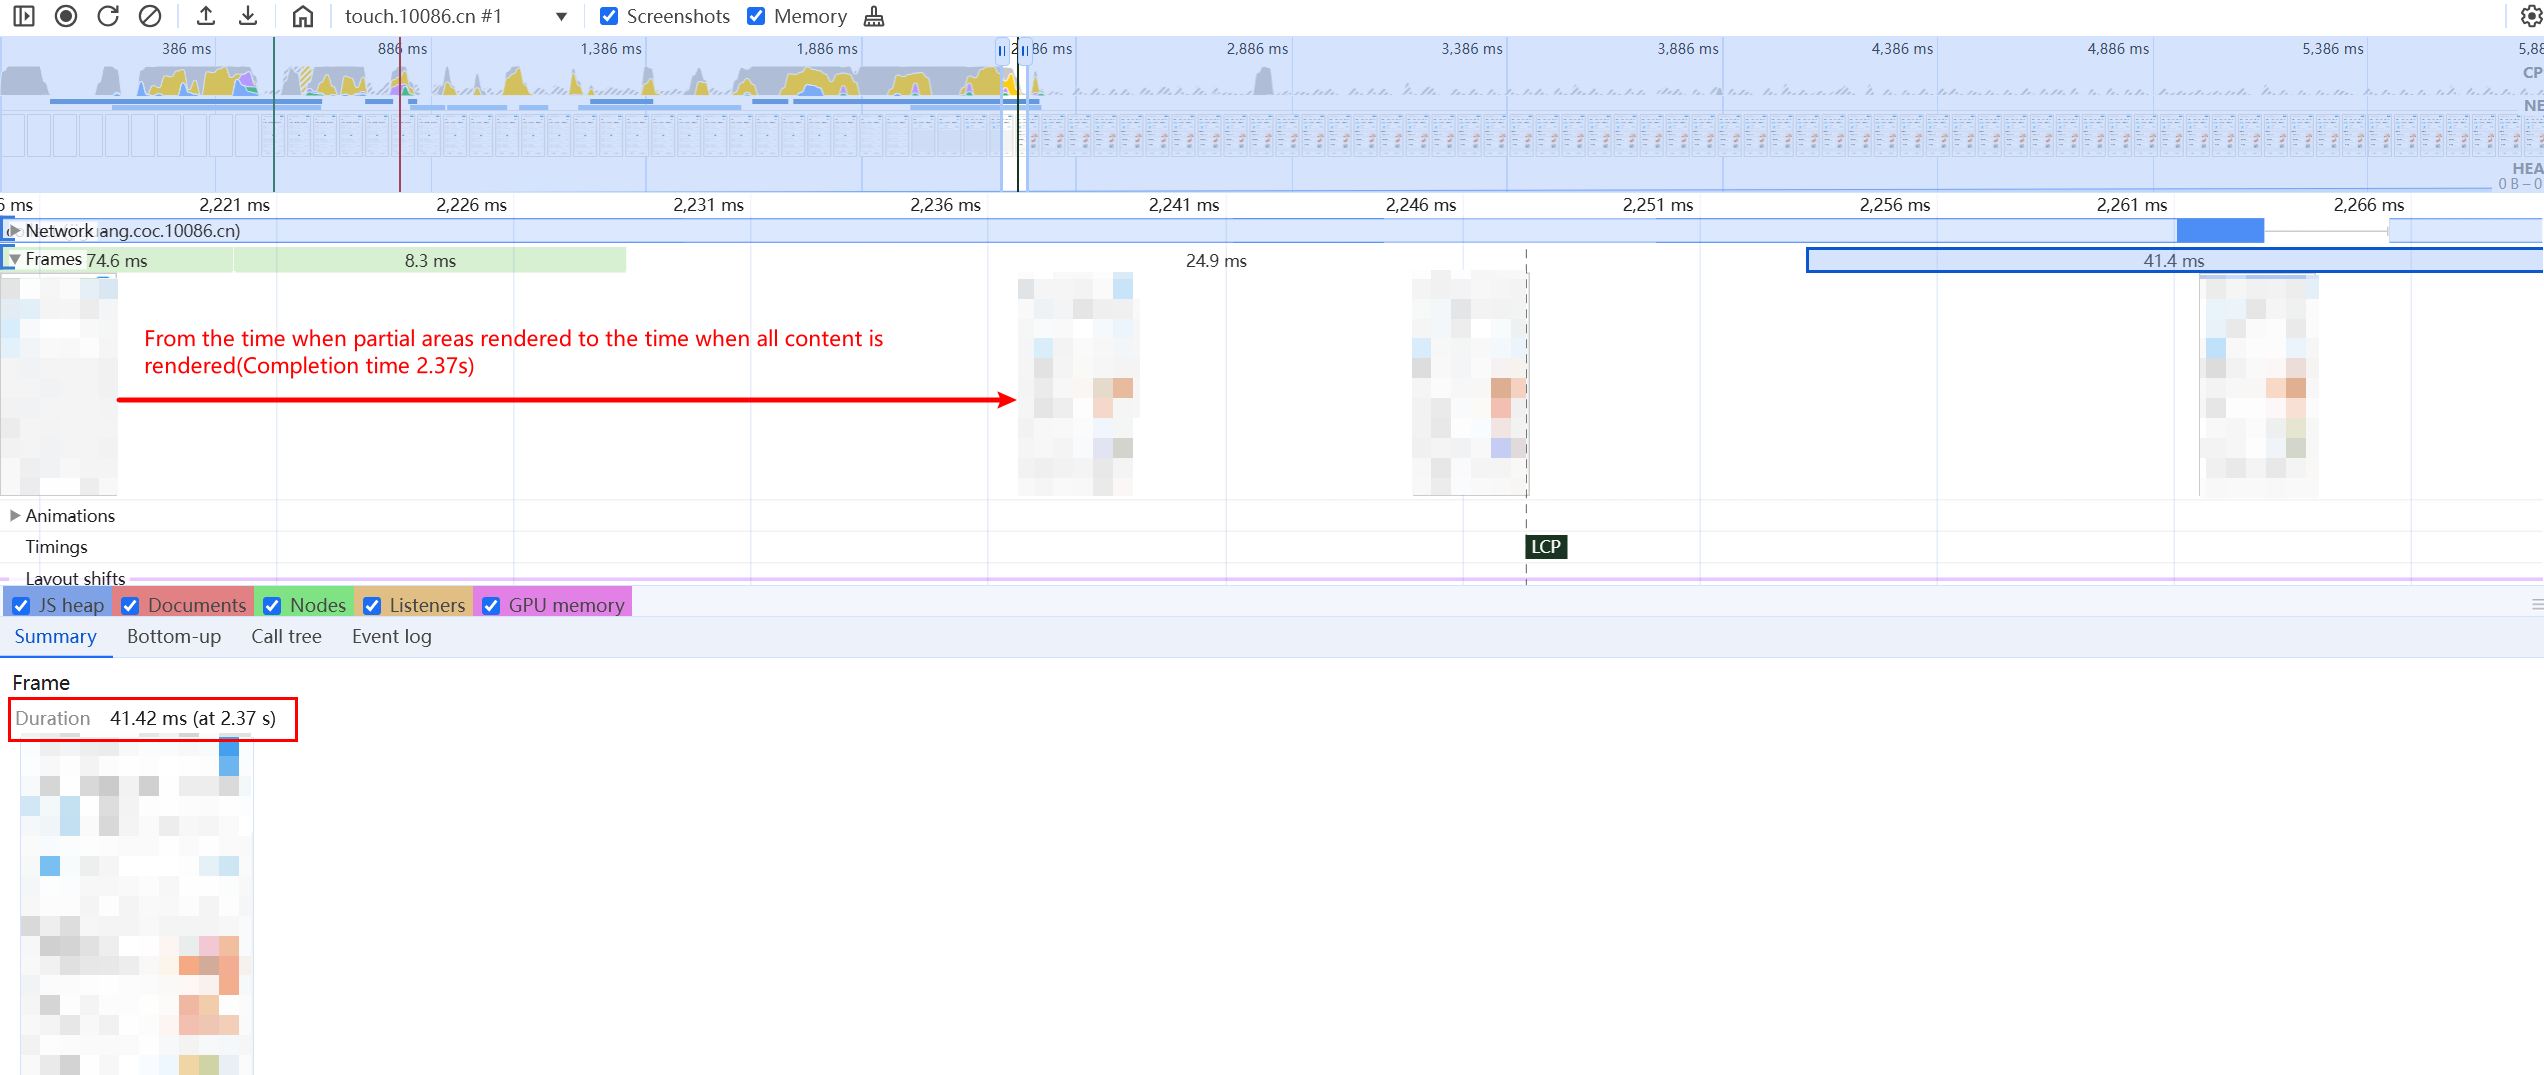
- Determine the start and end points of the lane. The start point is on the yellow dotted line (that is, at 0 ms), and the end point is after the viewport content is completely rendered on the screen.Figure 5 Determining the start point of the lane
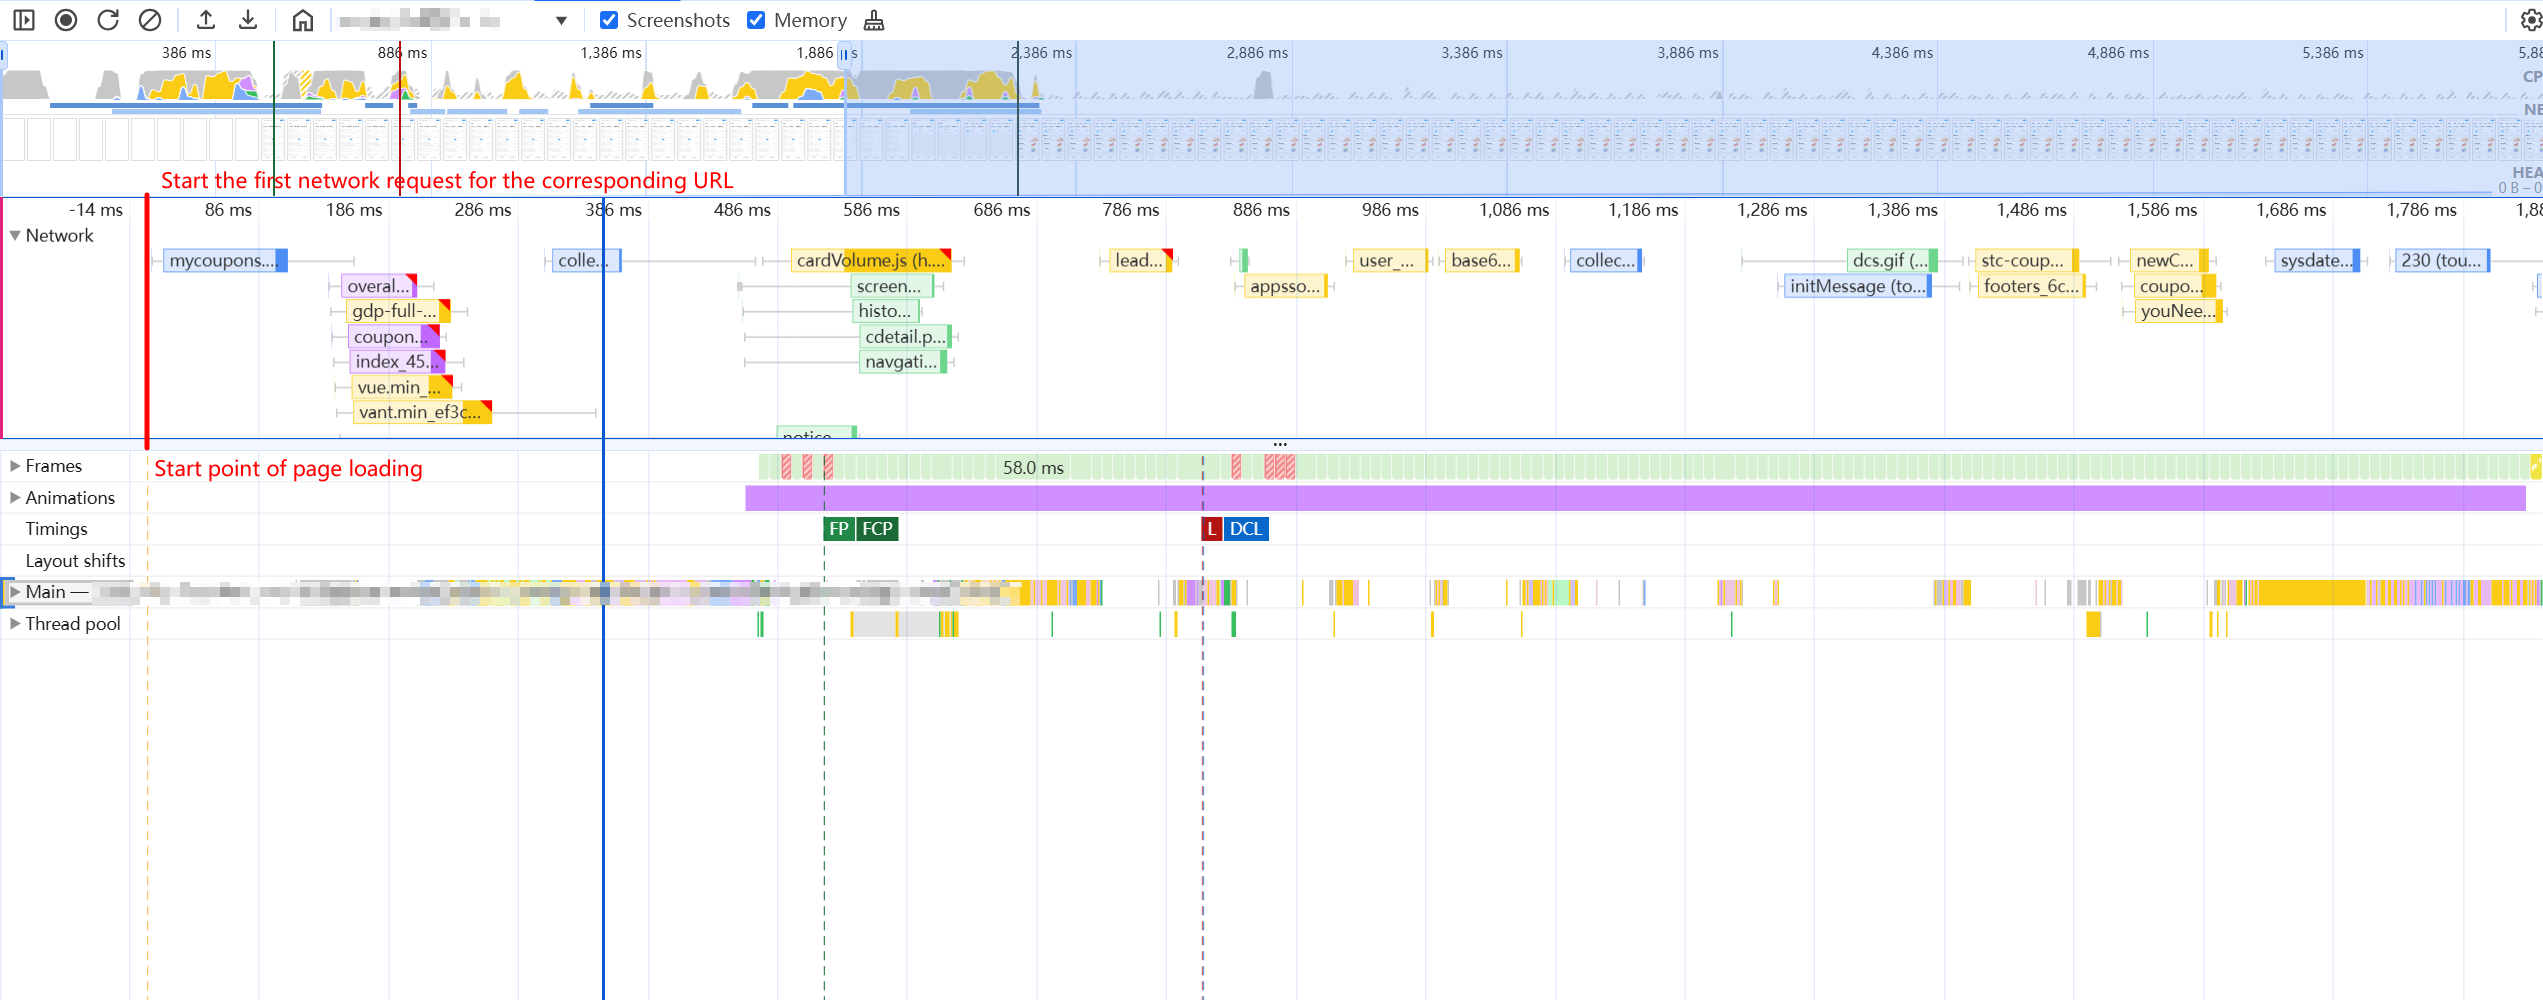 Figure 6 Determining the end point of the lane
- View the common lanes. DevTools provides multiple lanes for analyzing performance data. The following figure shows common lanes.
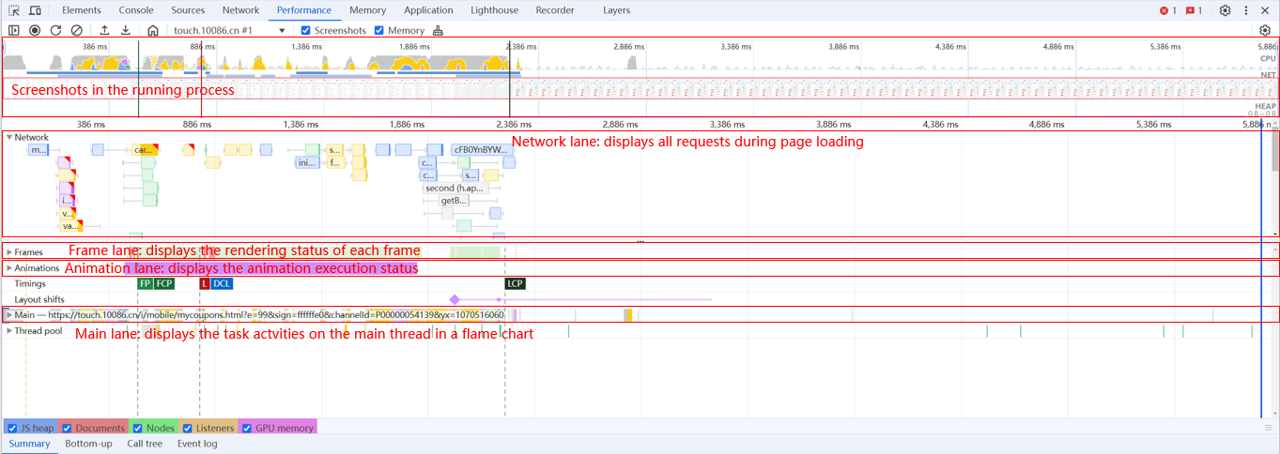 The loading completion latency of the web page mainly takes place during static resource requests and main thread task execution. Pay attention to the following lanes:
- Main lane: displays the task activities on the main thread, including script execution, style calculation, layout, and drawing.
- Network lane: displays all network requests sent during page loading, helping you analyze the page loading performance and find the resources that are loaded slowly for optimization.
- Frame lane: displays the rendering status of each frame, including the frame rate and rendering time. Frame freezing and frame loss can be detected.
- Animation lane: displays the animation execution status.
- Analyze the web page loading phase and check whether there are common issues in each phase.
[h2]Root Cause Analysis and Optimization Methods for Exceptions in Each Phase
The following describes the area division based on the web page loading process, and the phases where common issues occur and the corresponding solutions.
DOM and CSSOM parsing (analyzing the Main lane)
Troubleshooting
- Page rendering is blocked, which is usually caused by synchronous JS loading. You need to understand the source code and use asynchronous loading or lazy loading to load the JS script in the code.
- The CSS file is loaded slowly and the content has no style or the page flickers. During page rendering, the page is first displayed without styles and then slowly displays styles, or the page content changes quickly and unstably. To solve these problems, you can embed CSS into HTML to reduce the number of external CSS requests, compress CSS files, use CDN to accelerate file loading, or use cache.
- In addition to the preceding optimization solutions for special problems, there are other common optimization solutions, such as Prerendering and Same-Layer Rendering.
Downloading network resources (analyzing the NetWork lane)
Troubleshooting
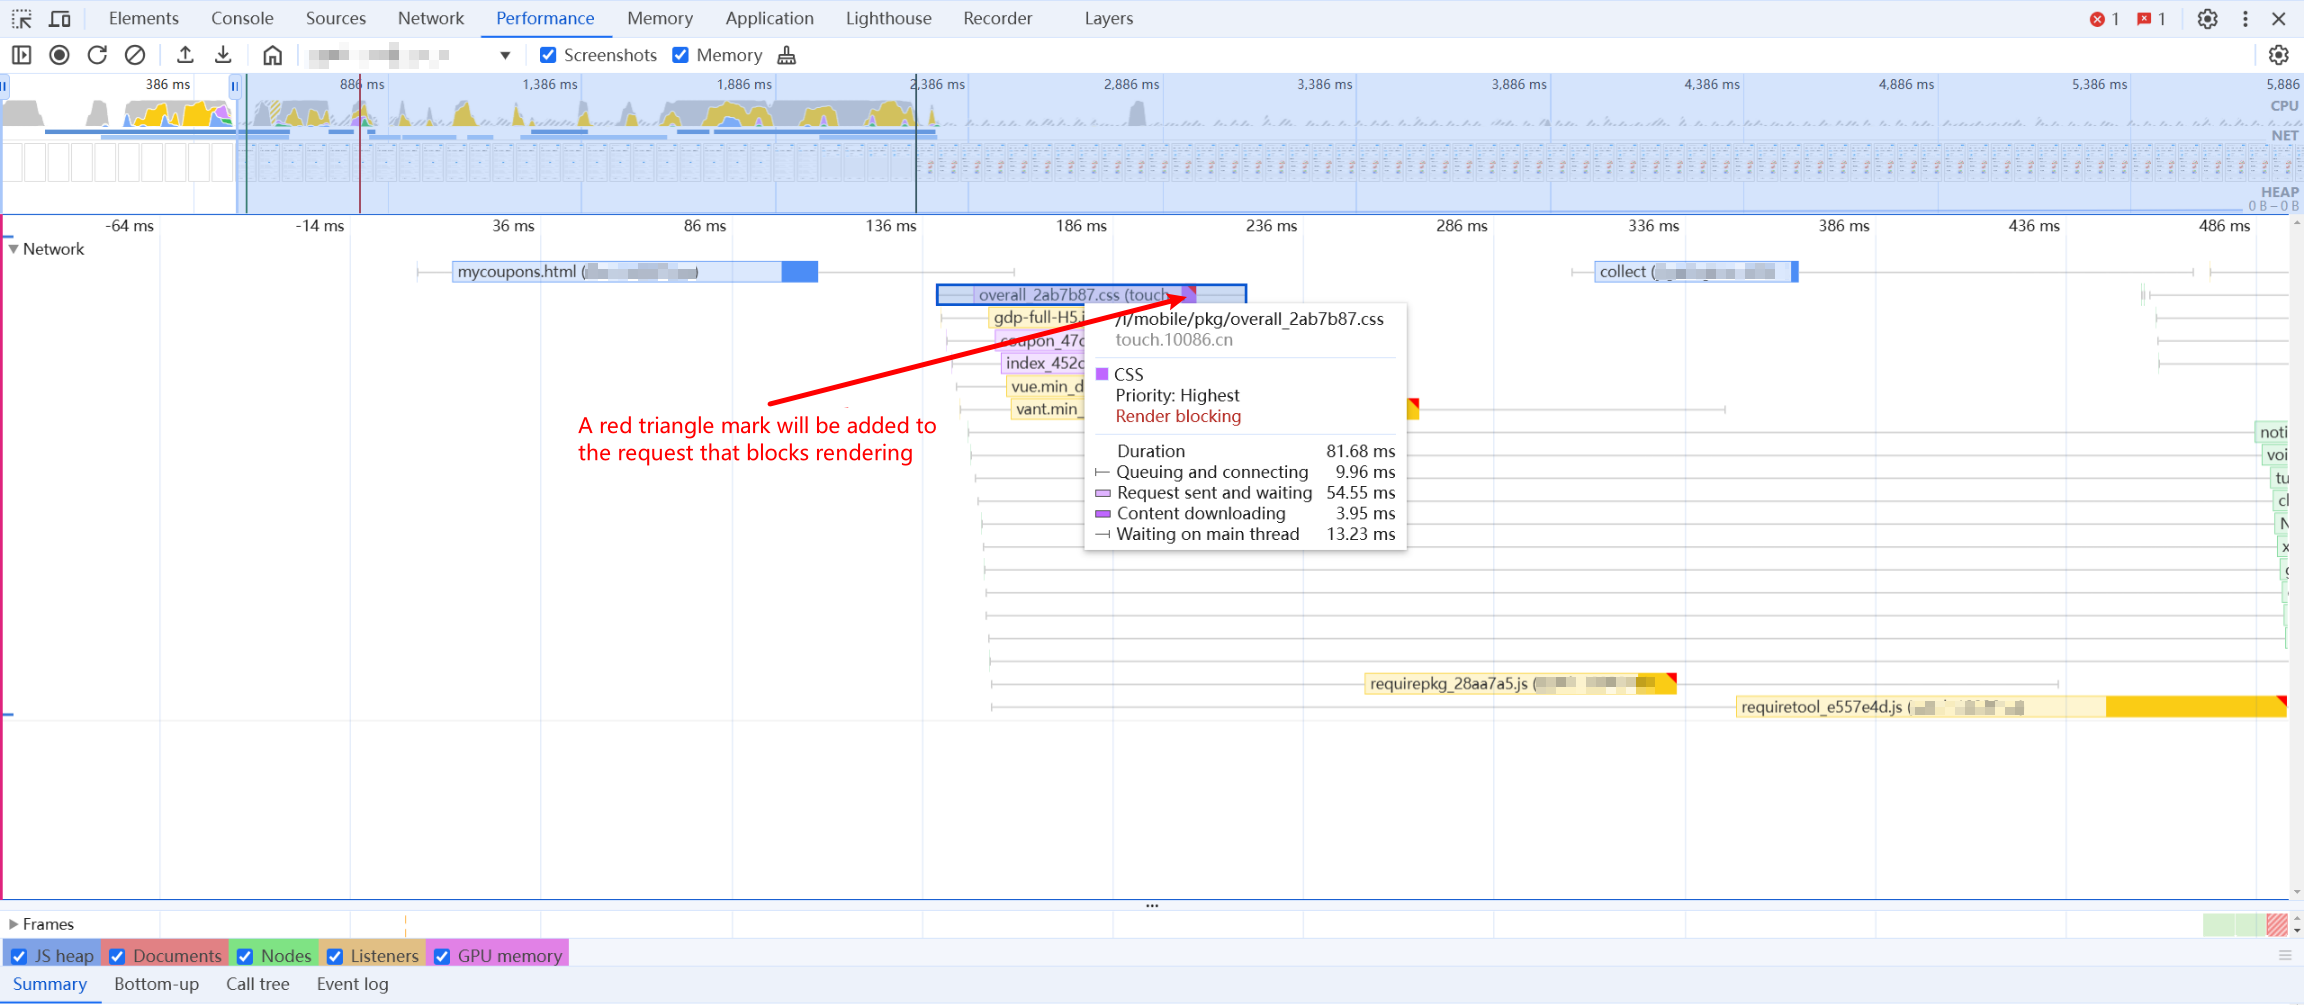
- Some network requests block UI rendering, causing slow loading of key resources. The service side needs to analyze and optimize key requests that affect the page loading latency based on the page display requirements, for example, using CDN and prefetching POST requests.Figure 7 Trace graph of UI rendering blocked by network requests
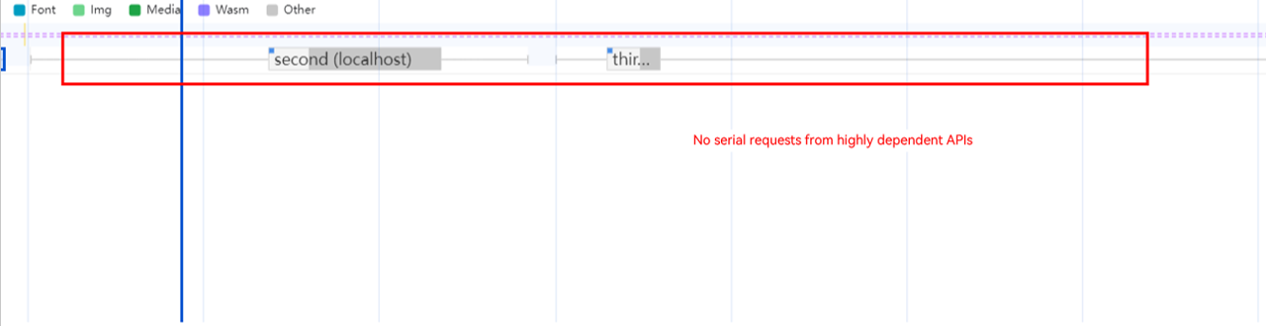
- There are excessive network requests, slow server response, or serial requests from non-highly-dependent APIs. In this case, you use any of the following optimization schemes:
- Use lazy loading to reduce the file size and improve the loading speed.
- Combine and compress resource files such as CSS and JS, reducing the number of requests.
- Use browser cache and CDN to cache static resources, reducing unnecessary requests.
- Use lazy loading for non-first screen content or content that needs to be loaded only after user interaction to reduce the number of initial requests.
Figure 8 Trace graph of excessive network requests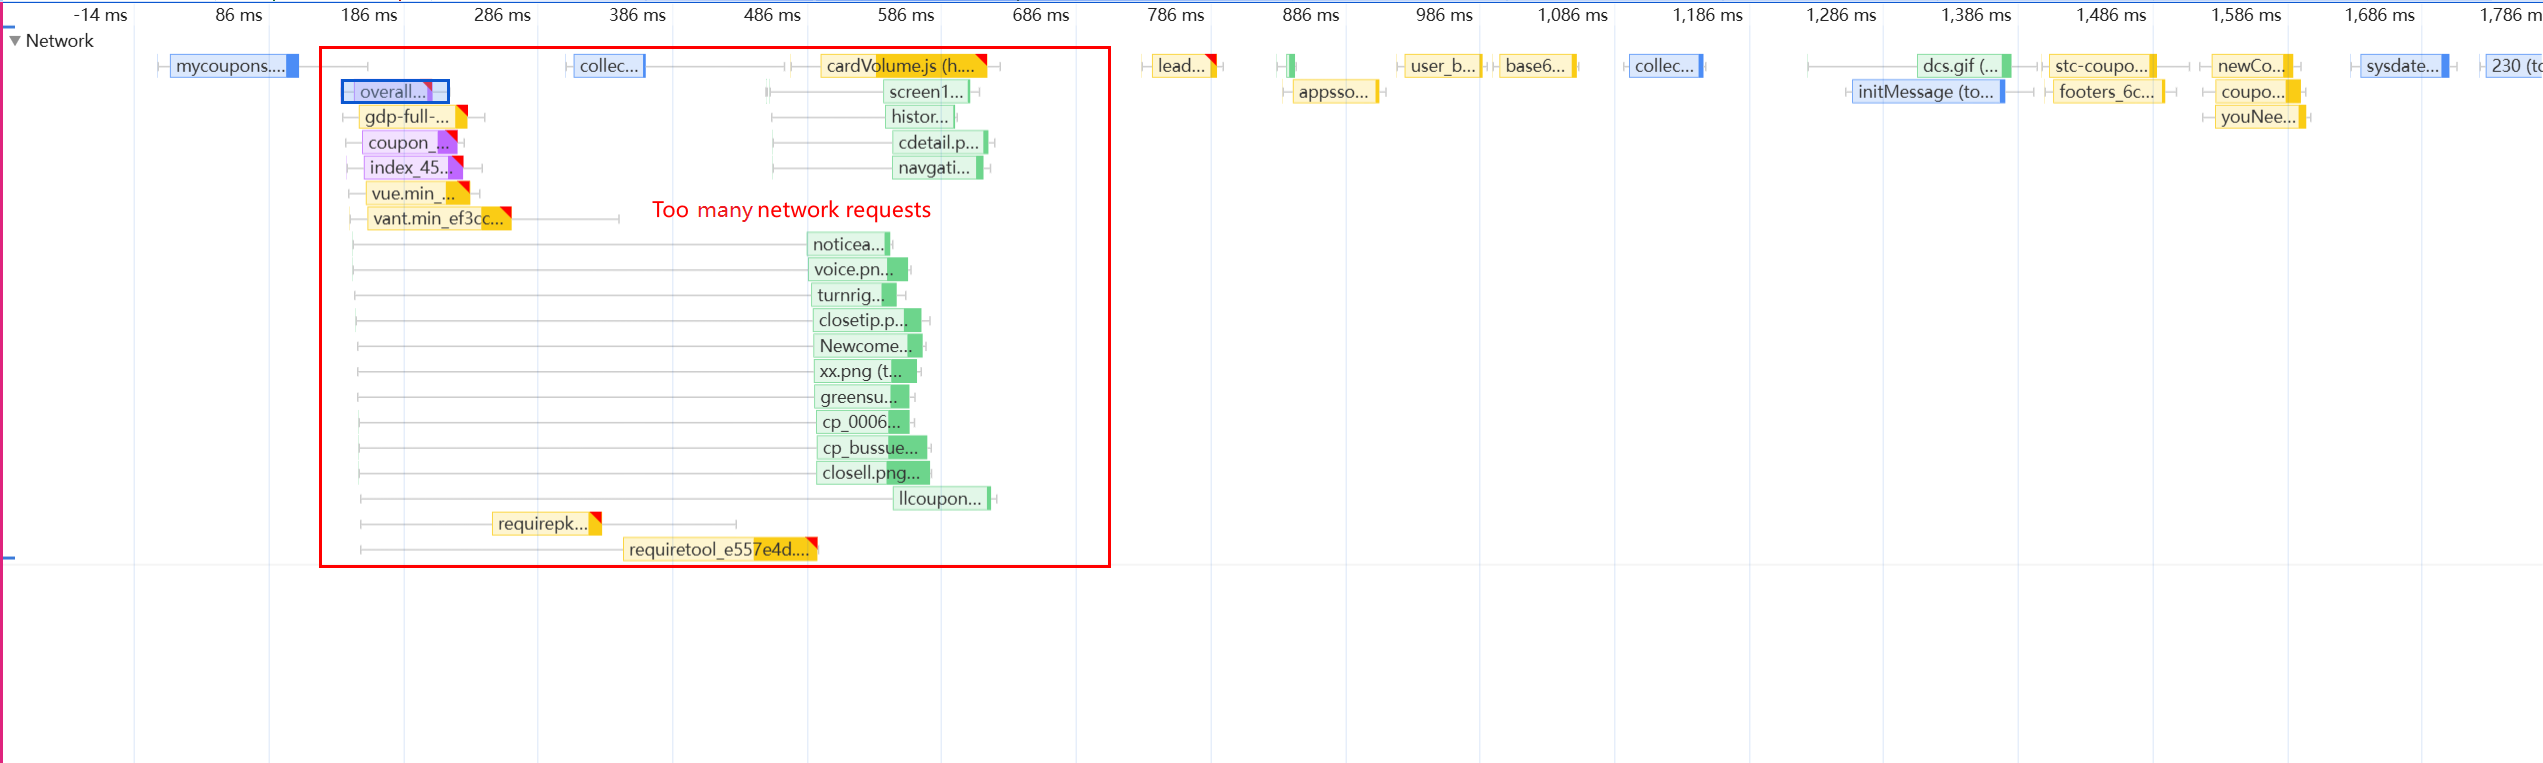 Figure 9 Trace graph of the server responding to network requests too slowly
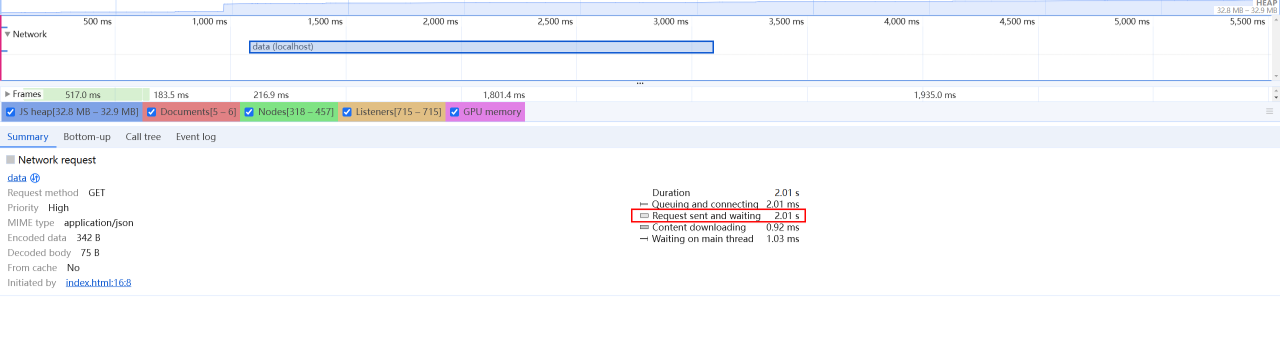 Figure 10 Trace graph of serial requests from non-highly-dependent APIs
JS compilation and execution (analyzing the main lane)
Troubleshooting
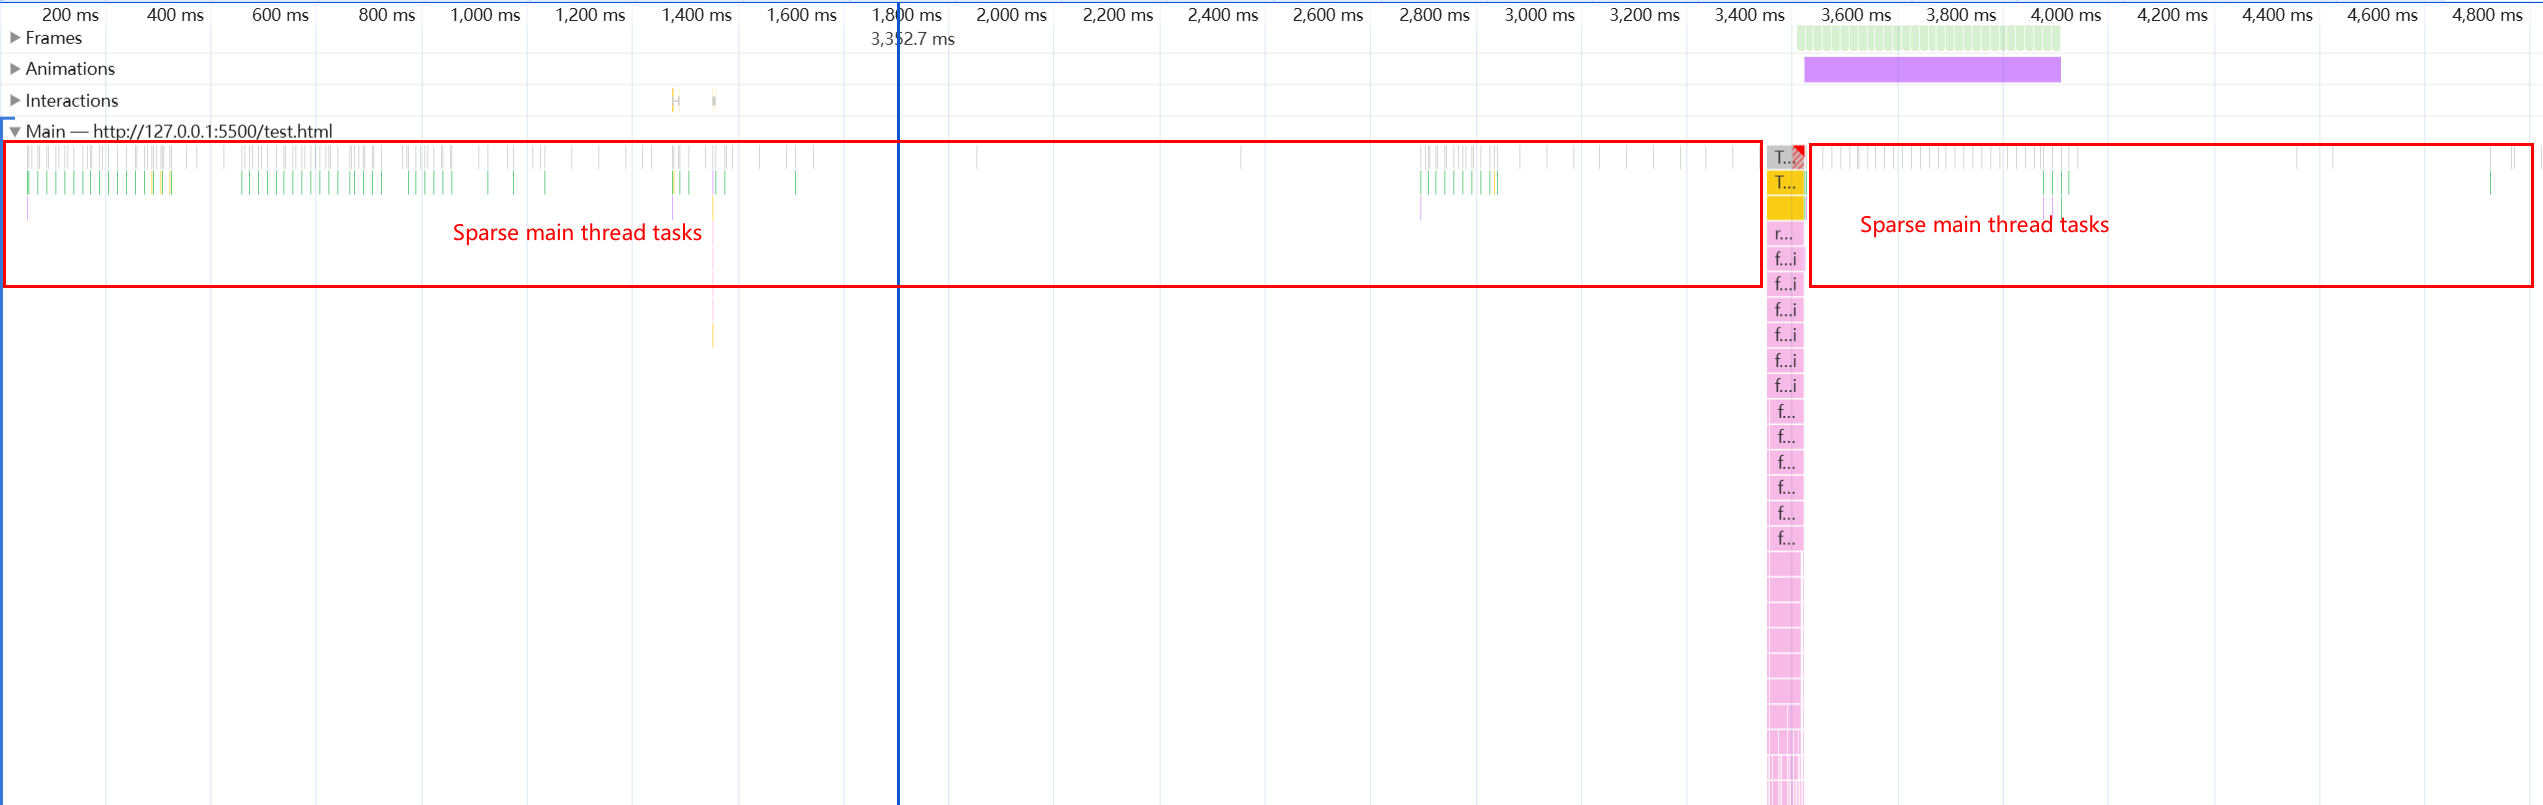
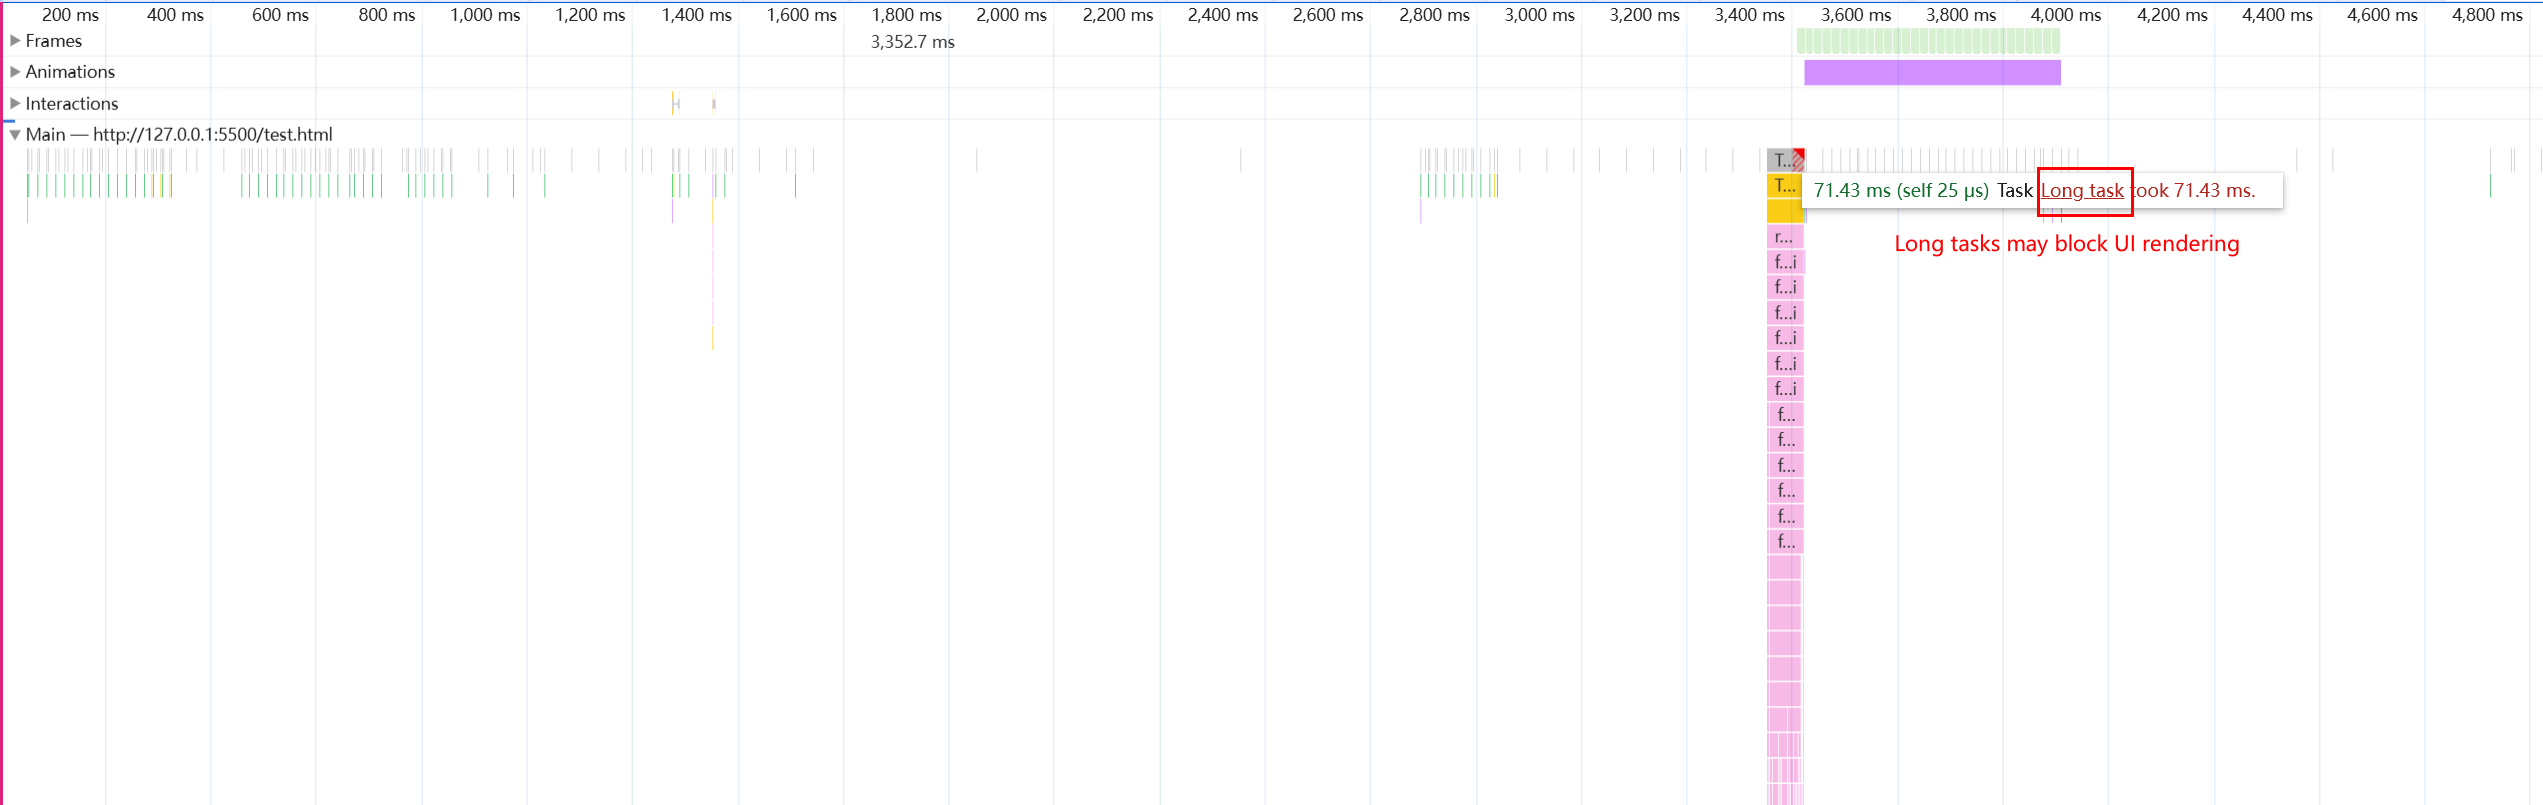
- The main thread has sparse tasks and frequent task switching and context switching occur. As shown in the following figure, sparse tasks are executed in the red box, and task execution exists on the right of the red box. This indicates that the main thread task execution in this area is blocked by other factors, typically such as slow network requests or timers. You are advised to check the network requests within the time range corresponding to the blank area to determine whether the network requests are slow.
- UI rendering is blocked due to long tasks. When a JS script is executed, HTML parsing is blocked. As a result, a blank screen is displayed or unrendered content is displayed. The script execution takes a long time possibly due to the large size of the script or high complexity of the algorithm. You need to check the script content and delay unnecessary script execution to preferentially ensure that the content in the viewport is loaded. Typically, you can choose to precompile JavaScript files to generate bytecode cache, reduce redundant JS code, delay execution of unnecessary JS code, and use code segmentation to load only code required by the current page.
[h2]Case 1
Symptom
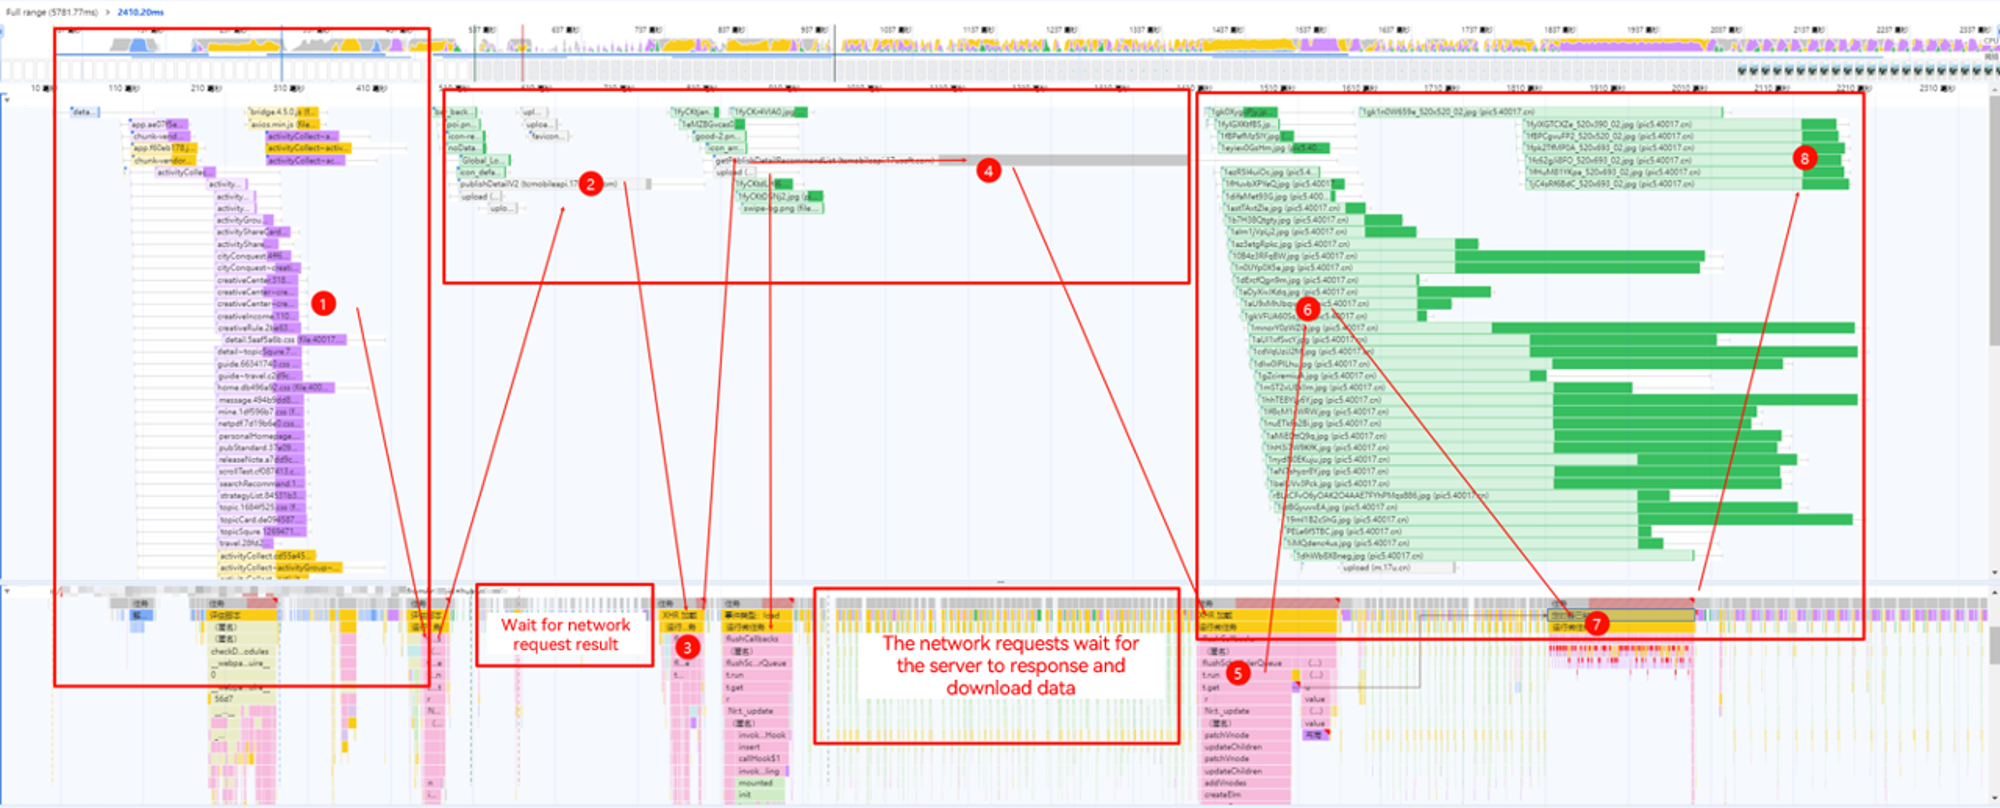
The loading completion latency of an application details page is 2351 ms, which far exceeds 900 ms.
Issue Trace
Loading Process Analysis
The numbers in the figure indicate the sequence of the page loading process. After the application requests the web page address, the network resource download (network lane in area ①) starts. A large number of resource file requests are sent in the network lane, and the page remains blank (as shown in the page screenshot area). This indicates that there are too many concurrent network requests during initial page resource loading on the application side. The requested resources are executed on the main thread (main lane in area ①). During the execution, a network request is sent to the API in area ②, and the publishDetailV2() API takes a long time. After the request is complete, the callback is executed (main lane in area ③). Then, the callback initiates a network request (network lane in area ④), and the getPublishDetailRecommendList() API also takes a long time. After the request is executed, the corresponding callback is executed (main lane in area ⑤), and then a large number of network requests are triggered (areas ⑥ and ⑧).
Root Cause
- During initial loading, a large number of CSS and JS files are loaded, which takes about 530 ms (area ①).
- There are some API serial requests from publishDetailV2() and getPublishDetailRecommendList() in area ②, and the main thread tasks are sparse, as shown in the flame graphs of the main area in areas ② and ④.
- The network waiting time and content download time of getPublishDetailRecommendList() are too long because a large amount of data is loaded at a time (area ④).
- A large number of images (green areas in the network lane) are loaded, and the serial loading of images is time-consuming (areas ②, ④, ⑥ and ⑧).
Optimization Solution
- Combine and compress JS and CSS files based on service requirements to reduce the number of network requests and file sizes. Check the code, remove unnecessary CSS and JS files loaded on the splash screen, and delay the loading time of these files.
- Prefetch POST network requests. Call publishDetailV2() and getPublishDetailRecommendList() in advance.
- Load the requests from getPublishDetailRecommendList() by page and load a fixed amount of data at a time.
- Optimize the logic for loading images on the page component and determine whether all image resources need to be loaded on the splash screen based on the service logic.
- For the header banner component, load the subsequent images only after the first image is displayed.
- Use a placeholder image for the bottom list component, which allows images to be loaded during scrolling.
- Other common optimization solutions:
- Start the rendering process in advance by pre-rendering web pages.
- Use CDN to accelerate requests for static resources, including images and script files.
- Optimize the web cache by about 200 ms. This page is a module details page. The CSS and JS of the page layout are fixed. HTML, CSS, and JS can be cached locally so that the loading latency can be shortened when the page is opened later.
[h2]Case 2
Symptom
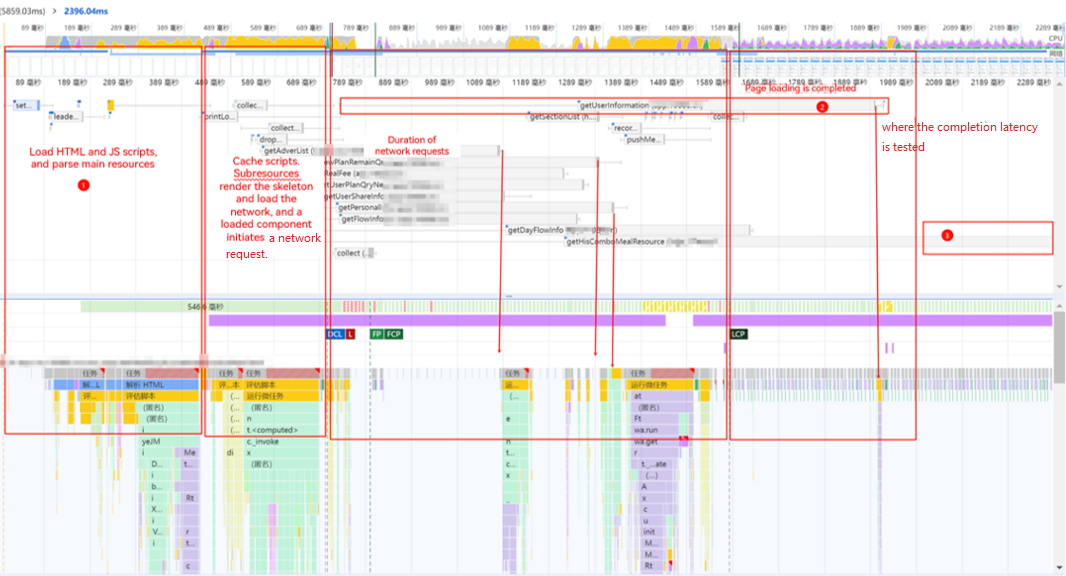
The coupon details page of an application is loaded using the Web component, and the actual loading completion latency is 1552 ms, far exceeding 900 ms.
Issue Trace
Loading Process Analysis
According to the trace graph, an API and a segment of JS script are requested after the page is loaded. The script triggers a large number of network requests and task callbacks. The screen is blank from area ① to the position at 600 ms or more, waiting for the JS script to finish execution. After the execution is complete, the skeleton screen is displayed (area ③). In this phase, there are multiple long-queue requests, and the server processing takes a long time (light gray area).
- getUserInformation() takes 1.2s, in which the waiting time is 520 ms and the request takes 680 ms.
- getHisComboMealResource() takes 1.9s, in which the waiting time is 630 ms and the request takes 1.3s.
Root Cause
- The loading of the first screen is blocked by the JS execution, which takes a long time (more than 600 ms).
- The API requests take a long time. (In the figure, the light gray area in the network lane indicates the time for waiting for a response after a request is sent. It can be seen that the response waiting time of most APIs is long possibly because of hardware limitations.) As a result, tasks are sparse in the loading phase of the main thread, affecting the overall completion.
Optimization Solution
- This page is a fixed page. You can preload the web page on the home page for quick rendering after redirection.
- You can optimize the network requests using any of the following methods:
- Reduce the number of network request APIs by combining network requests, reducing the network load of the server.
- Check the reason why getHisComboMealResource() takes a long time at the backend and optimize the backend processing logic.