To help you analyze performance problems more efficiently, DevEco Studio provides DevEco Profiler, a scenario-specific profiling tool that supports redirection to a specific code line. With DevEco Profiler, you can collect complete performance data in different app models and scenarios. Based on the collected data, you can understand the running details of your app in specific scenarios.
DevEco Profiler complies with the top-down design concept and data display paradigm in its design. It analyzes the collected data and displays it in lanes by breaking complex problems into smaller parts. It provides in-depth analysis of function hotspots and CPU scheduling details, helping you build a performance model.

- DevEco Profiler supports profiling of apps running on real devices connected via USB or wireless networks, and does not support profiling of apps running on emulators.
- macOS 12 and later versions support DevEco Profiler.
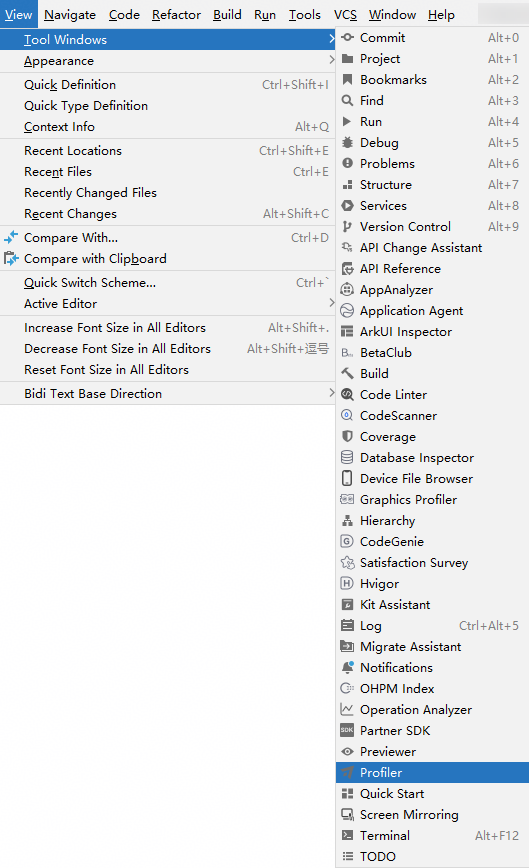
You can open DevEco Profiler in any of the following ways:
- On the top menu bar of DevEco Studio, choose View > Tool Windows > Profiler.
- Click Profiler on the bottom toolbar of DevEco Studio.
- Press Ctrl+Shift+A (double-press Shift on macOS) to enable the search feature and search for Profiler.