Function Overview
This function helps you clearly understand the behavior path of users in an app, which is crucial for verifying operations strategies and guiding app iterations.
If the conversion path is clear, you just need to monitor the conversion rate of each key step through the funnel. However, the actual situation can be complex. With a myriad of paths leading to the final conversion, you may not know for sure which path has the shortest conversion period and which path users favor most.
- Event path:
Take e-commerce as an example. The process from app sign-in to successful payment goes through multiple steps, including homepage browsing, product search, details page browsing, adding to cart, submitting an order, and payment. Users, however, may not follow the standard procedure when making an actual purchase. For example, after submitting an order, they may return to the homepage to continue their search or cancel their order.
In this case, you can combine the session path analysis model with other models for drill-down analysis, guiding users to a better path or the one expected by the app designer.
- Page path:
In particular, when trying to identify areas of improvement for apps in industries like automotive, real estate, and entertainment that always entail multiple lines of business, content sections, and products, you'll need to find the pages with a high churn rate, and then locate specific events responsible for such a churn rate. Take the e-commerce industry as an example. A path from user sign-in to successful payment can include many pages. Some of the pages in the path may contribute to successful payment, while some may lead to user churn.
With page path analysis, you can find out which pages show a higher churn rate and identity pertinent events. Then, you'll be able to perform drill-down analysis, guiding users to a better path or the one expected by the app designer.

Currently, the page path function is available only to some invited partners. You can apply to enable this function by submitting a ticket online. For details, please refer to Submitting a Ticket Online. We will reply to you in 1 to 2 working days.
Prerequisites
To use the page path analysis function, ensure that you have integrated the Analytics SDK 6.3.0.300 or later. For details, please refer to Integrating the SDK.
Typical Application Scenarios
- Analyze how users behave within an app from entry to exit.
- Check whether users follow the expected path and where they churn.
- Analyze the main path of user conversion to optimize app design.
- Find out how user behavior paths differ by area or phone model.
- Discover what operations users perform after an app crashed.
[h2]Case
For an e-commerce app, after the pages for adding products to the shopping cart and submitting orders are modified, you can use the session path analysis function to compare the user session paths of the last 30 days in the new and earlier versions to measure the modification effects.
[h2]Procedure
- Sign in to AppGallery Connect and click My projects.
- Find your project, and click the app for which you want to view analysis data.
- Go to .
- Click the Event path tab to view the event path analysis report. For details, please refer to Event Path.
- Click the Page path tab to view the page path analysis report. For details, please refer to Page Path.

- Session: A session starts when a user starts to use an app and ends when the user stops using the app. If a user performs an action more than 30 minutes after the previous action, it is a new session.
- Session path: In a session, a user generates multiple events. The session path refers to the order of the events sorted by time.
[h2]Event Path
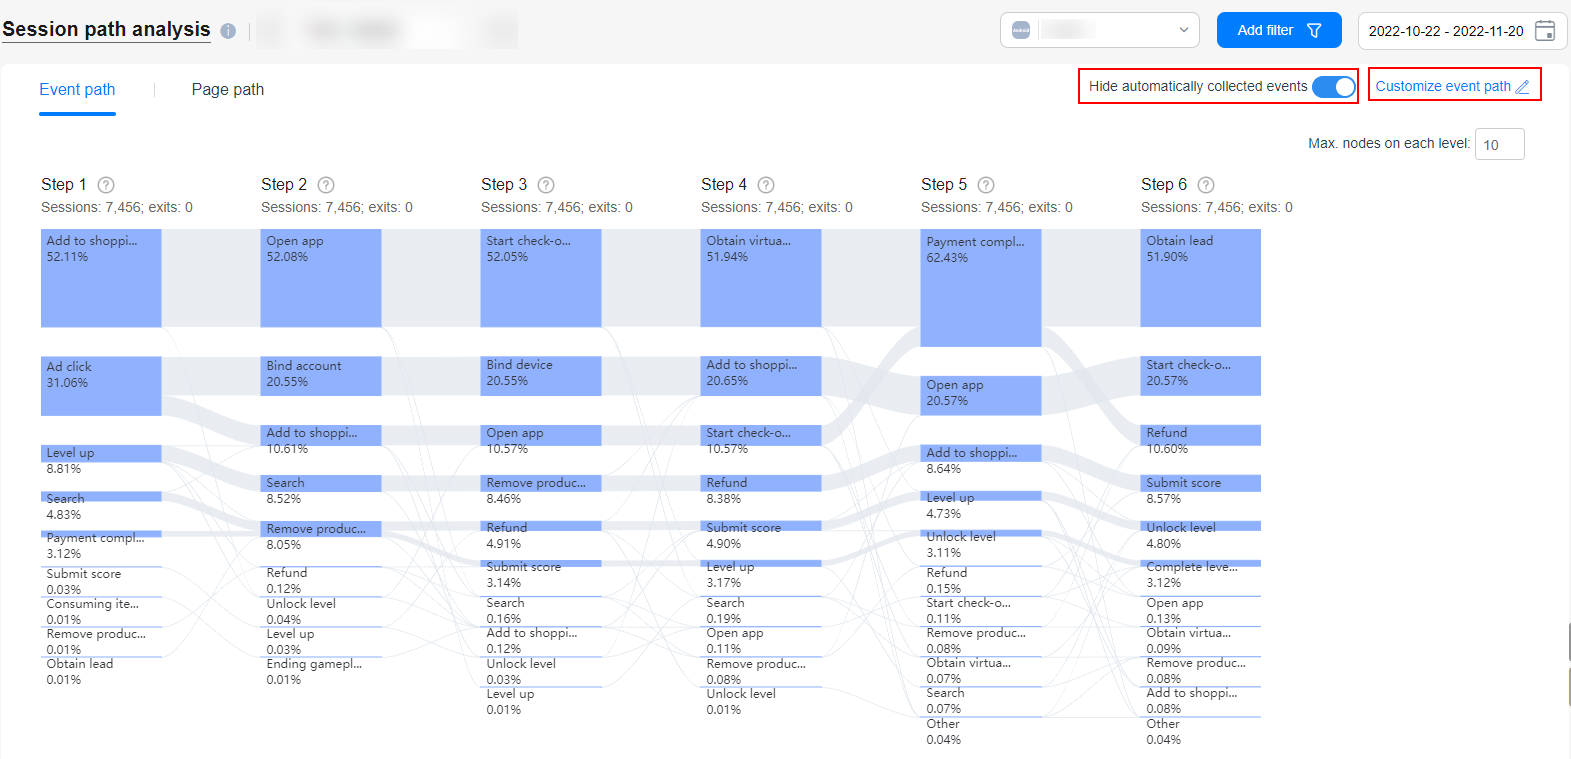
- View the default event paths.
- Path analysis is performed based on events. By default, the system displays the event paths of all reported events.
- The analysis result is displayed in a Sankey diagram, showing the previous and next paths and flow direction of each event. By default, six steps are displayed, and each step has ten nodes. The Other node represents all nodes not displayed on this page.
- Events automatically collected by Analytics Kit and DTM can be filtered out.
- You can click Customize event path to go to the HUAWEI Analytics > Explore page and create a custom analysis model.
- Highlight an event path.
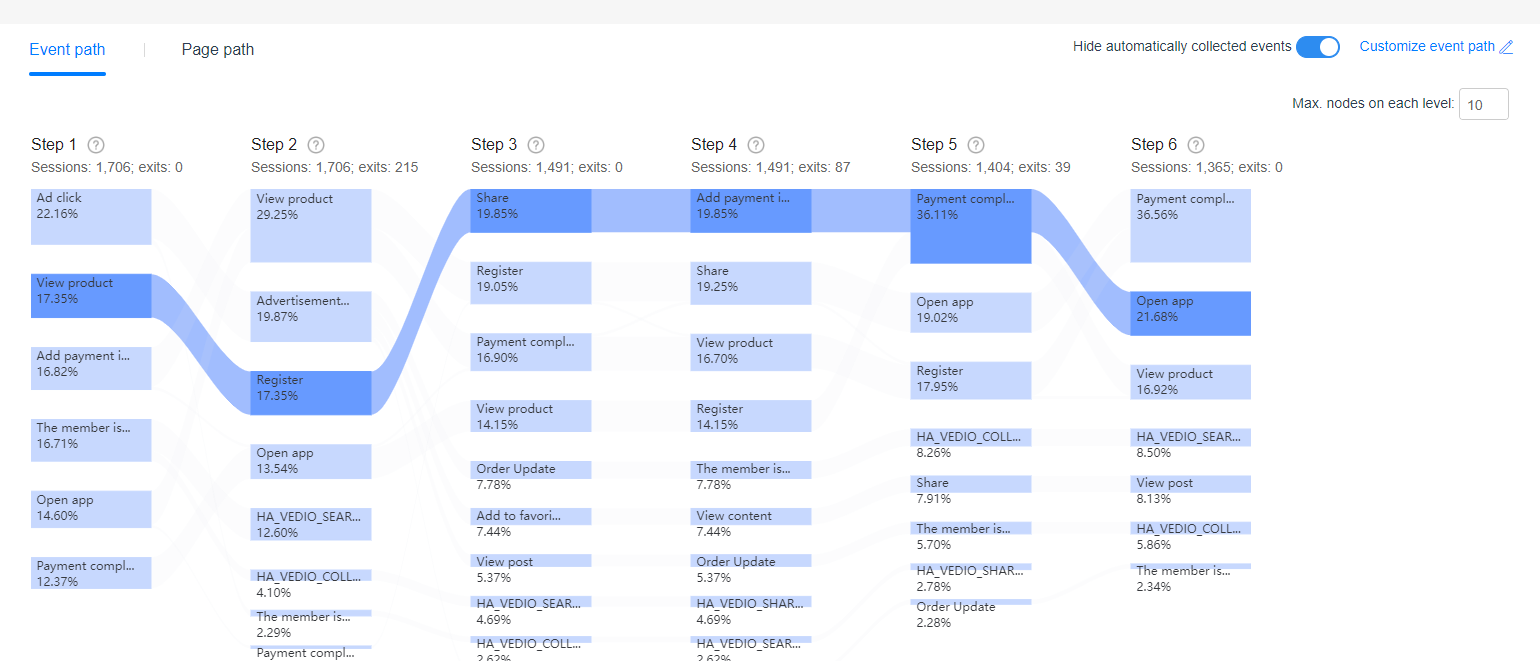
- When you place the pointer on a node, this node as well as its previous and next nodes will be highlighted. The event ID, event name, total number of sessions, and session percentage are also displayed.
- If you click a node and choose Show event path, the steps associated with the event represented by this node will be highlighted. To unhighlight these associated steps, click any highlighted node and choose Unhighlight.
- Save a path as a funnel.
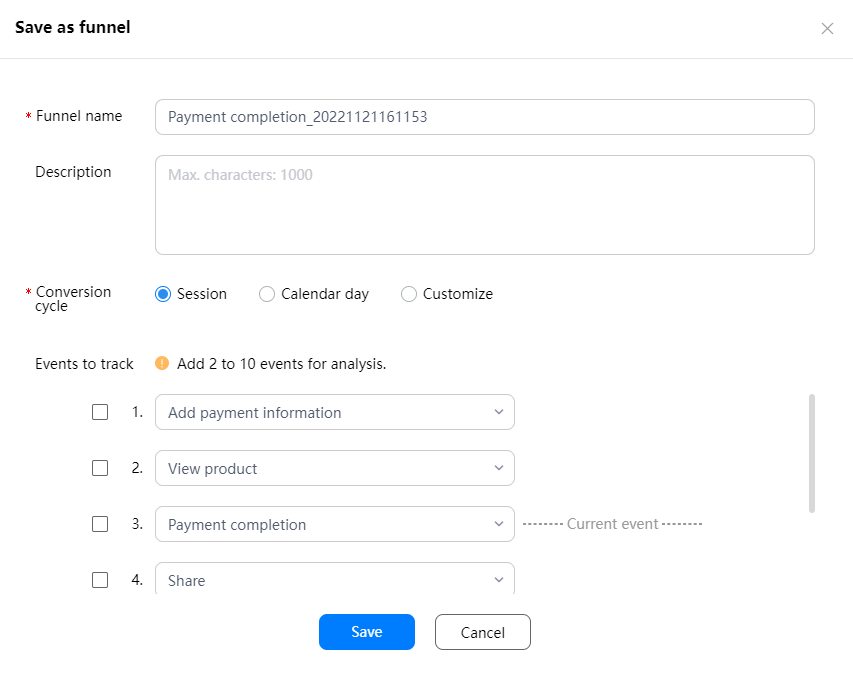
If you find that the churn rate of new users is relatively high during the process of adding to favorites, submitting an order, and payment, you can save these events as a funnel and then pinpoint causes of churn and analyze the conversion effect by using the funnel analysis model.
Click the target node and choose New event funnel. You will then be able to save key events as a funnel, and use the funnel analysis model to perform in-depth analysis and reveal causes of user churn conveniently and efficiently.
[h2]Page Path
- View the default page paths.
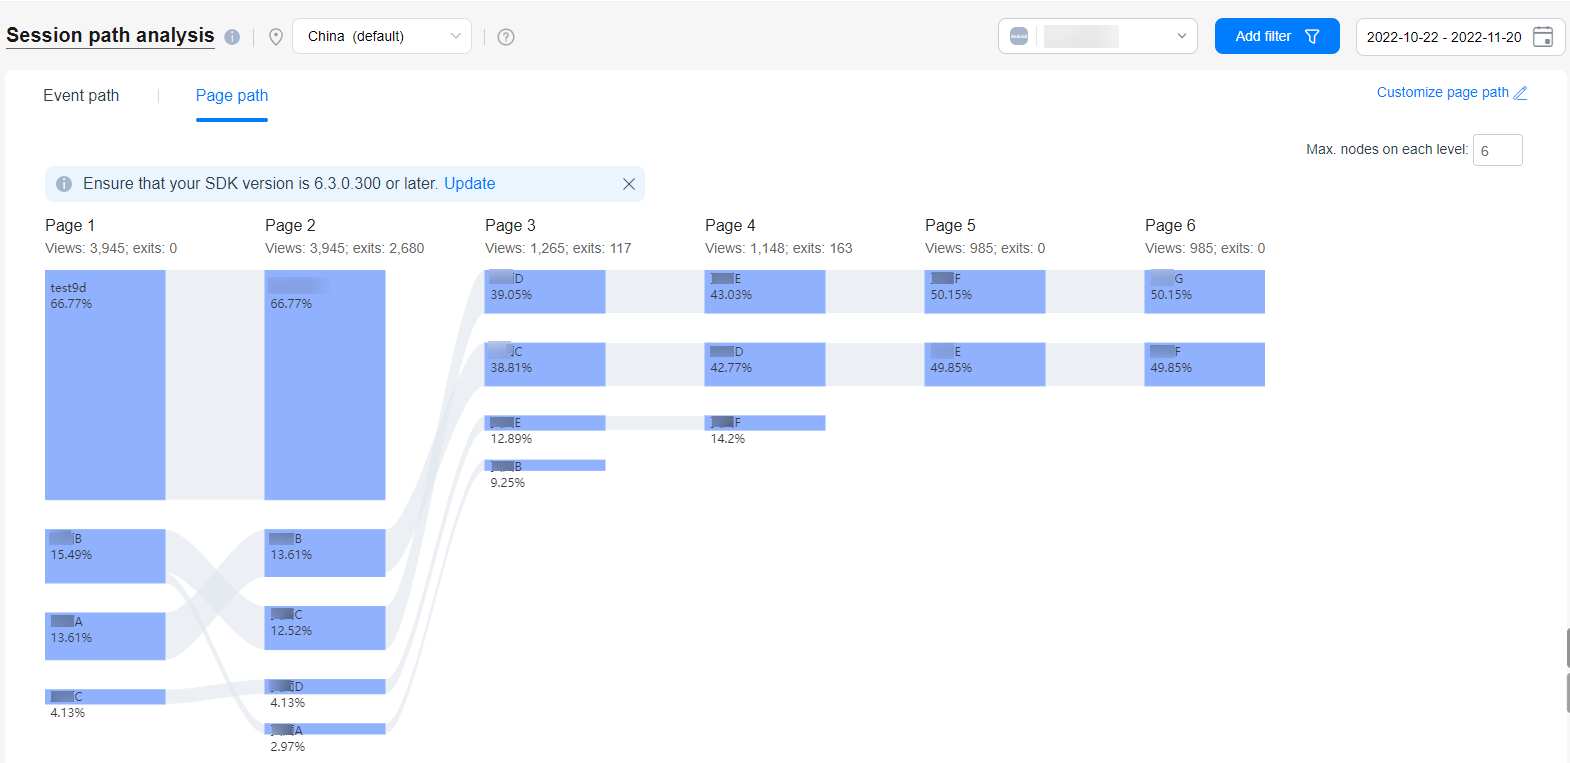
- Path analysis is performed based on pages. By default, the system displays the page paths of all reported events.
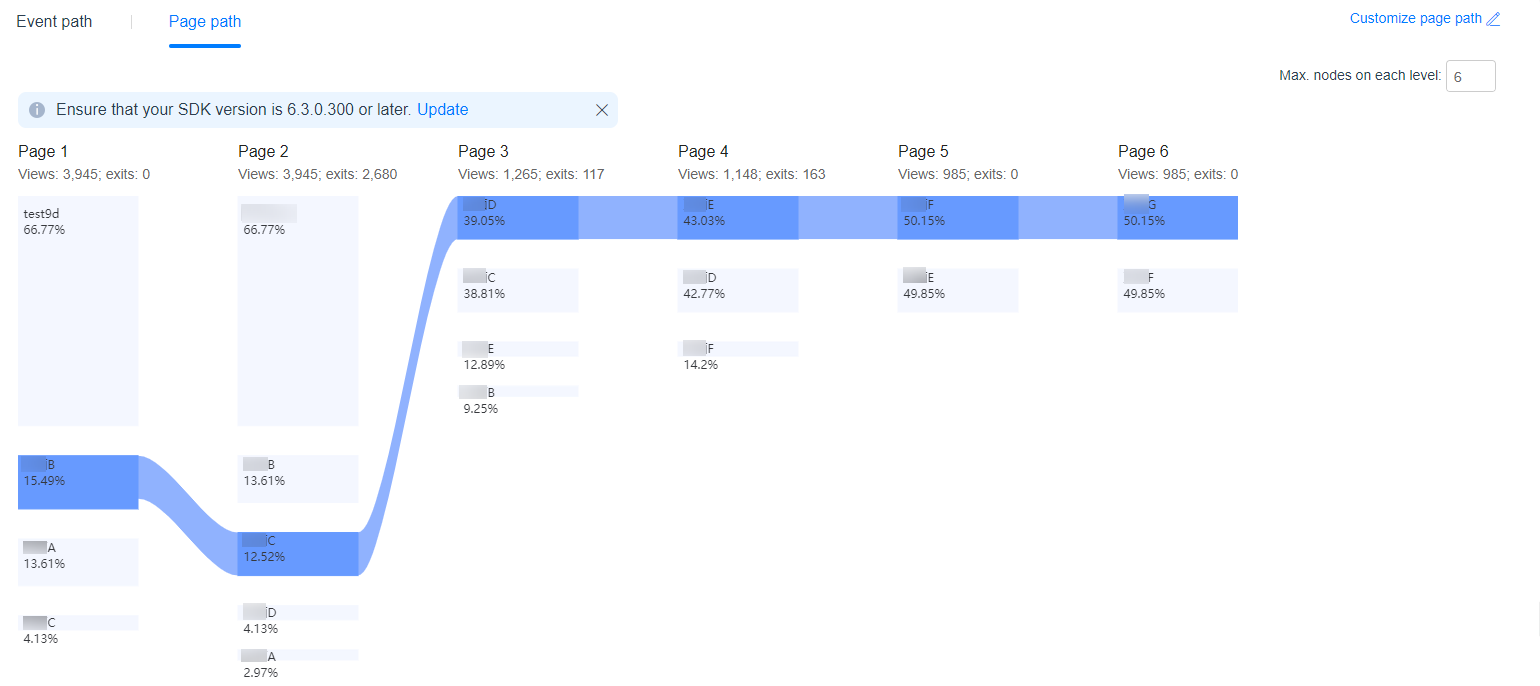
- The analysis result is displayed in a Sankey diagram, showing the previous and next paths and flow direction of each page. By default, six steps are displayed, and each step has six nodes. The Other node represents all nodes not displayed on this page.
- You can click Customize event path to go to the HUAWEI Analytics > Explore page and create a custom analysis model.
- Highlight a page path.
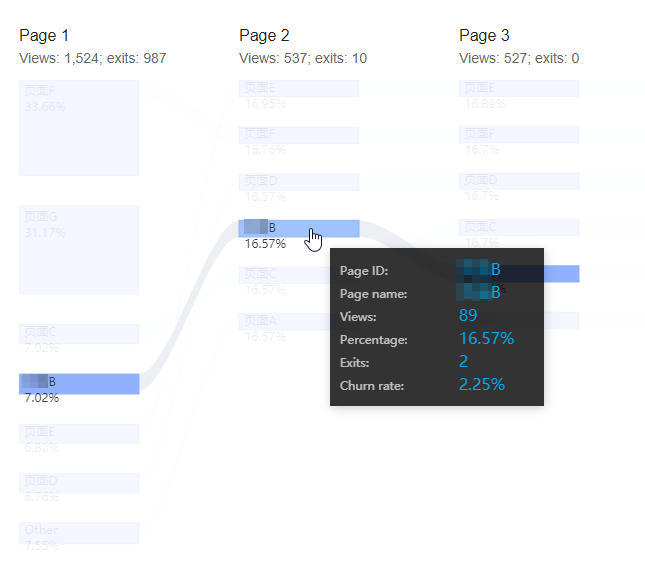
- When you place the pointer on a node, this node as well as its previous and next nodes will be highlighted. The page ID, page name, views, percentage, exits, and churn rate are also displayed.
- If you click a node and choose Show page paths, the steps associated with the page represented by this node will be highlighted. To unhighlight these associated steps, click any highlighted node and choose Unhighlight.
[h2]What does Other mean in the path analysis diagram?
- By default, in the Sankey diagram of event path analysis, six session steps are displayed, and each step has 10 event nodes. The Other node represents all nodes not displayed in the current event paths. A maximum of 20 event nodes are supported for each session step.
- By default, in the Sankey diagram of page path analysis, six page steps are displayed, and each step has six page nodes. The Other node represents all nodes not displayed in the current page paths. A maximum of 10 page nodes are supported for each page step.