问题现象
应用在使用过程中出现自动退出的情况,该如何定位?
问题定位
- 查看faultlogger目录下的AppFreeze日志,主线程发生卡死,当前任务从08:19:21.148开始执行,到08:19:27.416还未执行结束,执行时间超过6s。
Main handler dump start time: 2025-07-03 08:19:27.416
mainHandler dump is:
 EventHandler dump begin curTime: 2025-07-03 08:19:27.416
 Event runner (Thread name = , Thread ID = 61389) is running
 Current Running: start at 2025-07-03 08:19:21.148, Event { send thread = 62421, send time = 2025-07-03 08:19:21.148, handle time = 2025-07-03 08:19:21.148, trigger time = 2025-07-03 08:19:21.148, task name = , caller = [native_safe_async_work.cpp(PostTask:451)] }
History event queue information: - 搜索关键字TID:进程ID(PID),获取应用栈信息,3s栈和6s栈因为超时获取失败。
Failed to dump normal stacktrace for 61389
Reason:
normal stack:failed to fully dump due to timeout
Tid:61389, Name:com.hx.example
#00 pc 00000000001cc674 /system/lib/ld-musl-aarch64.so.1
#01 pc 00000000001d2658 /system/lib/ld-musl-aarch64.so.1
#02 pc 00000000000a291c /system/lib/ld-musl-aarch64.so.1
#03 pc 000000000014ab24 /data/storage/el1/bundle/libs/arm64/libentry.so
#04 pc 0000000000149164 /data/storage/el1/bundle/libs/arm64/libentry.so
#05 pc 00000000002a21e4 /data/storage/el1/bundle/libs/arm64/libentry.so
#06 pc 0000000005d22478 /data/storage/el1/bundle/libs/arm64/libkn.so
#07 pc 0000000005d206b0 /data/storage/el1/bundle/libs/arm64/libkn.so
#08 pc 0000000005d6d884 /data/storage/el1/bundle/libs/arm64/libkn.so
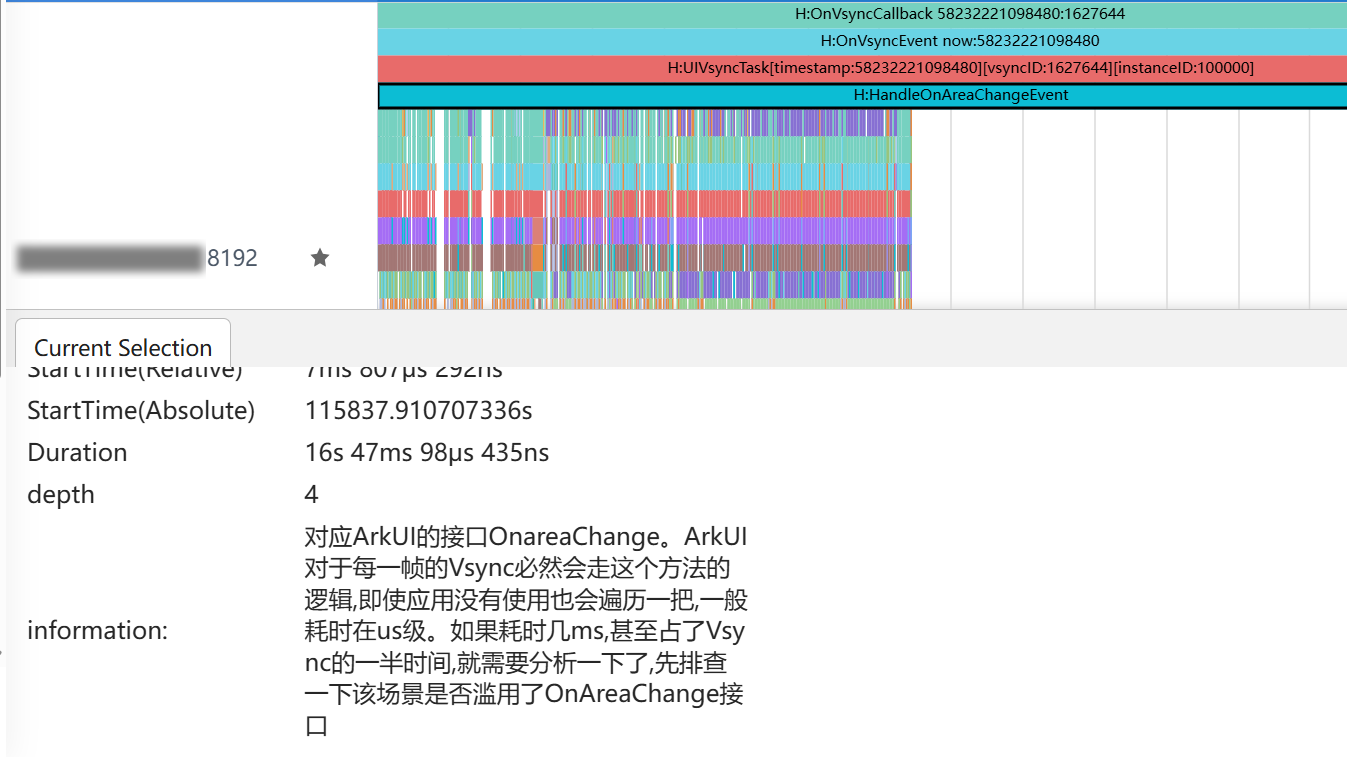
- 使用HiSmartPerf工具抓取该过程的Trace信息,观察到处理onAreaChange接口时间达到16s,远远超过一般的耗时(us级)。