An audience is a group of users who have common attributes and behavior. Through audience analysis, you can find out which products are more attractive for your users and customize different operations policies for target audiences to improve user experience and operations efficiency.
1. Sign in to AppGallery Connect and select "My projects".
2. Click the app for which you need to view analytics data.
3. Go to "Analyze > Audience analysis".
On the Audience analysis page, you can:
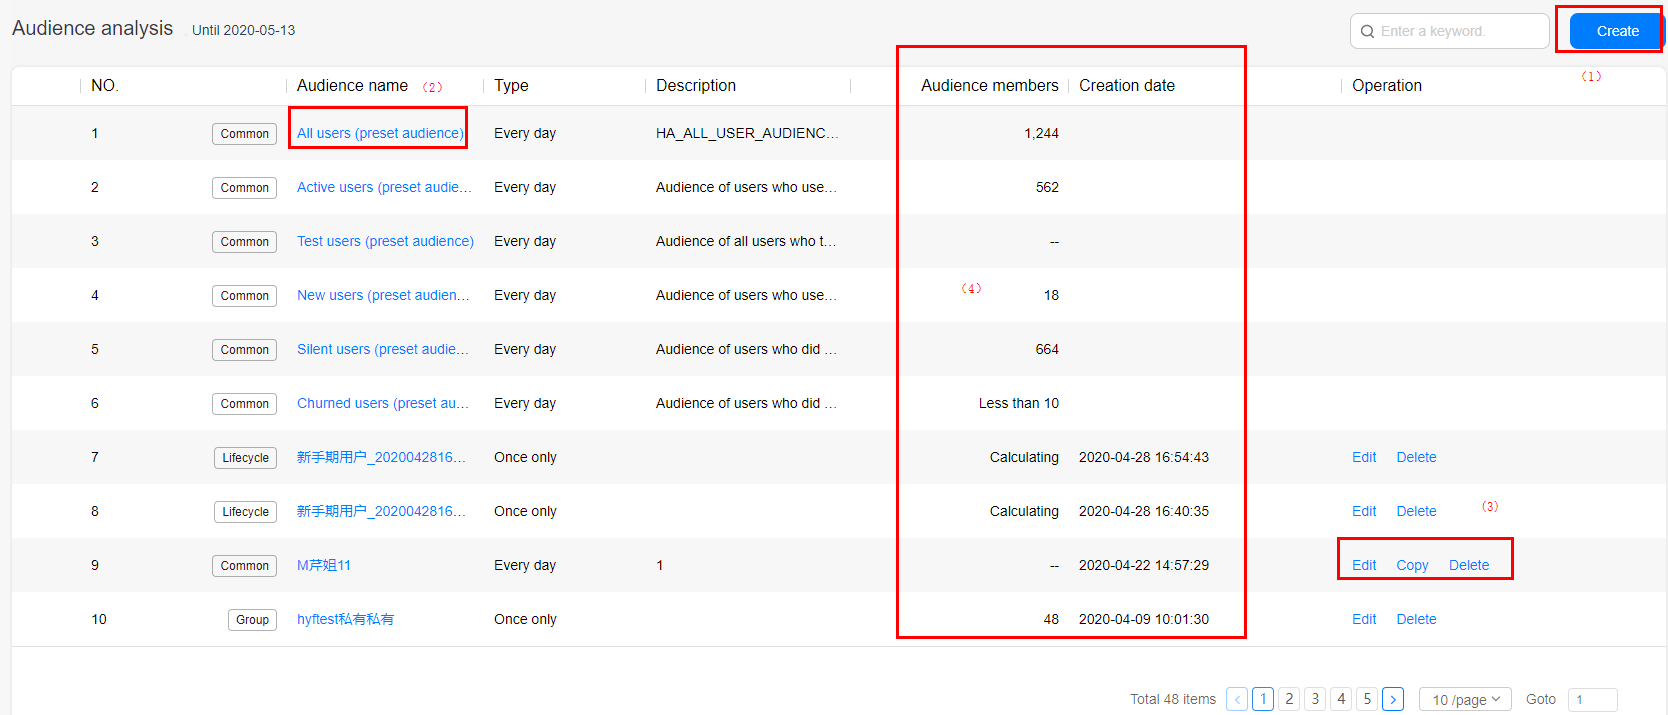
View the audience list, including audiences preset in the system and audience groups that you have created.
View the basic information about each audience, including the name in area (2), type, number of members in area (4), and creation time.
Manage audiences, including creating an audience by clicking Create in area (1) and editing, copying, or deleting an audience that you have created by clicking Edit, Copy, or Delete in area (3). The preset audiences cannot be deleted or edited.
Search for a specific audience.
Click Create at the upper right corner of the Audience analysis page to create an audience.
You can create an audience in either of the following modes:
1. Creating an audience in condition group mode.
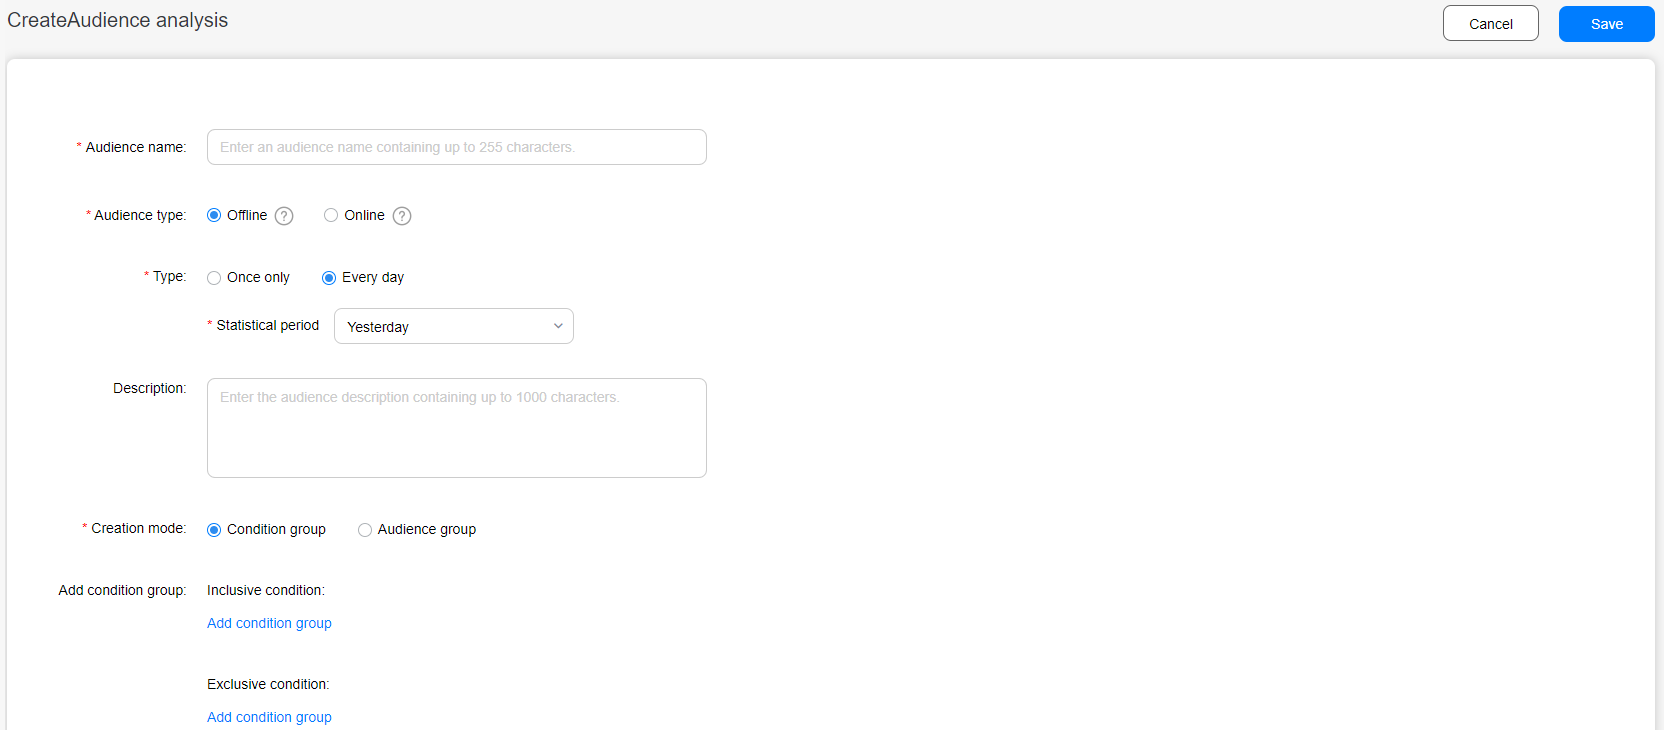
The following table describes the related parameters.
| Parameter | Description |
|---|---|
Audience name | Enter an audience name that is easy to remember and understand. |
Audience type | Offline: Calculates audiences based on historical events and user attributes. Online: Calculates incremental audiences in real time based on real-time access events. The calculation result can be directly used for services such as A/B, in-application message (IAM), and Push. |
Type | Once only: Calculates the number of users who meet the specified conditions in a specified time range in one-off mode. Every day: Calculates the number of users who meet the specified conditions in a specified time range every day based on the latest data. |
Statistical period | If Type is set to Once only, specify a time range for the calculation. The maximum time range is 14 days. If Type is set to Every day, specify a time range for each calculation, such as yesterday or the previous 3, 7, or 14 days. |
Description | Enter the purpose and business semantics of this audience. |
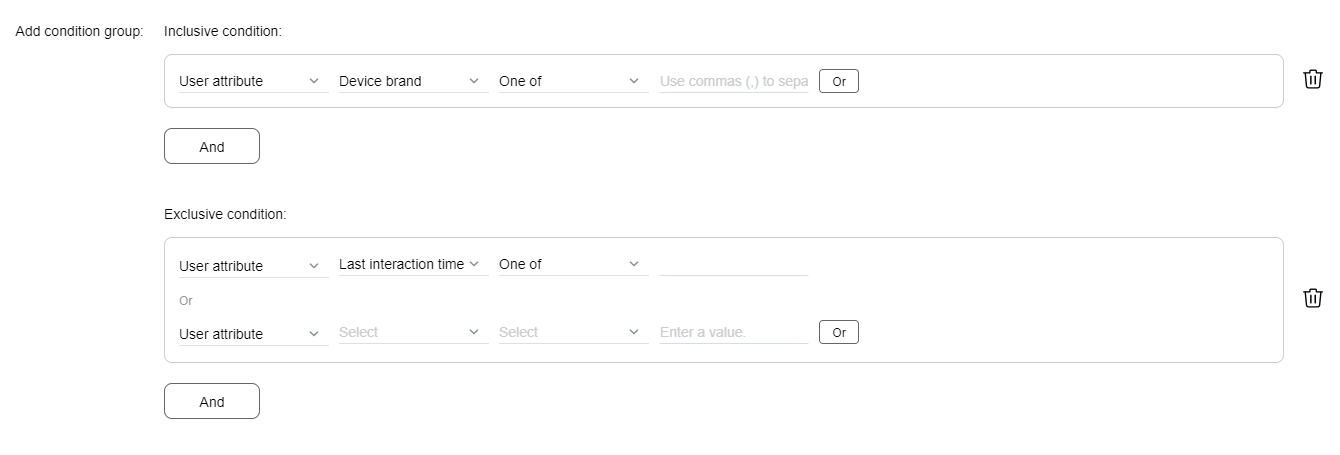
Inclusive condition | Users who meet the specified conditions will be included in the audience group. You can use user attributes (including preset and custom user attributes) and user events (including preset and custom events) to define the conditions. You can specify a maximum of 10 filter criteria for an audience. |
Exclusive condition | Users who meet the specified conditions will be excluded from the audience group. The system checks whether a user meets the inclusive condition and then checks whether the user meets the exclusive condition. If the exclusive condition is met, the system does not add the user to the audience group. You can specify a maximum of 10 filter criteria for an audience. |
For example:
When specifying audience conditions, you can use a combination of user attributes and events. The relationship between sub-conditions in a condition block is OR, and the relationship between condition blocks is AND, as shown in the following figure.
On the Audience analysis page, click Edit in the Operation column to modify a custom audience.
On the Audience analysis page, click Delete in the Operation column to delete a custom audience.
2. Creating an audience in audience group mode.
In this mode, the method of setting the parameters Audience name, Type, Statistical period, and Description is the same as that in condition group mode, and the only difference is about adding condition groups.
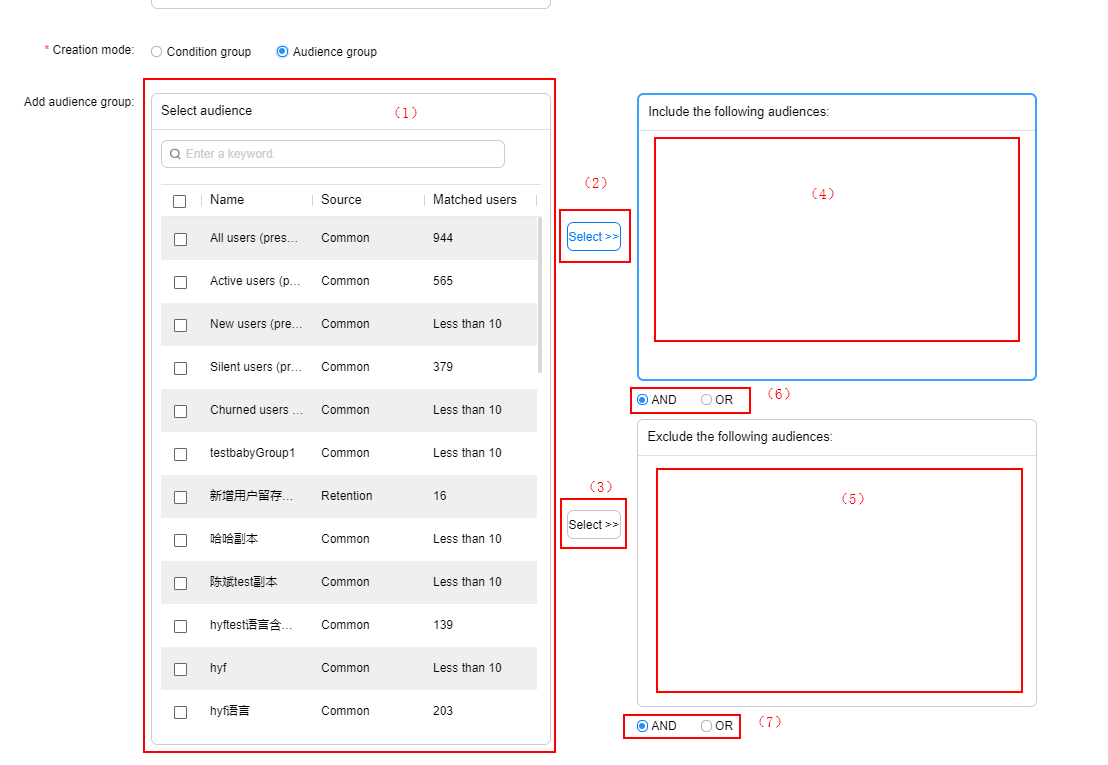
In area (1), the list of all audiences are displayed for you to select.
In area (2), click Select to add selected audiences to area (4) as inclusive conditions.
In area (3), click Select to add selected audiences to area (5) as exclusive conditions.
In area (6), select AND or OR as the logical operator for inclusive conditions.
In area (7), select AND or OR as the logical operator for exclusive conditions.
Click the name of an audience on the Audience analysis page to view the audience analysis report.
You can use the date control to set a time range for analysis.

1. Viewing the audience overview
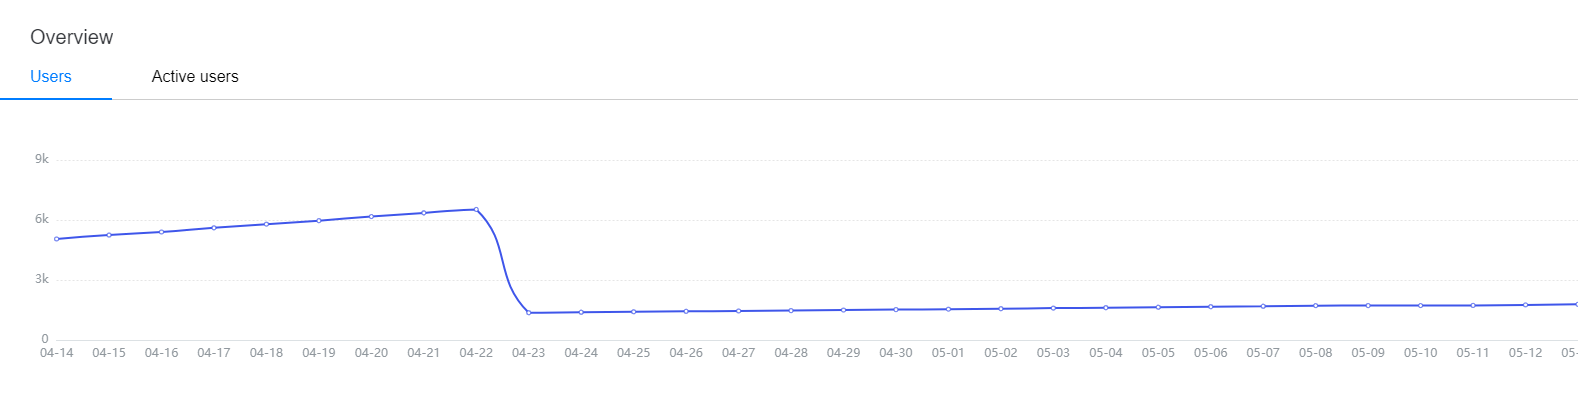
This report provides the change trends of the number of users and the number of active users in an audience group in a specified time range.
2. Viewing event distribution
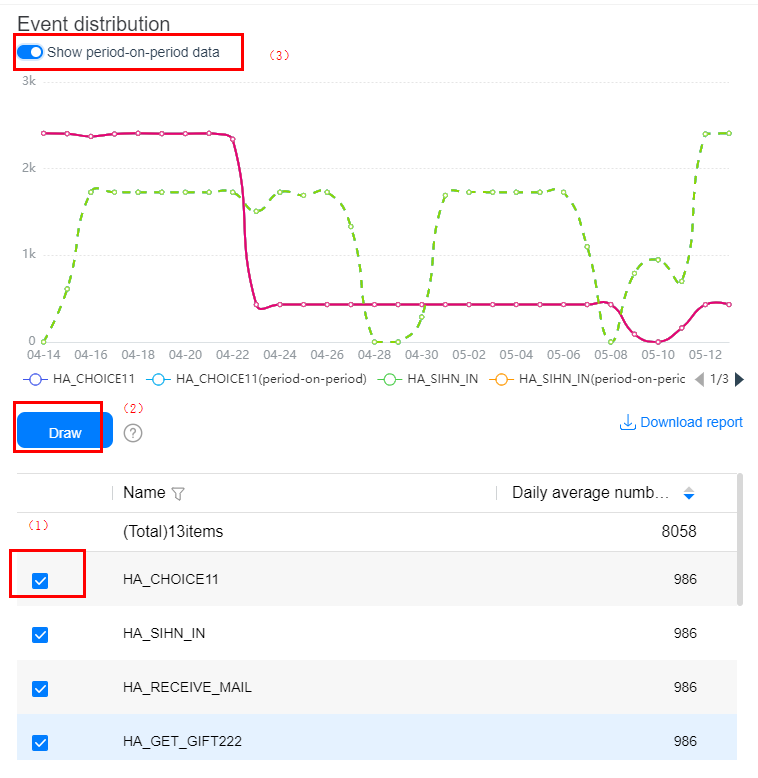
This report provides and compares the quantity distribution trends of events triggered by all users in the audience.
You can also specify the list of events that you are concerned about in area (1) and click the Draw button in area (2) to draw a new chart.
To view the period-on-period change, turn on Show period-on-period data.
3. Viewing system version distribution
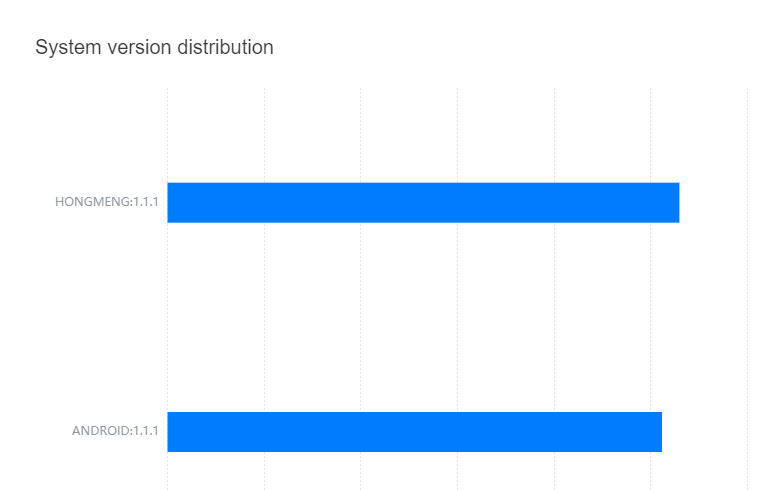
This report provides the distribution of operating system versions used by all users in the audience.
Maximum number of audiences that can be created for an app: 50.
Effective time of a new or modified audience: T+1 day.
Editing or deletion of preset audiences: not supported.
If you create an audience by using the combined audience mode, you can select a maximum of five audiences for the inclusion condition and exclusion condition respectively.