User lifecycle refers to the entire process from the time when a user starts the app for the first time to the time when the user leaves the app. The lifecycle of a user can be divided into the following phases: Beginner, Growing, Mature, Inactive, or Lost.
Operations personnel can perform user steering and refined operations on users based on user lifecycle analysis to improve user activeness and retention and reduce user churn.
Procedure
1. Sign in to AppGallery Connect and select "My projects".
2. Click the app for which you need to view analytics data.
3. Go to "Analyze > User lifecycle".
The overview chart displays the data changes of users in each phase of the lifecycle, and provides data about the time selection, chain comparison analysis, conversion overview, and user trend. You can monitor user value changes through the user conversion trend in each phase.
Usage
1) Lifecycle overview
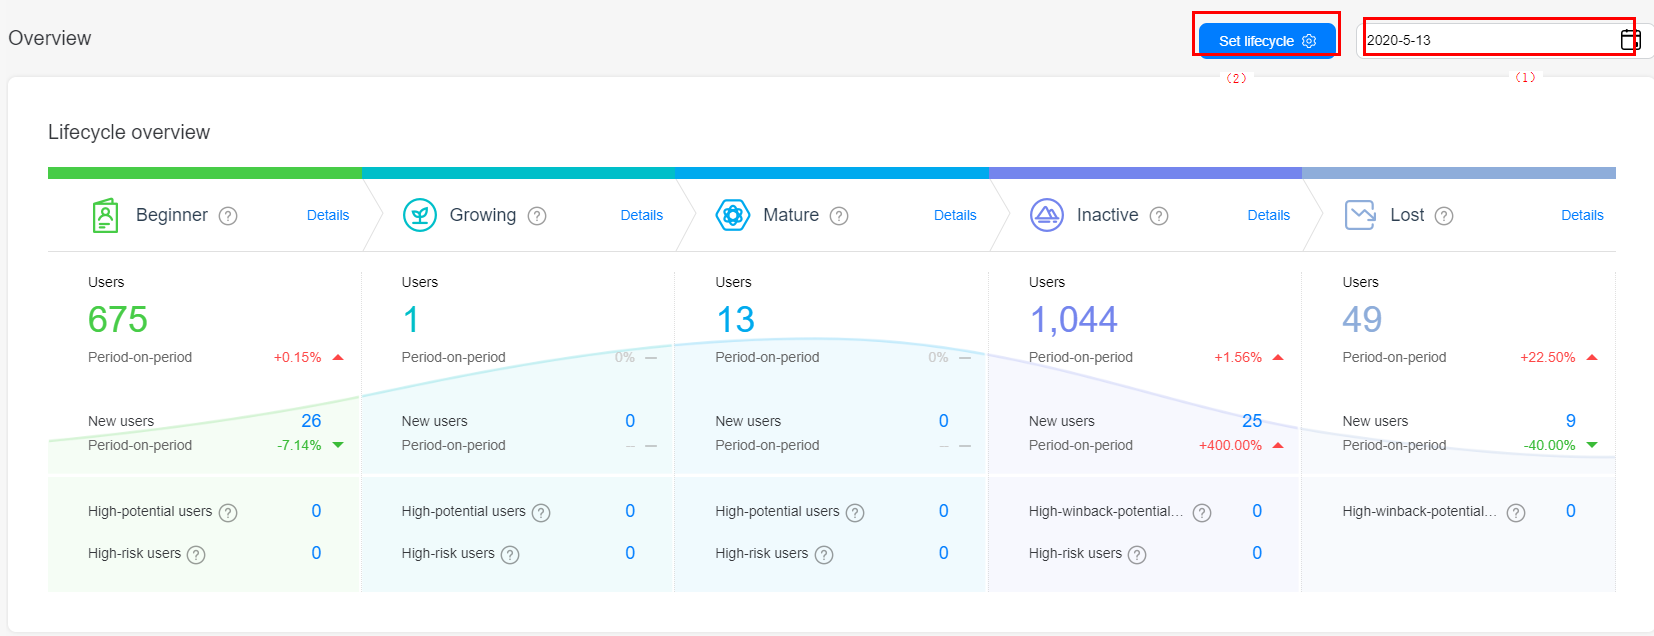
The lifecycle overview chart displays the number of users, number of new users, and period-on-period change data in each phase of the lifecycle on the selected date.
In area (1), click the date control to select a day in the last year for overview data and trend analysis.
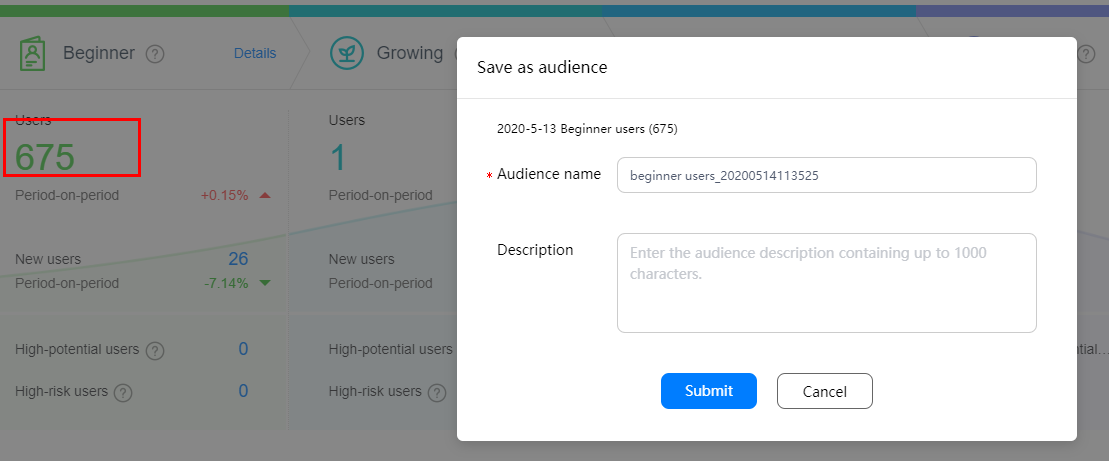
You can also click the number of users and the number of new users in each phase on the overview page to save them as audiences.
In area (2), click Set lifecycle to customize the user lifecycle.
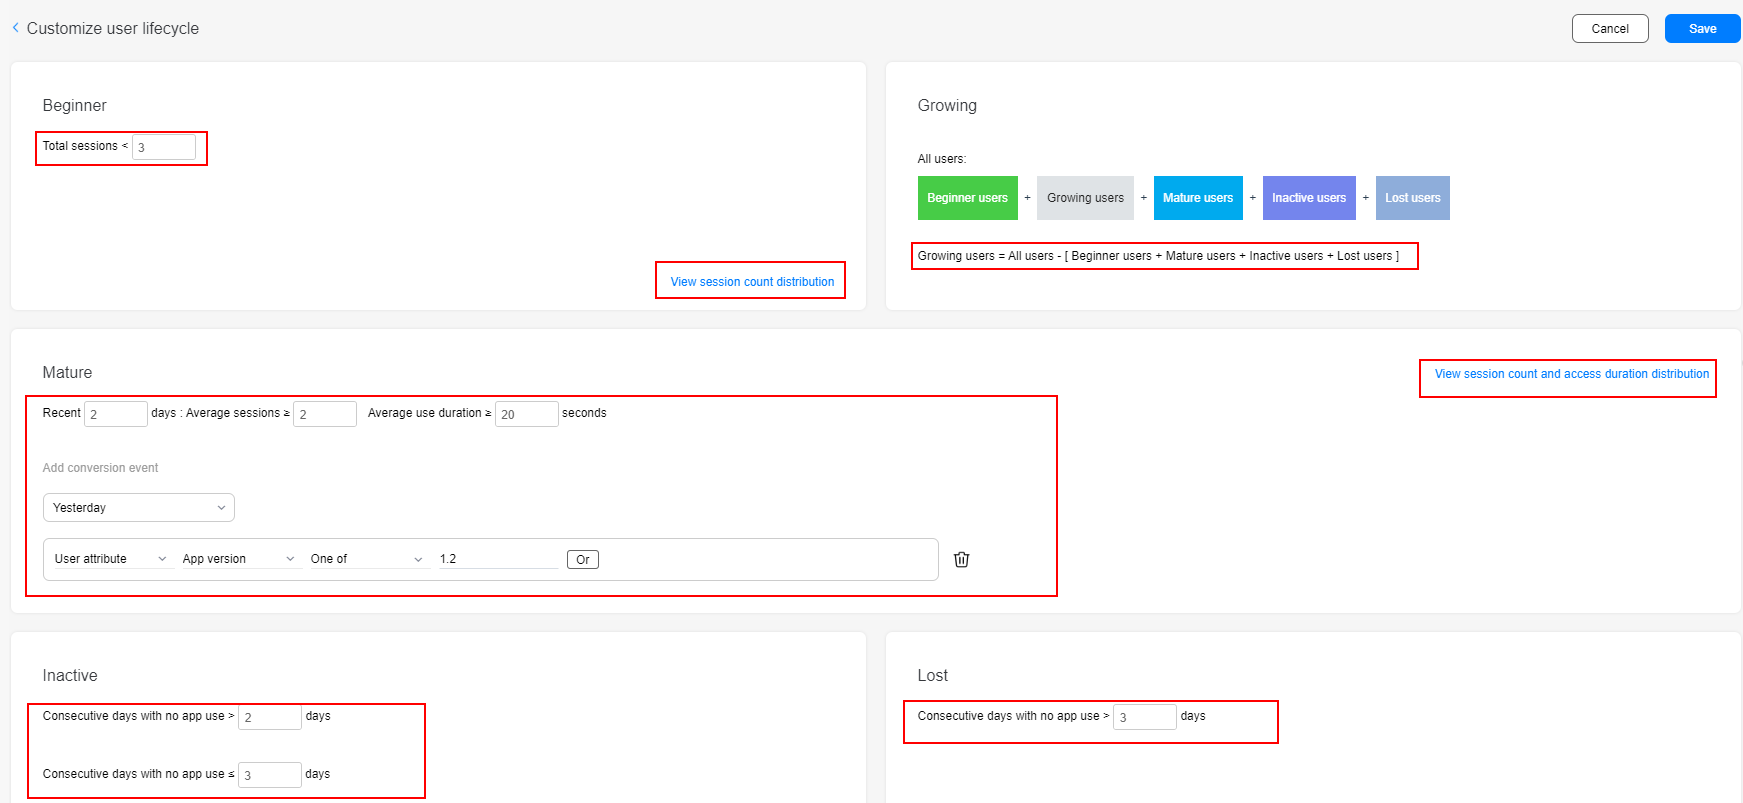
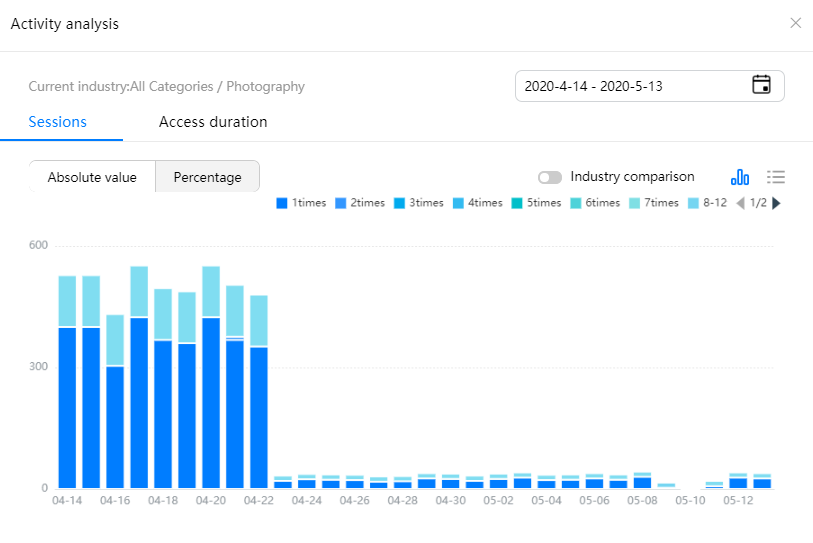
Define the Beginner phase by the total number of sessions. Click View session count distribution to view the comparison between the user activeness of your app and that of the industry.
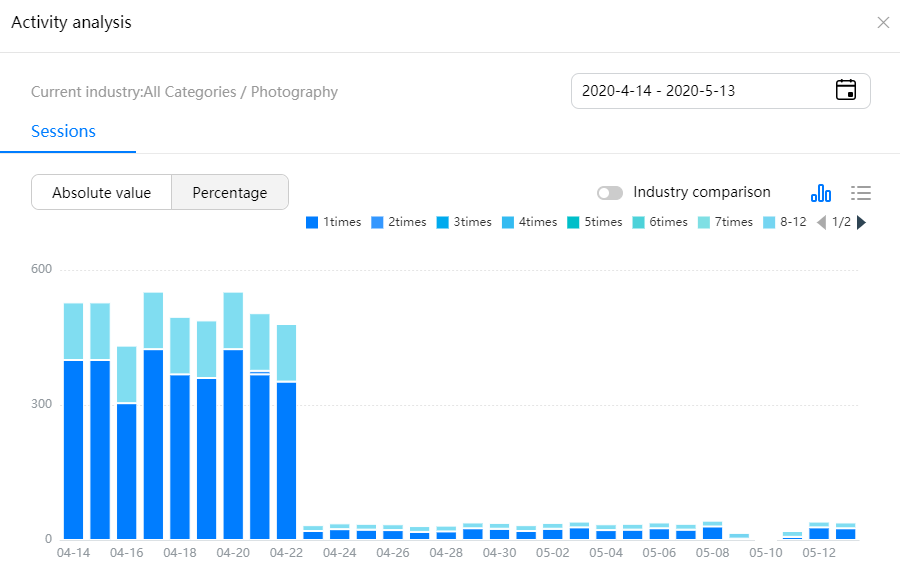
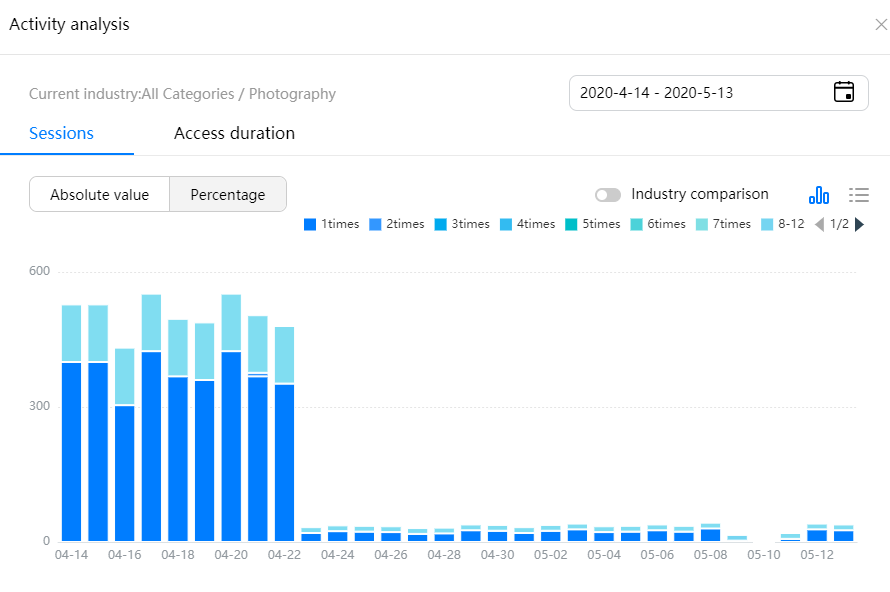
Define the Mature phase by the average number of startup times and average usage duration in the last X days. You can also add conversion events of the last one day, three days, seven days, and 14 days to further restrict the user conditions in the Mature phase. Click View session count and access duration distribution to view the comparison between the user activity of your app and that of the industry.
Define the inactive phase and lost phase by the number of days that a user does not open the app.
The number of users in the growing phase is equal to the total number of users minus the number of users in the beginner phase, mature phase, inactive phase, and lost phase.
2) User trend
The User trend chart displays the trend of users in each lifecycle phase in 30 days before the specified date. With this chart, you can clearly understand the change of users in the Beginner, Growing, Mature, Inactive, and Lost phases.
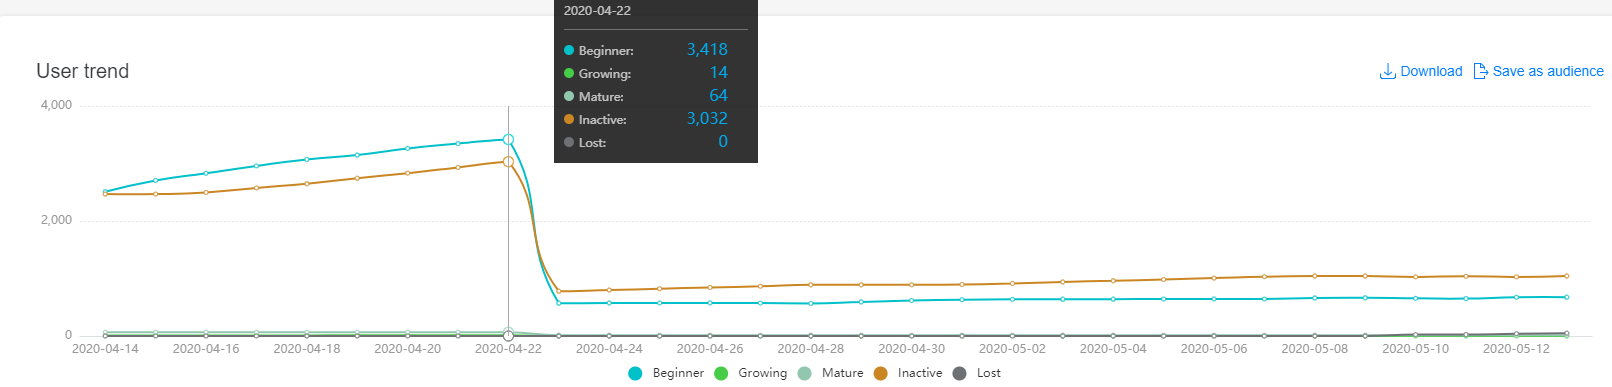
Click Download to download the data for personalized analysis.
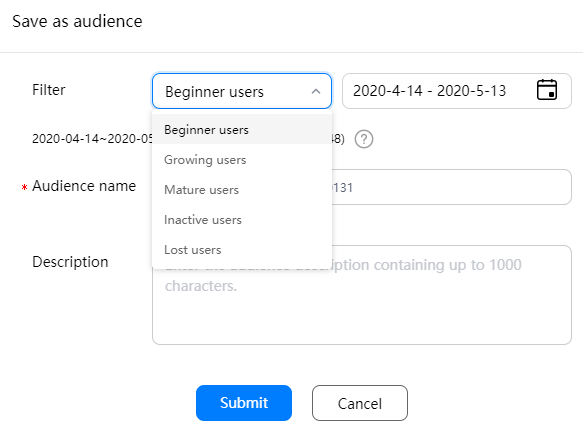
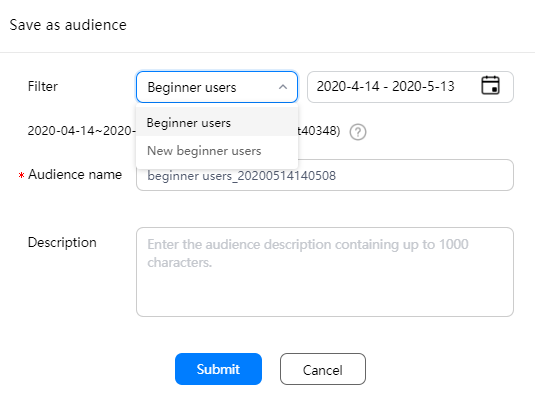
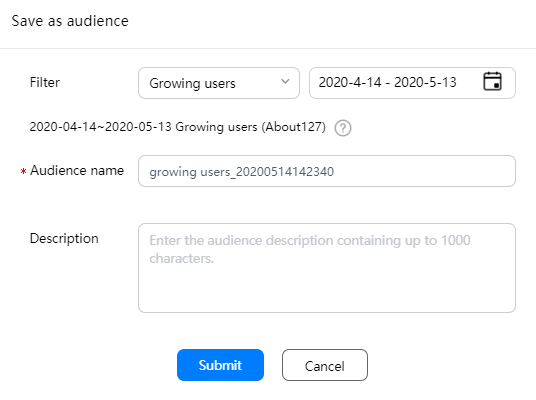
Click Save as audience to save users in the Beginner, Growing, Mature, Inactive, and Lost phases in a specified period as audiences. Then, you can perform in-depth insight analysis based on other analysis models or push marketing messages to the users.
3) Conversion trend
The conversion trend includes Activated, Converted, Inactive, Lost, and Won back.
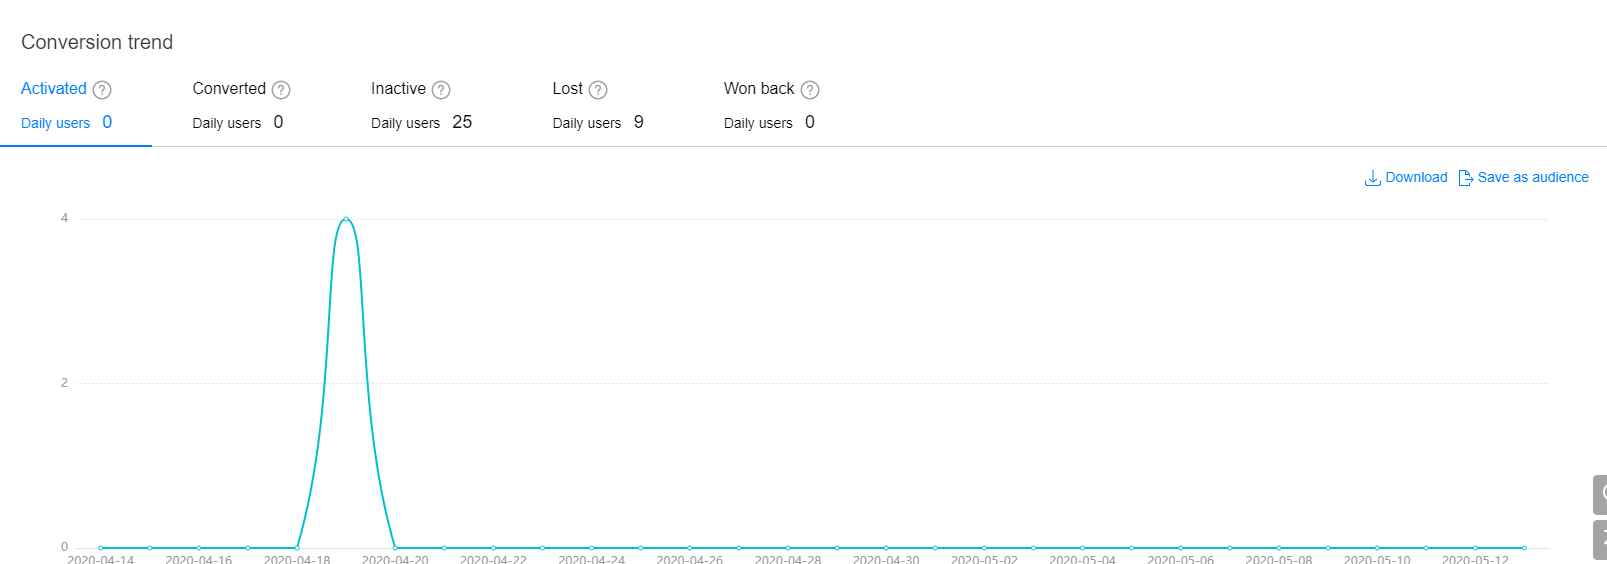
Activated: Displays the trend of beginner users converting to growing users in 30 days before the specified date.
Converted: Displays the trend of beginner and growing users converting to mature users in 30 days before the specified date.
Inactive: Displays the trend of beginner, growing, and mature users converting to inactive users in 30 days before the specified date.
Lost: Displays the trend of inactive users converting to lost users in 30 days before the specified date.
Won back: Displays the trend of inactive and lost users converting to beginner, growing, and mature users in 30 days before the specified date.
The beginner phase report provides the user data dashboard, user trend analysis chart, and user source analysis, helping you understand the user growth, conversion, and user source in the beginner phase, precisely locate the new user attraction channel quality, improve the number of active users, and convert high-value users.
Usage
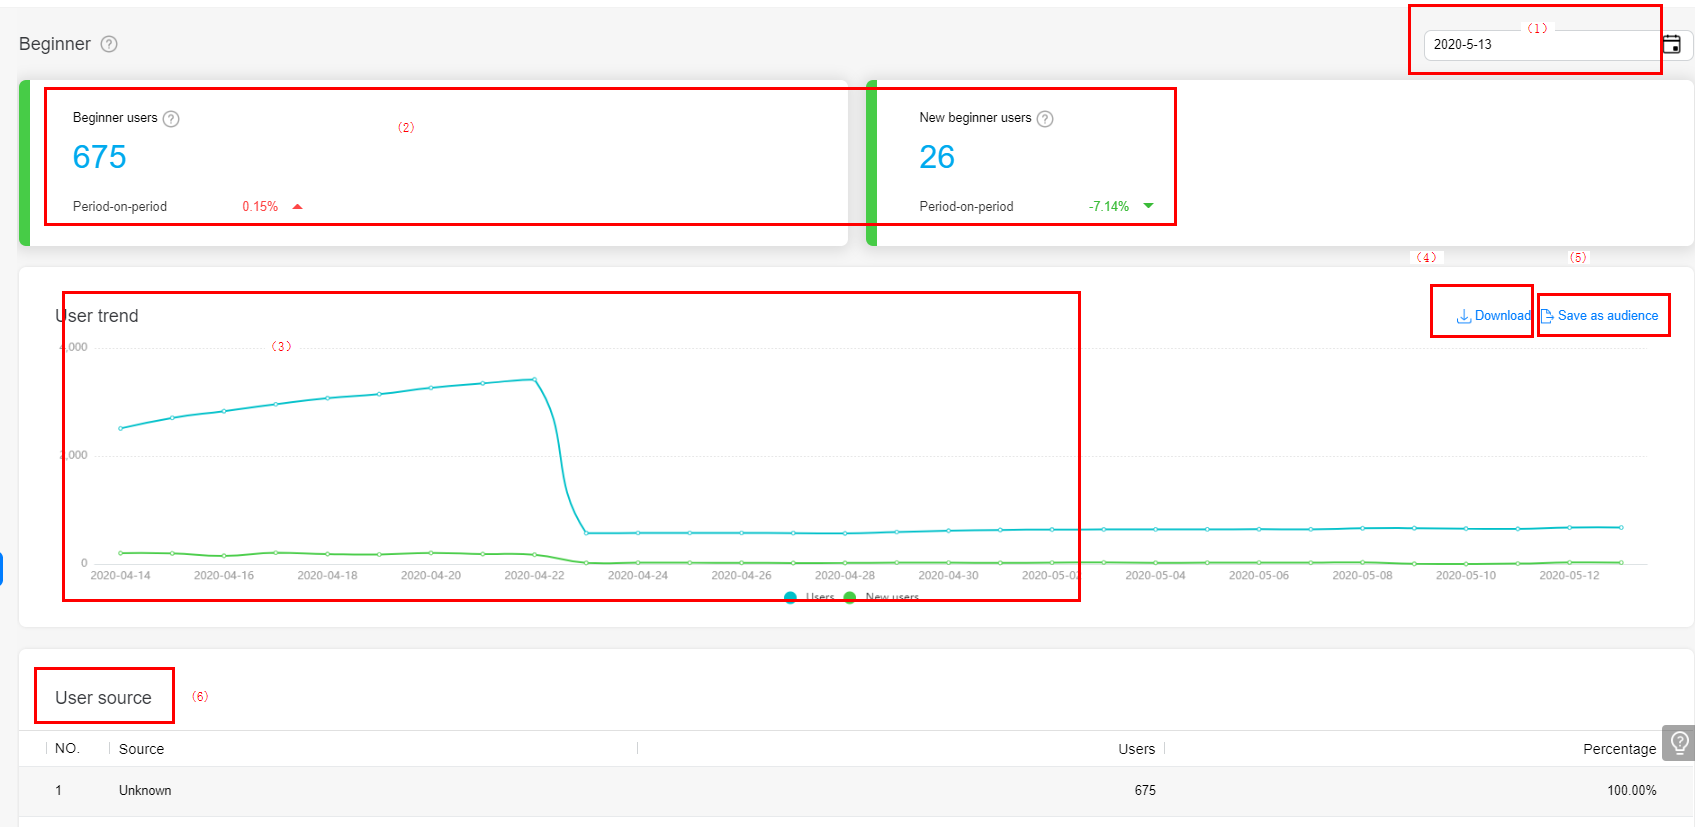
In area (1), click the date control to select a day in the last year for overview data and trend analysis.
In area (2), the dashboard displays all users and new users in the beginner phase on the selected day and the period-on-period change.
In area (3), the trend chart shows the trend of all users, new users, and re-acquired users in the beginner phase.
In area (4), click Download to download the data for personalized analysis.
In area (5), click Save as audience to save all users, new users, and re-acquired users in the beginner phase on a selected day as audiences.
In area (6), the user source chart shows the sources of users in the beginner phase, helping you understand the conversion effect of each app promotion channel.
The conversion trend chart displays the trend of all re-acquired users, re-acquired inactive users, and re-acquired lost users.
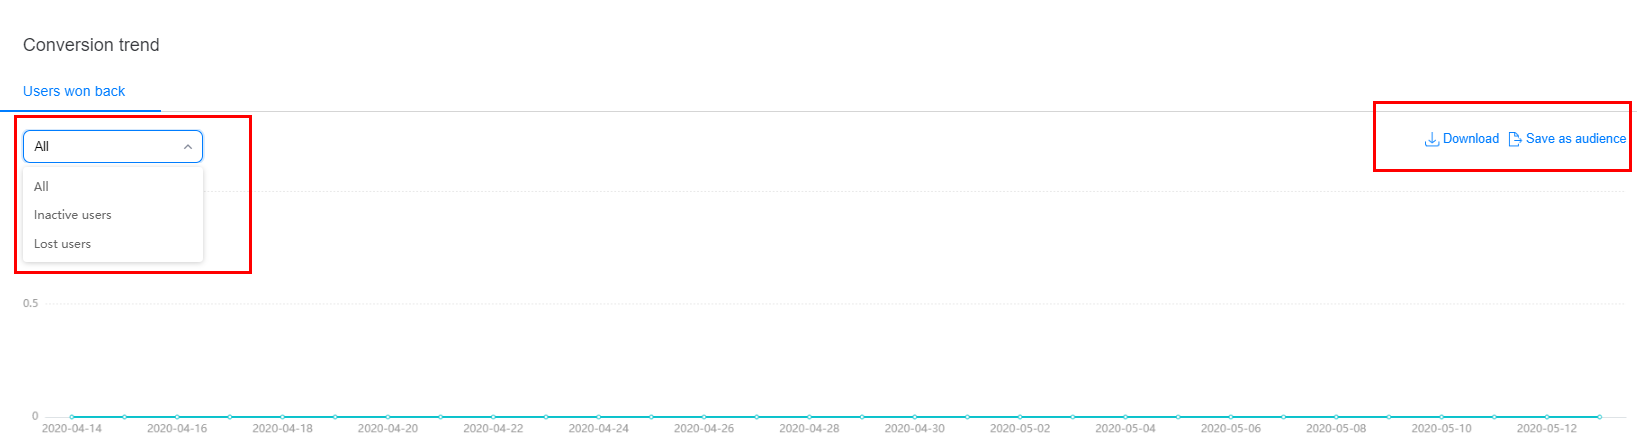
Click Download to download the data for personalized analysis.
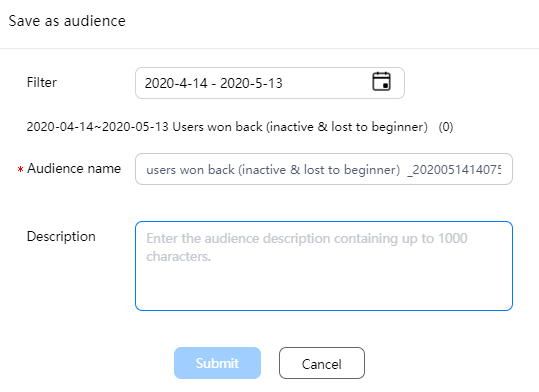
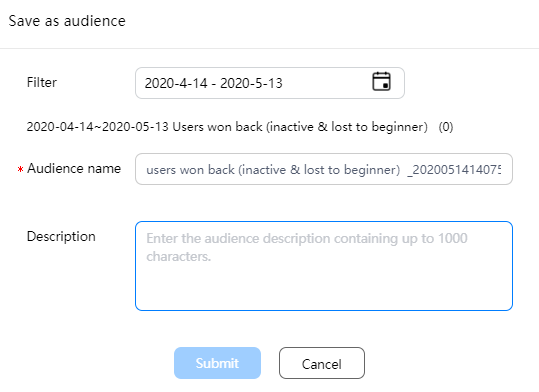
Click Save as audience to save users re-acquired in a certain period as audiences for further drill-down analysis or marketing.
The report also provides potential forecast and churn forecast of beginner users.
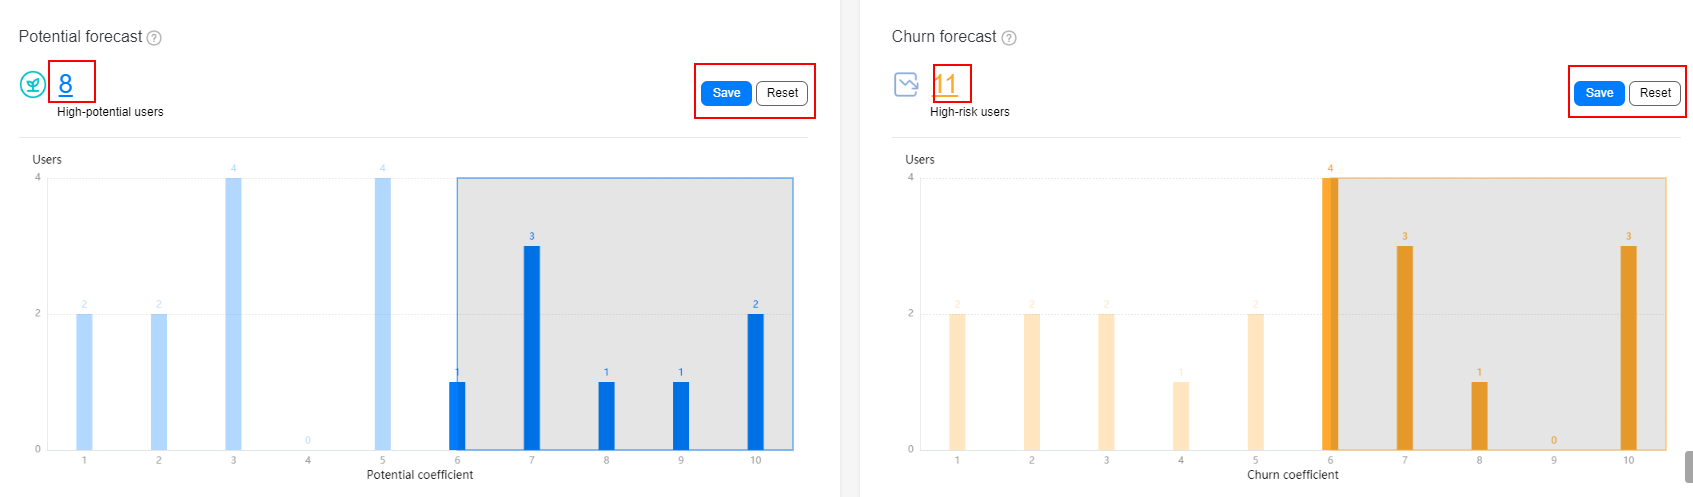
Potential forecast shows the potential for beginner users to convert to mature users. Churn forecast shows the risk that beginner users may convert to lost users.
A higher potential coefficient indicates a higher conversion probability, and a higher churn coefficient indicates a higher churn risk.
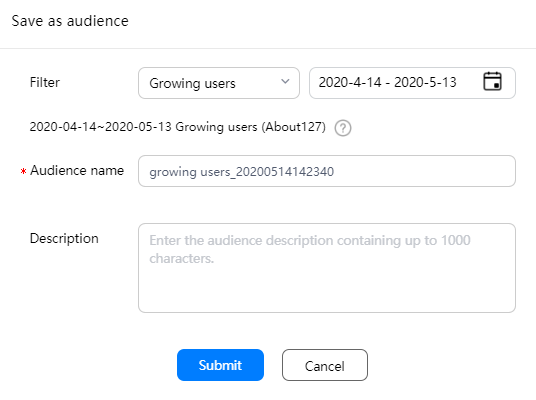
In the shadow areas of the preceding figure, users with high potential and high churn risks selected by algorithms are displayed. You can click the number of users in the upper left corner of each chart to save the users as audiences.
You can also drag the vertical axis to select high-potential or high-risk users and click Save to save the selected users. Click Reset to reset the forecast result to the default result calculated by the system algorithm.
For users in the growing phase, the value contribution should be the most concerning point. The data dashboard, trend analysis, composition analysis, and conversion trend analysis of users in the growing phase help you gain in-depth insight into user features in the growing phase and improve user value.
Usage
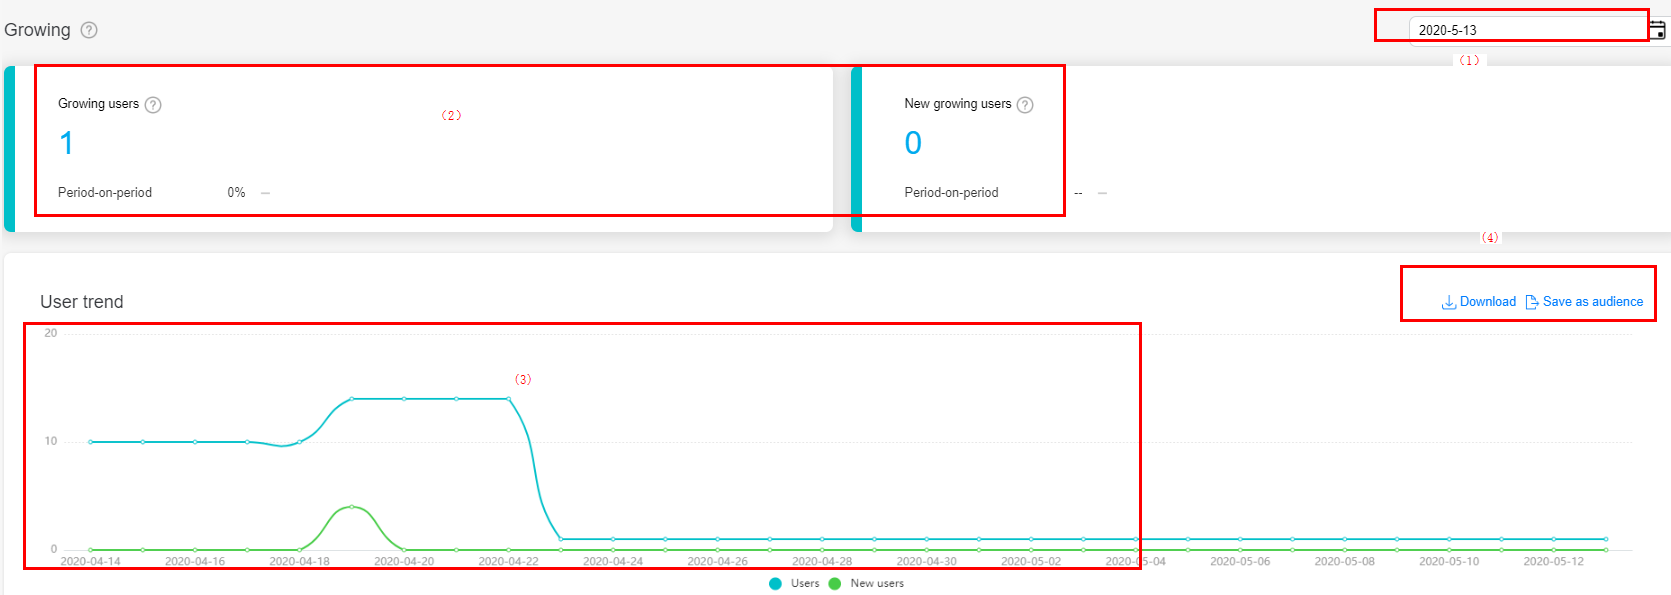
In area (1), click the date control to select a day in the last year for overview data and trend analysis.
In area (2), the dashboard displays all users and new users in the growing phase on the selected day and the period-on-period change.
In area (3), the trend chart shows the trend of all users, new users, and re-acquired users in the growing phase.
In area (4), click Download to download the data for personalized analysis.
In area (4), click Save as audience to save all users, new users, and re-acquired users in the beginner phase on a selected day as audiences.
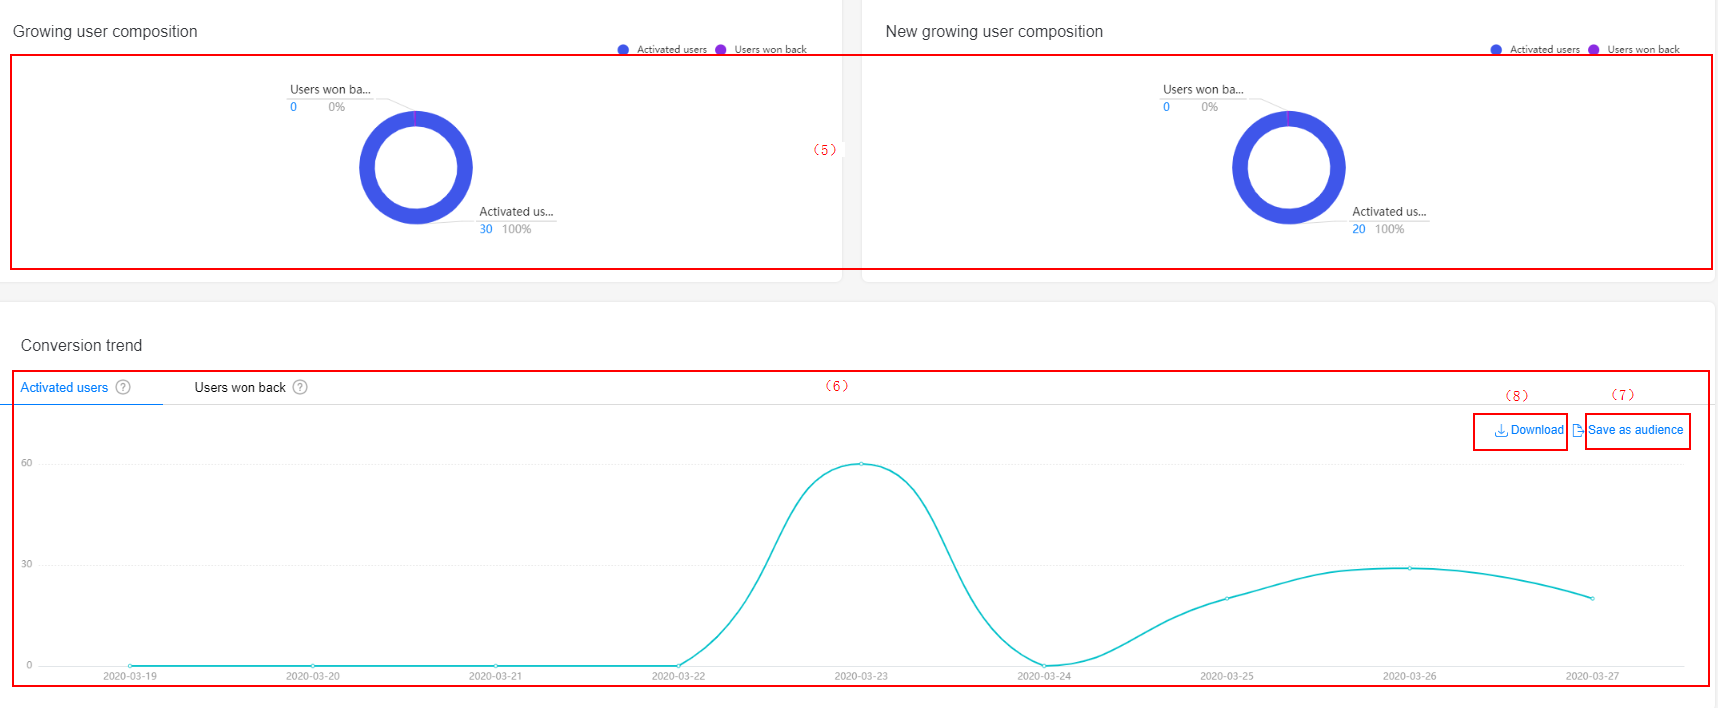
In area (5), the growing user composition chart shows the composition of all users and new users in the growing phase.
In area (6), the new growing user composition chart shows the trend of converting activated users and recalled users into growth users. You can click Save as audience in area (7) to save the activated users and recalled users of a day as audiences, and click Download in area (8) to download the trend chart for personalized analysis.
The report also provides potential forecast and churn forecast of growing users.
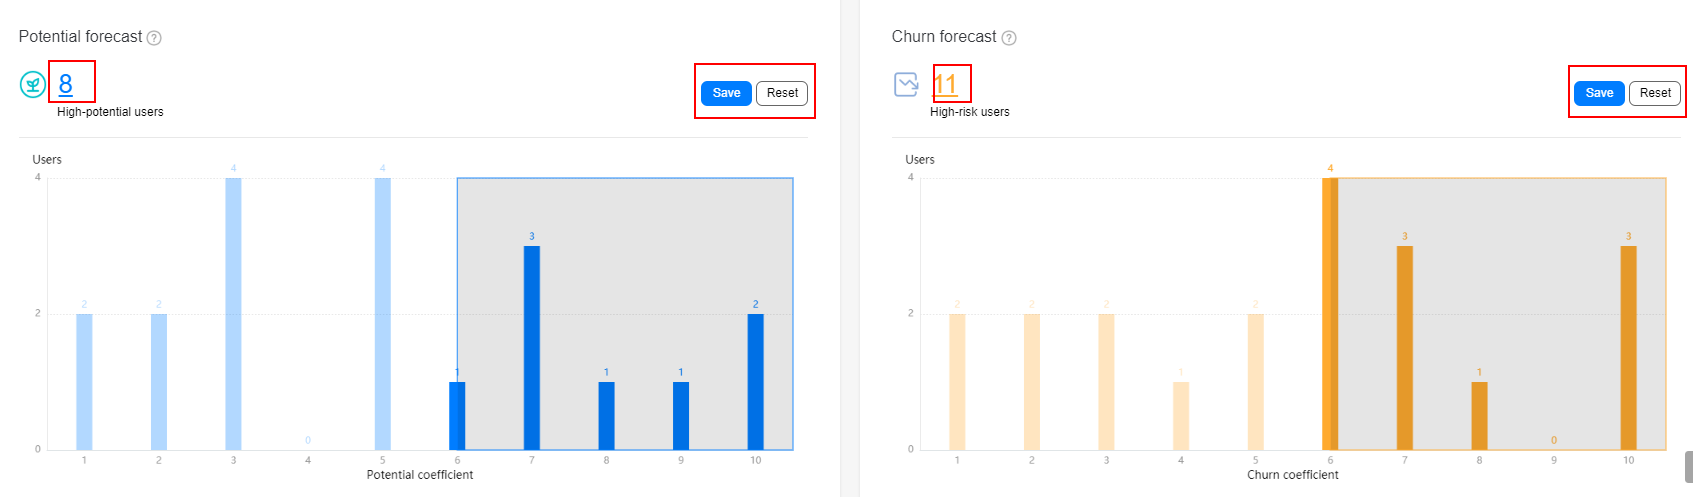
The potential forecast chart shows the potential for growing users to convert to mature users. The churn forecast chart shows the risk that growing users may convert to lost users.
A higher potential coefficient indicates a higher conversion probability, and a higher churn coefficient indicates a higher churn risk.
Users with high potential and high churn risks selected by algorithms are displayed in the shadow areas. You can click the number of users in the upper left corner of each chart to save the users as audiences.
You can also drag the vertical axis to select high-potential or high-risk users and click Save to save the selected users. Click Reset to reset the forecast result to the default result calculated by the system algorithm.
Users in the mature phase are the core assets of the app. Operations personnel need to pay attention to and improve the activeness of users in the mature phase so that they can continuously stay in the product and make value contributions.
The mature phase report provides the data dashboard, trend analysis chart, composition analysis, and conversion trend analysis of users in the mature phase, helping you understand the user growth, conversion, and user composition in the mature phase.
Usage
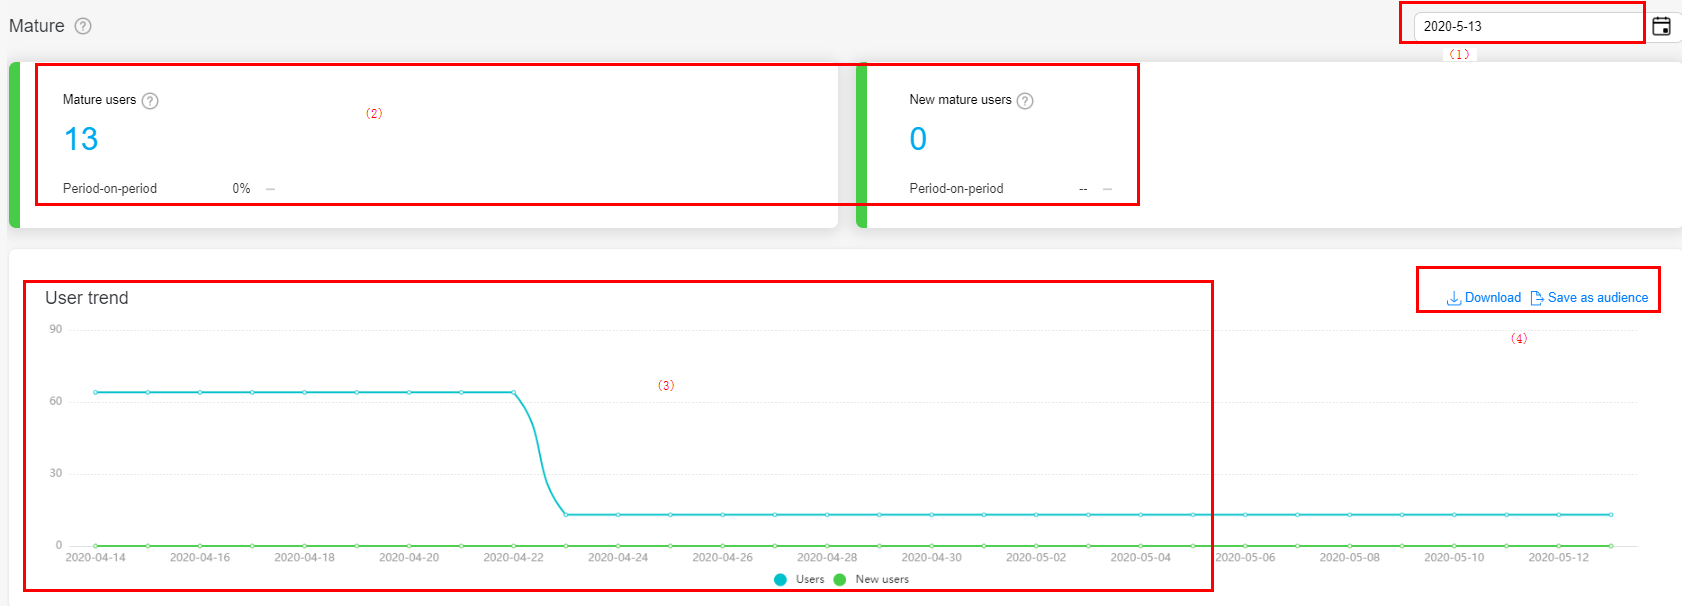
In area (1), click the date control to select a day in the last year for overview data and trend analysis.
In area (2), the dashboard displays all users and new users in the mature phase on the selected day and the period-on-period change.
In area (3), the trend chart shows the trend of all users, new users, and re-acquired users in the mature phase.
In area (4), click Download to download the data for personalized analysis.
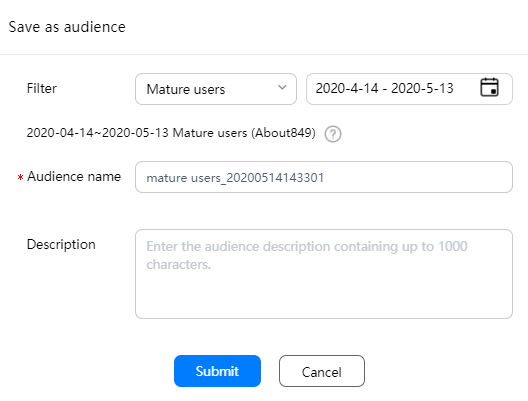
In area (4), click Save as audience to save all users, new users, converted users, and re-acquired users in the mature phase on a selected day as audiences.
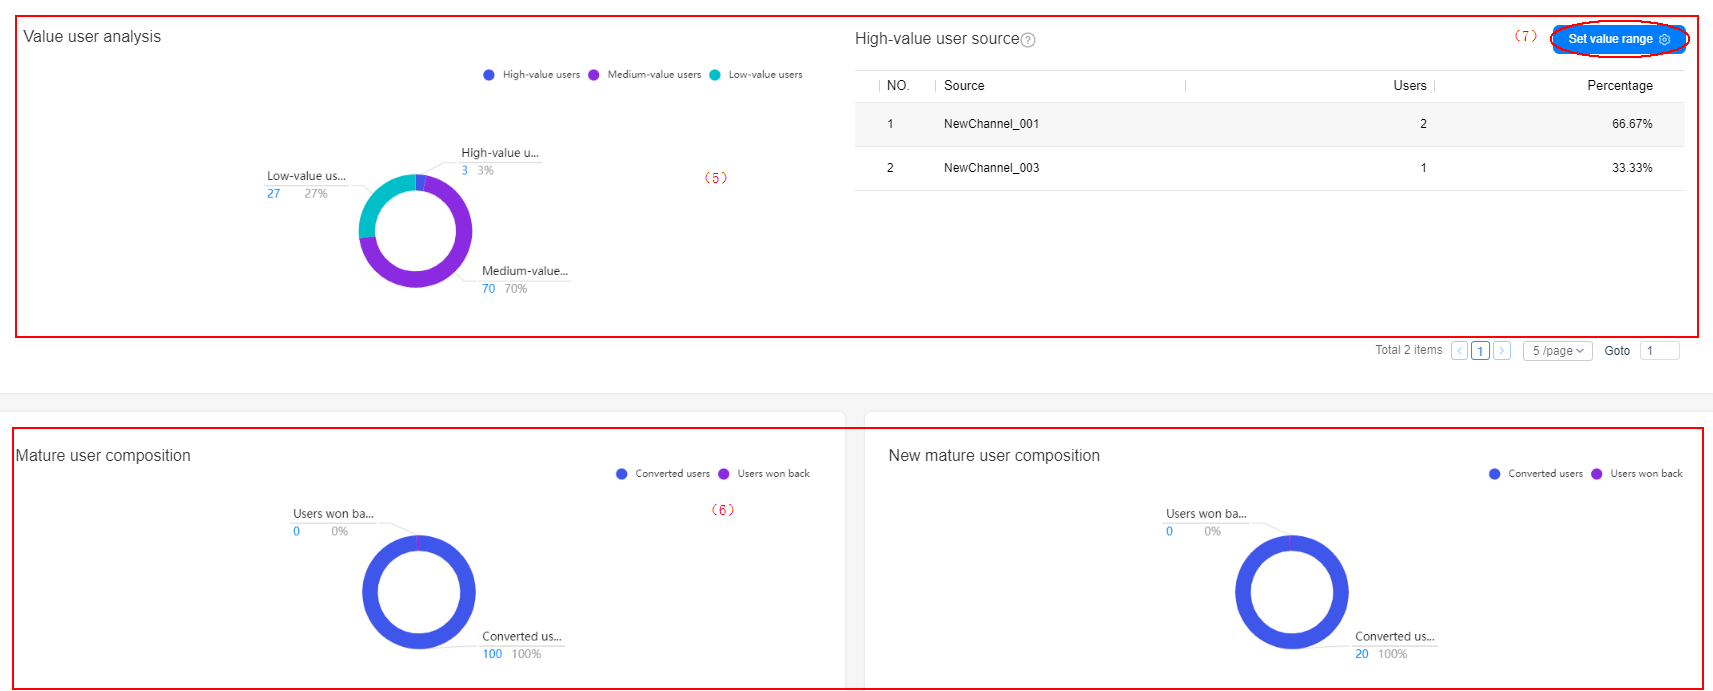
In area (5), the value user analysis chart shows the distribution of high-value, medium-value, and low-value users and the sources of high-value users.
In area (6), the mature user composition chart shows the composition of all users and new users in the mature phase.
In area (7), click Set value range to customize the calculation rules of high-value and medium-value users based on the average usage duration. Low-value users are calculated by subtracting high-value users and low-value users from mature users.
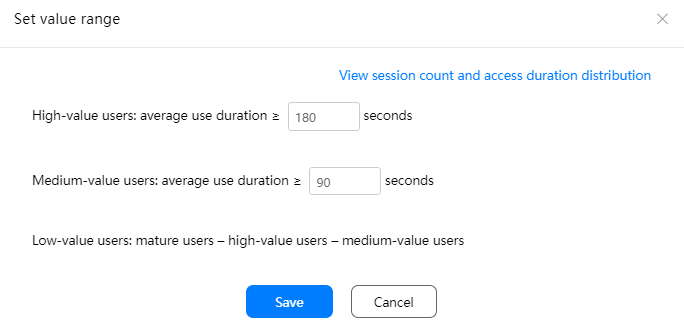
Click View session count and access duration distribution to view the comparison between the user activity of your app and that of the industry.
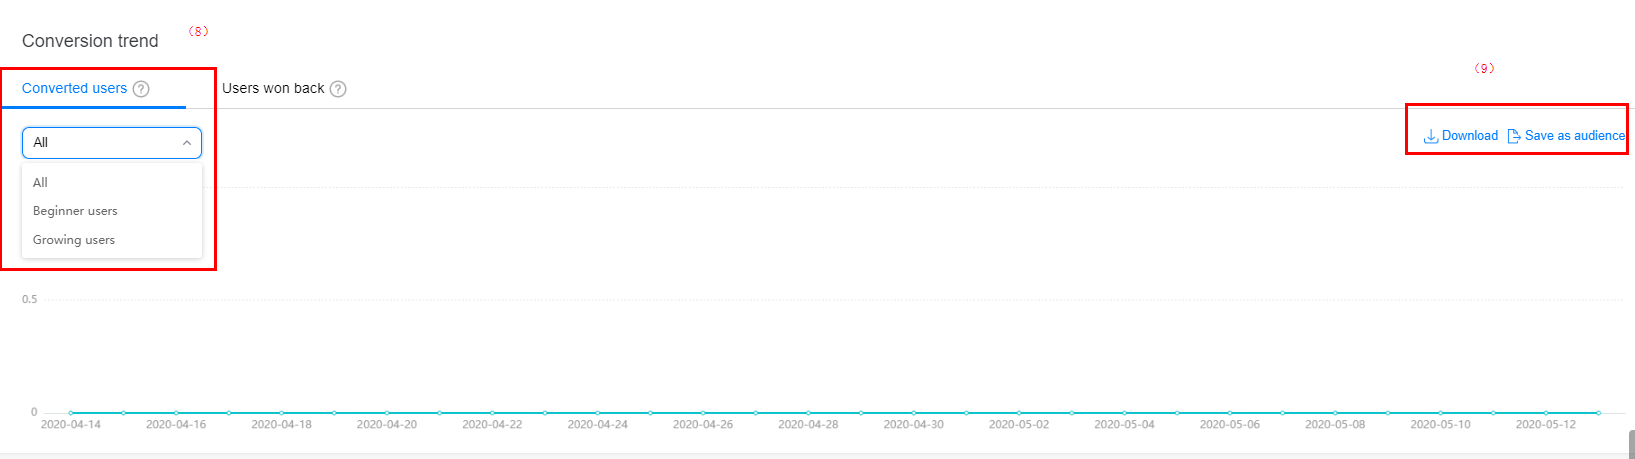
In area (8), the converted users chart shows the change trend of converted and re-acquired users in the mature phase.
In area (9), click Save as audience to save the converted or re-acquired users of a selected day as the audience.
For inactive users, operations personnel need to design re-acquisition activities based on the composition of inactive users, pay special attention to new inactive users, and push marketing activities in a timely manner. These users are most likely to be successfully re-acquired.
Usage
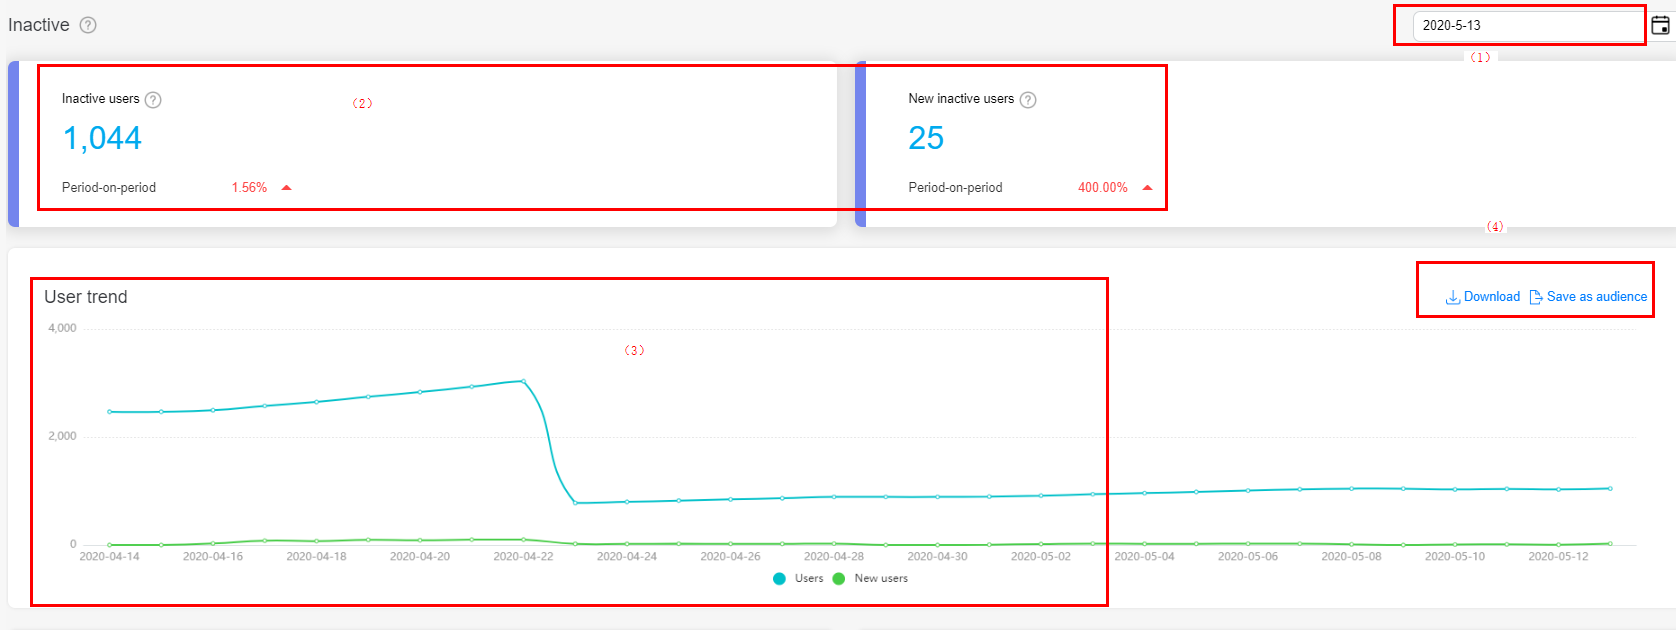
In area (1), click the date control to select a day in the last year for overview data and trend analysis.
In area (2), the dashboard displays all users and new users in the inactive phase on the selected day and the period-on-period change.
In area (3), the trend chart shows the trend of all users and new users in the inactive phase.
In area (4), click Download to download the data for personalized analysis.
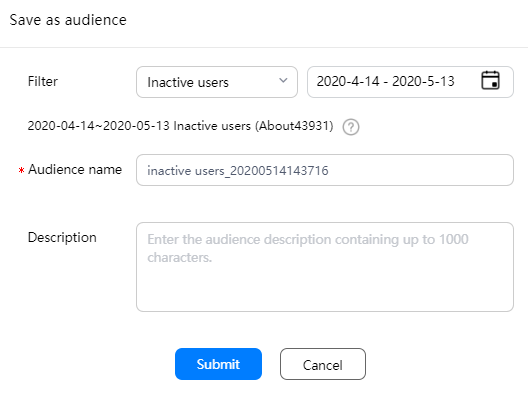
In area (4), click Save as audience to save all users and new users in the inactive phase on a selected day as audiences.
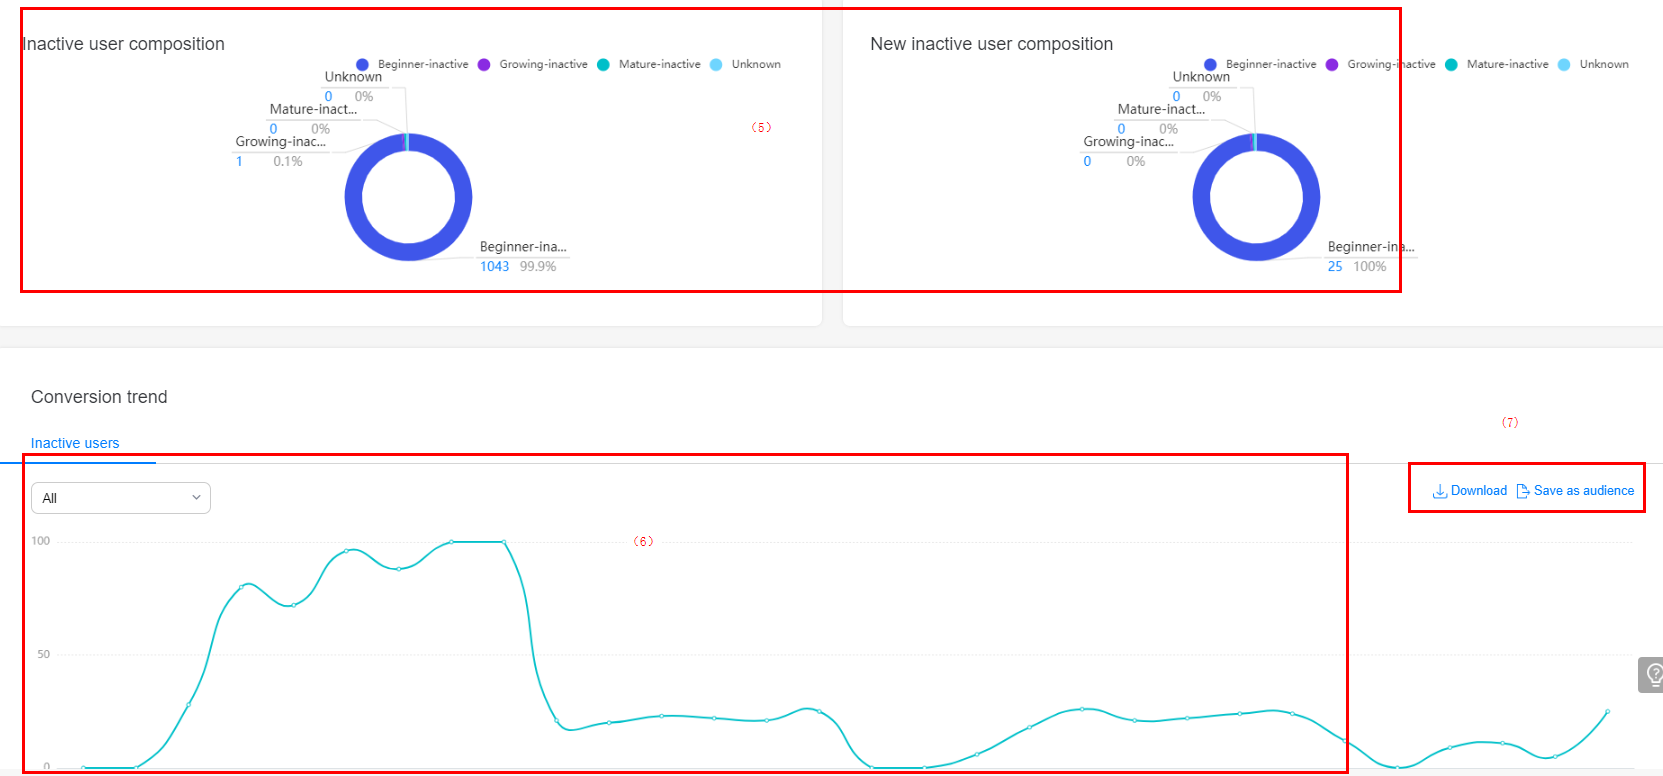
In area (5), the inactive user composition chart shows the composition of all users and new users in the inactive phase.
In area (6), the inactive users chart shows trend of converting users in the beginner phase, growing phase, and mature phase to users in the inactive phase.
In area (7), click Save as audience to save Beginner-inactive, Growing-inactive, and Mature-inactive users as audiences.
In area (7), click Download to download the data for personalized analysis.
The lost phase report provides data such as the data dashboard, trend analysis, and lost user source, with which operations personnel can re-acquire lost users or divert lost users to new products (if any).
Usage
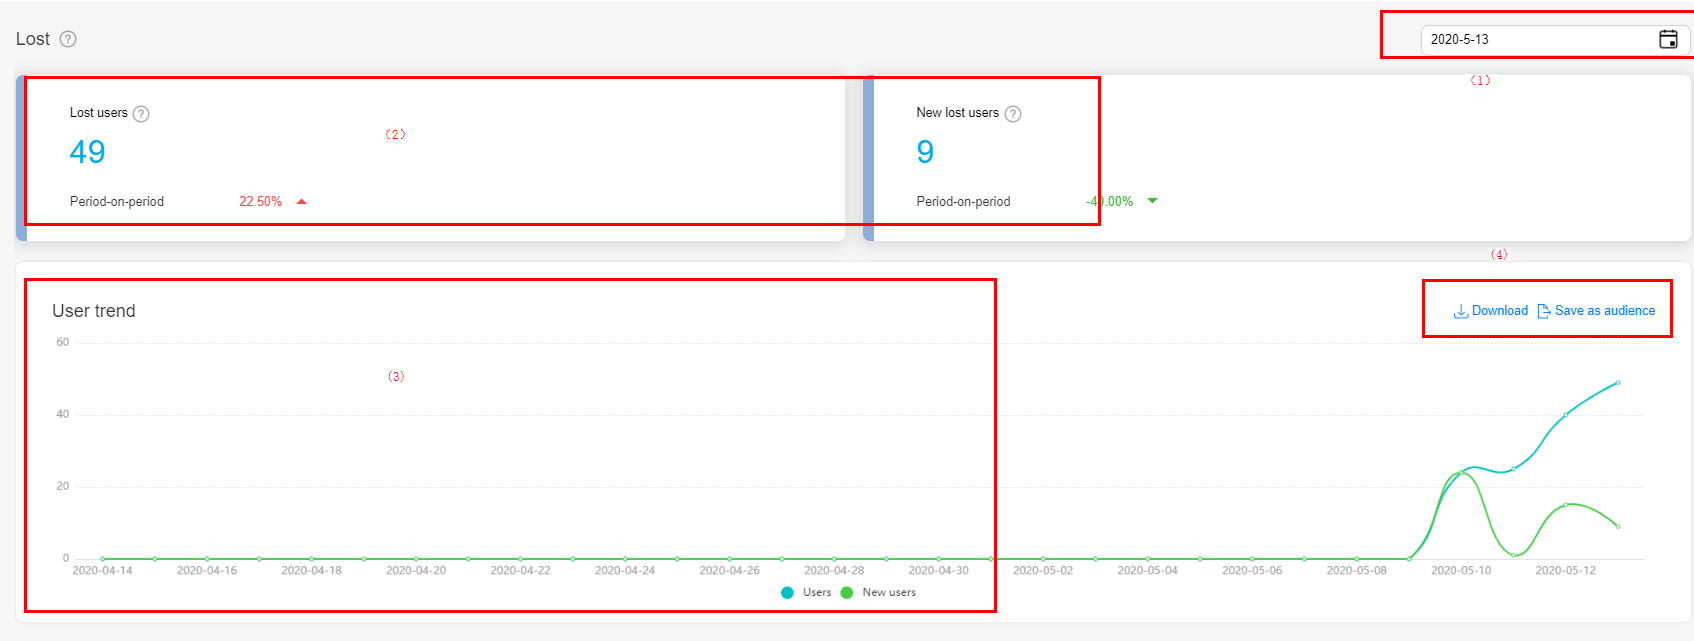
In area (1), click the date control to select a day in the last year for overview data and trend analysis.
In area (2), the dashboard displays all users and new users in the lost phase on the selected day and the period-on-period change.
In area (3), the trend chart shows the trend of all users and new users in the lost phase.
In area (4), click Download to download the data for personalized analysis.
In area (4), click Save as audience to save all users and new users in the lost phase on a selected day as audiences.
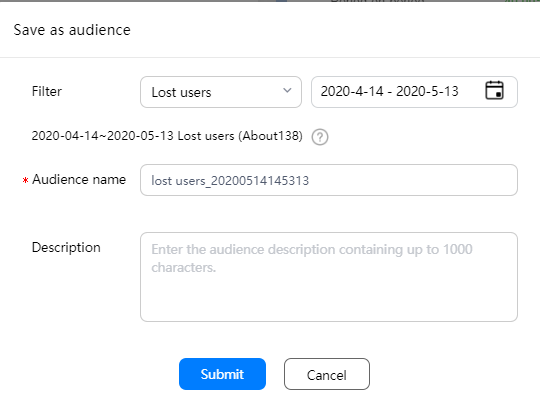
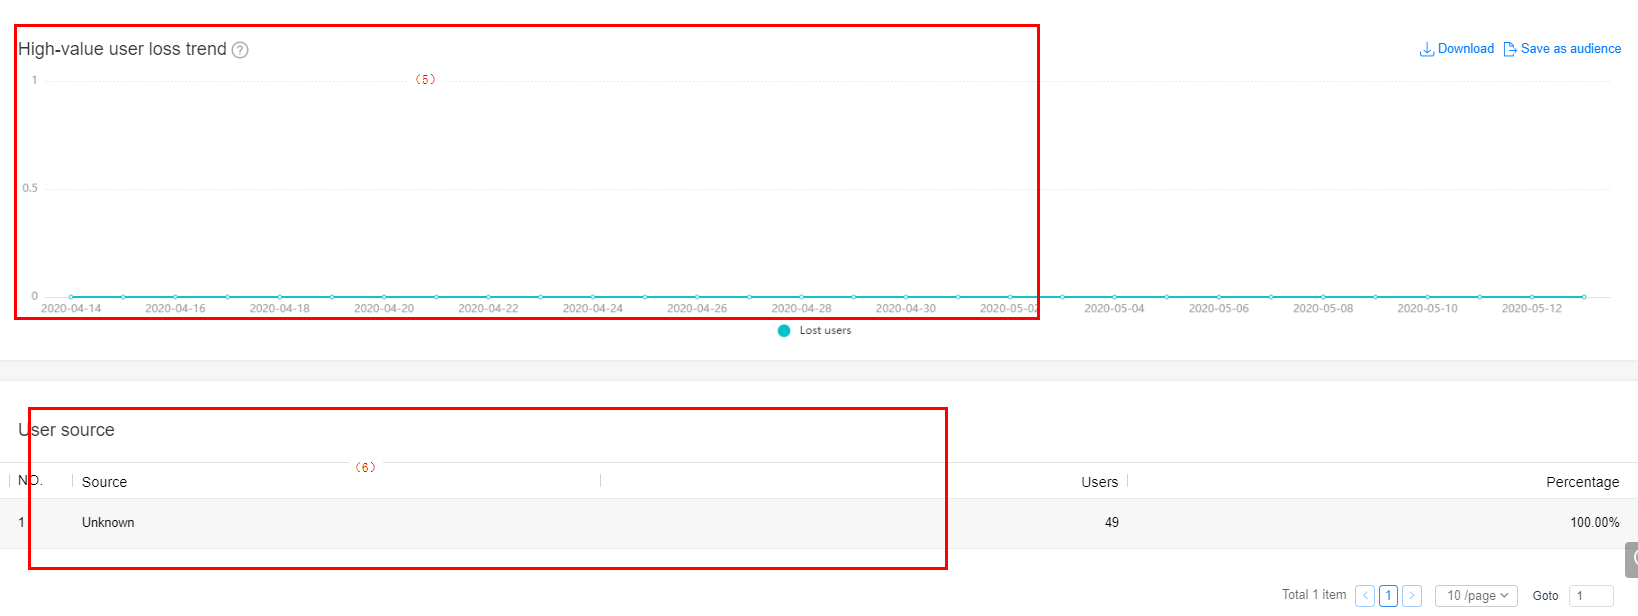
In area (5), the high-value user trend chart shows the loss trend of high-value users. You can click Download to download trend chart data for personalized analysis, or click Save as audience to save lost high-value users as audiences.
In area (6), the user source chart shows the sources of lost users, helping you determine the retention quality of app promotion channels.