
User analysis includes new users, active users, revisit users, and distribution by version. By analyzing users, you can understand the user royalty of a product and set promotion strategies accordingly.
Procedure
1. Sign in to AppGallery Connect and select "My projects".
2. Click the app for which you need to view analytics data.
3. Go to "Analyze > User analysis > New users".
1) Use the filter control and date control as needed to quickly filter data in the specified range.
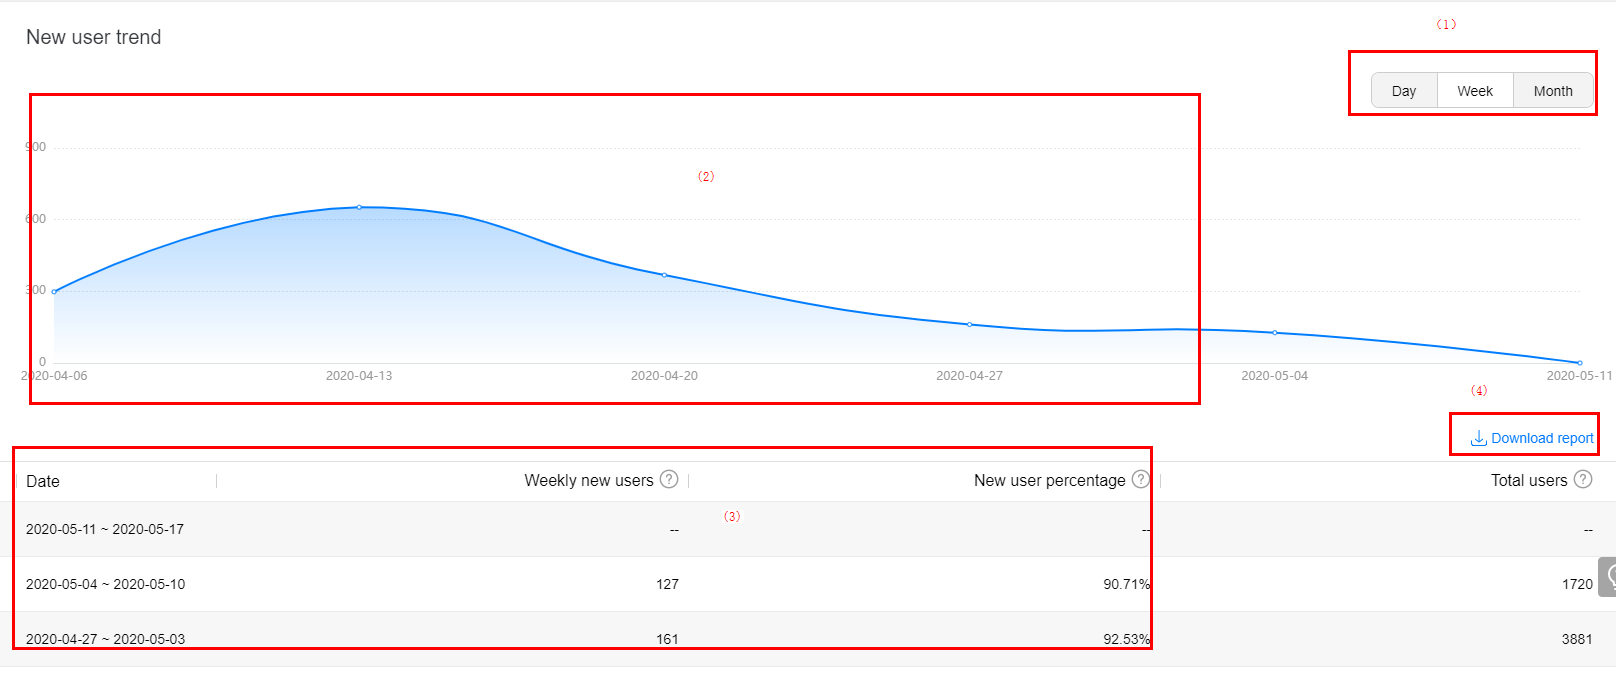
2) In area (1), view the trend of the number of new users by day, week, or month. You can then review the respective trend chart and new user details in area (2) and area (3).
3) In area (4), click Download table to download new user details for personalized analysis.
4. Perform comparison analysis on new users.
You can perform comparison analysis on new users by app type, app, user attribute, or industry. For example, you can compare the new user trend of different device brands or perform drill-down analysis for industry categories.
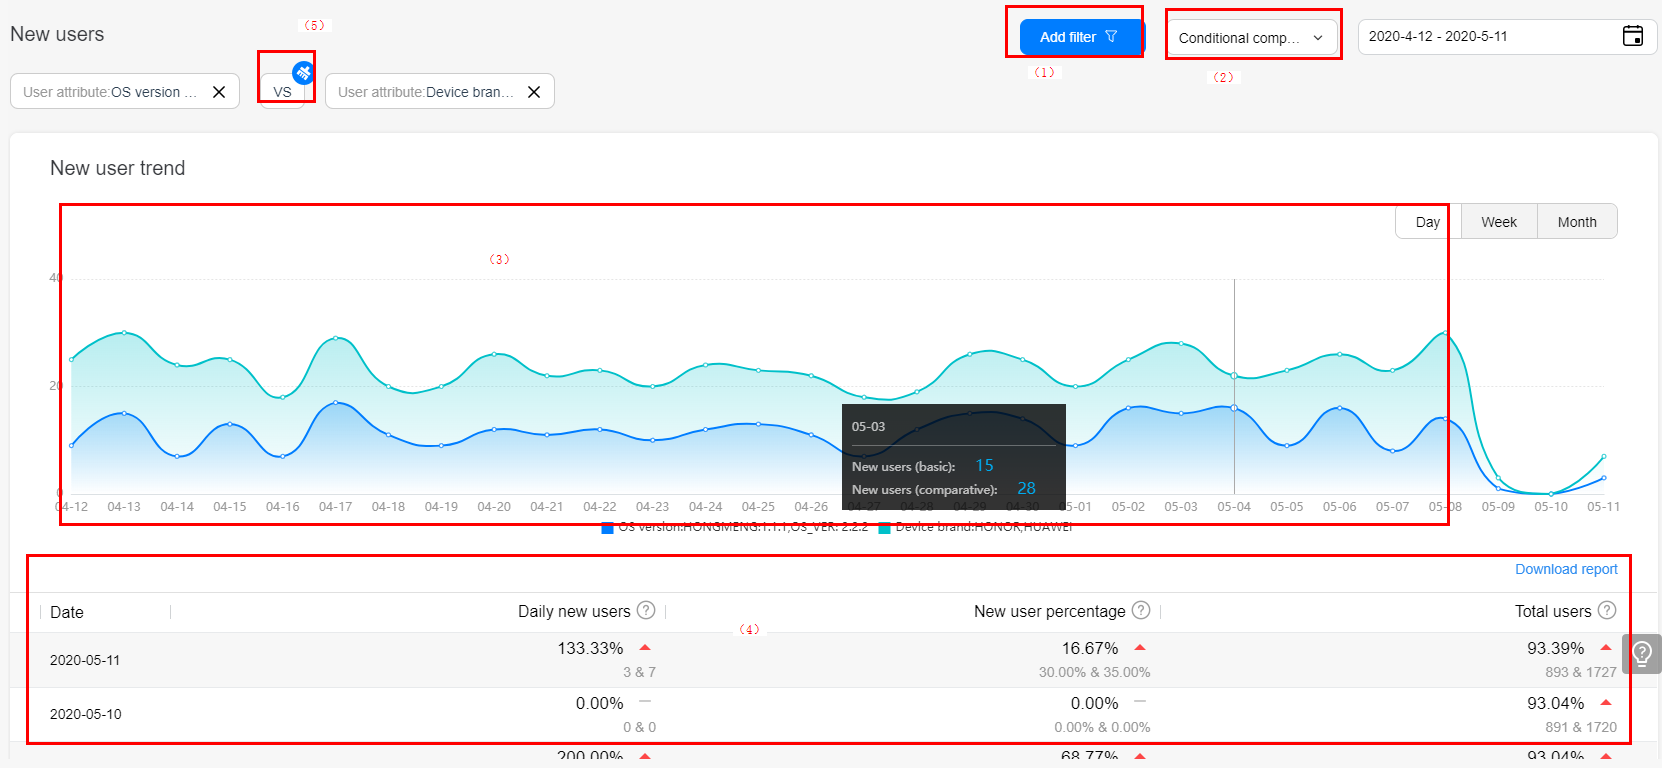
Select the filter criteria in area (1) and add comparison analysis conditions in area (2). Then, the comparison trends are displayed in the new user trend chart in area (3) and the comparison values are displayed in the table in area (4). To clear the comparison conditions, click VS in area (5).
If you add a comparison analysis condition without adding a filter condition, the trend chart displays the comparison between all users and the selected users.

Indicators:
Daily new users: Number of unique users who accessed an app on the day that the statistics were collected.
New user percentage: Percentage of new users in the total number of active users on the day statistics were collected.
Procedure
1. Sign in to AppGallery Connect and select "My projects".
2. Click the app for which you need to view analytics data.
3. Go to "Analyze > User analysis > Active users".
1) Use the filter control and date control as needed to quickly filter data in the specified range.

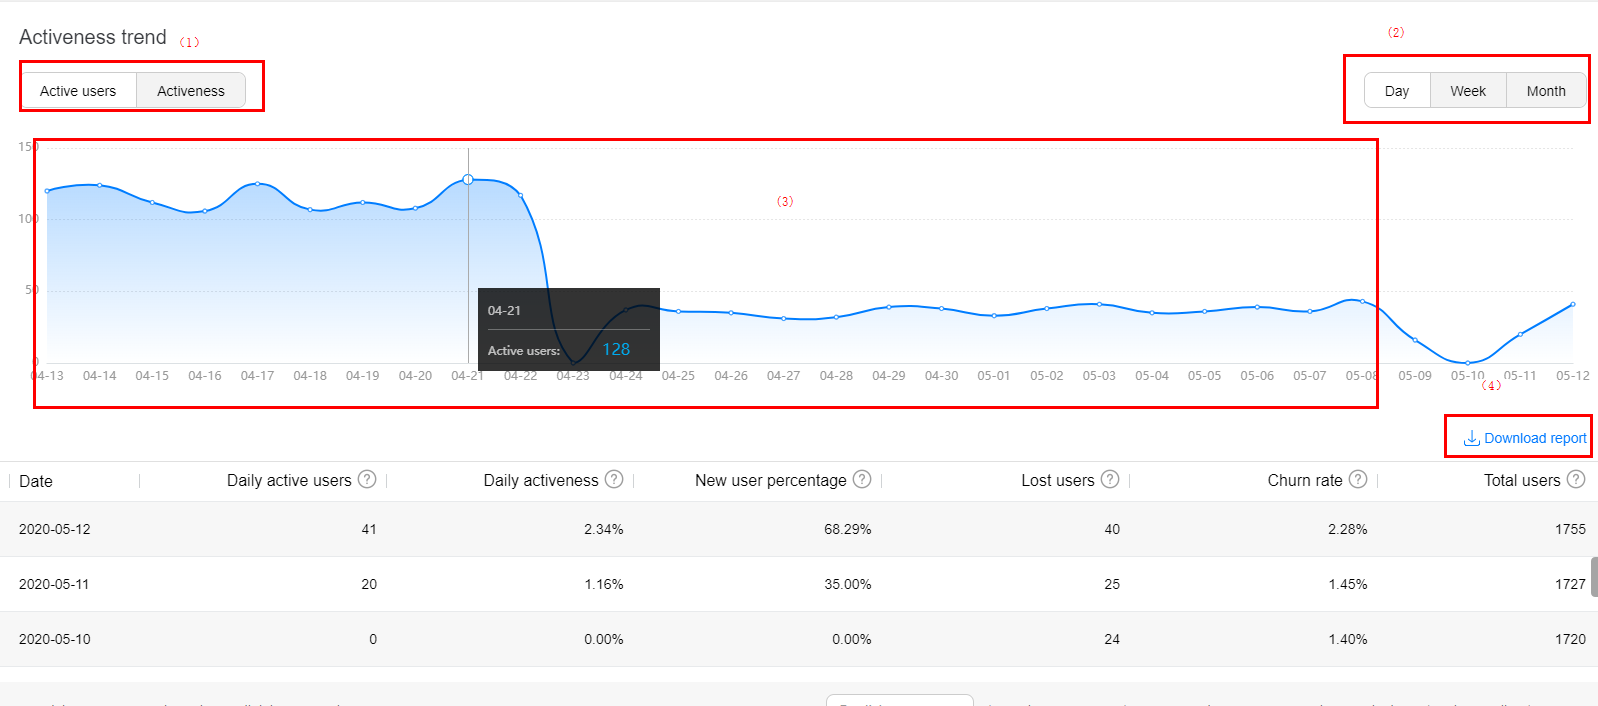
2) In area (1), view the trend analysis of the number of active users and activeness rate.
3) In area (2), view details by day, week, or month. In area (3), view the details of active users.
4) In area (4), click Download table to download new user details for personalized analysis.
4. Perform comparison analysis on active users.
You can perform comparison analysis on active users by app type, app, user attribute, or industry. For example, you can compare the active user trend of different device brands or perform drill-down analysis for industry categories.
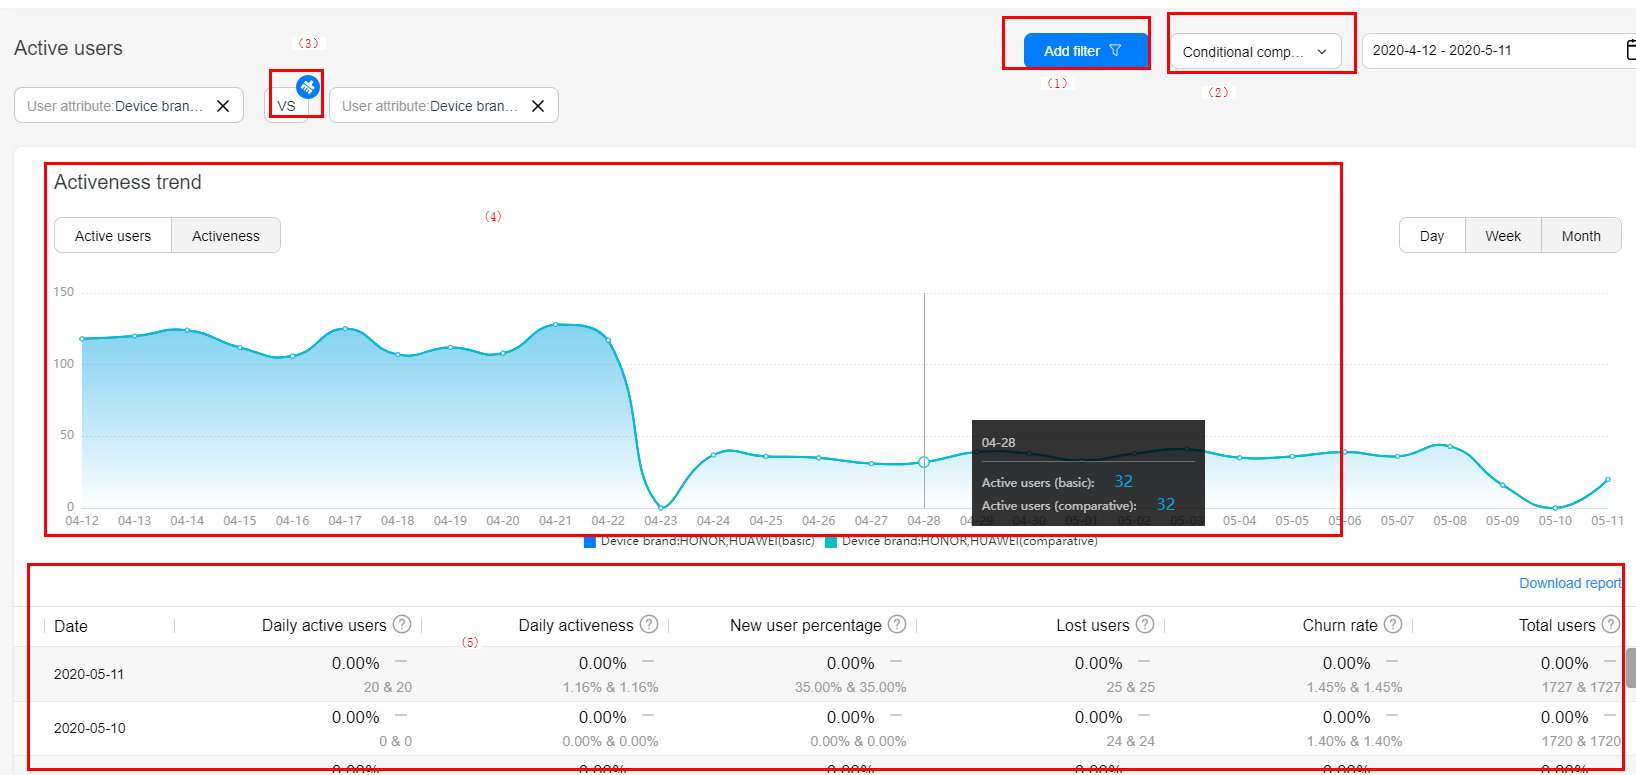
Select the filter criteria in area (1) and add comparison analysis conditions in area (2). Then, the comparison trends are displayed in the active user trend chart in area (4) and the comparison values are displayed in the table in area (5). To clear the comparison conditions, click VS in area (3).
If you add a comparison analysis condition without adding a filter condition, the trend chart displays the comparison between all users and the selected users.
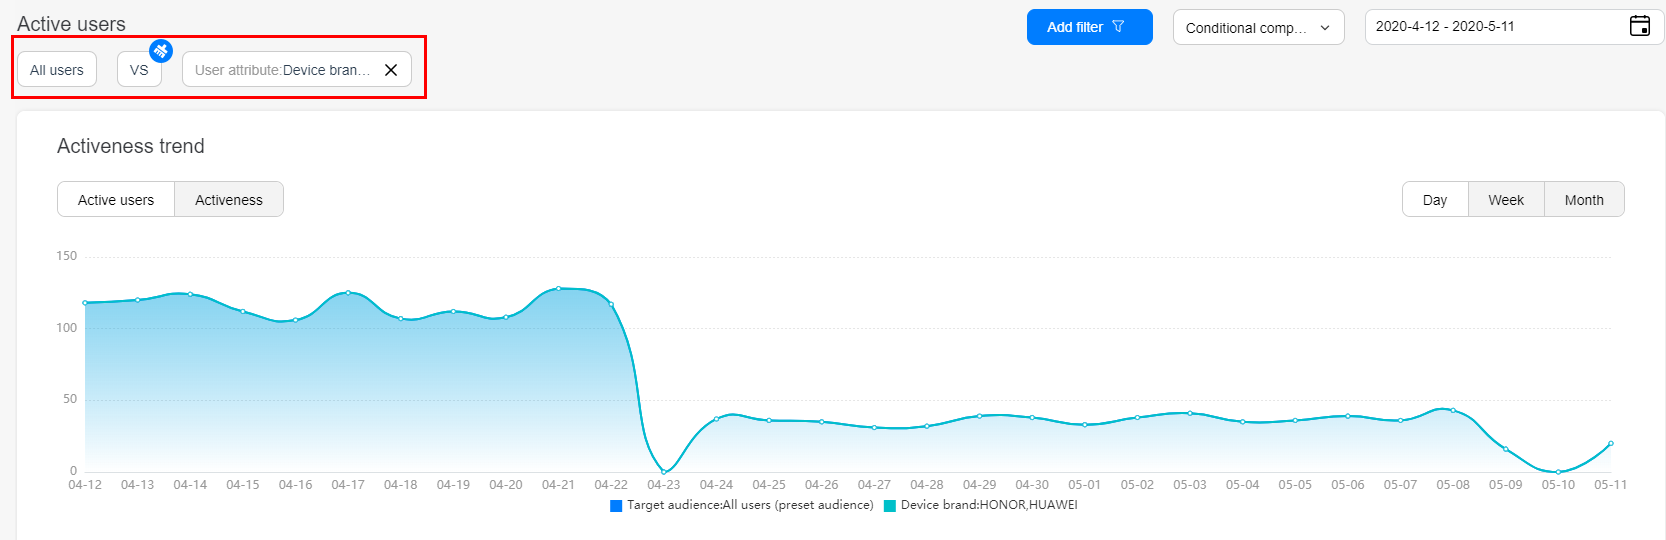
Indicators:
Lost users: Group of users who did not use the app in the last 3 months since the selected day but used the app in the last year.
Churn rate: Number of lost users since the selected day/Total number of users.
Daily activeness: Number of daily active users/Total number of users.
Daily activeness: Number of daily active users/Total number of users.
Number of active users in the selected month/Total number of users.
New user percentage: Percentage of new users in the total number of active users on the day statistics were collected.
Procedure
1. Sign in to AppGallery Connect and select "My projects".
2. Click the app for which you need to view analytics data.
3. Go to "Analyze > User analysis > Revisit users".
This area displays statistics on revisit users by the statistical period, helping you understand the attractiveness of your product to users.
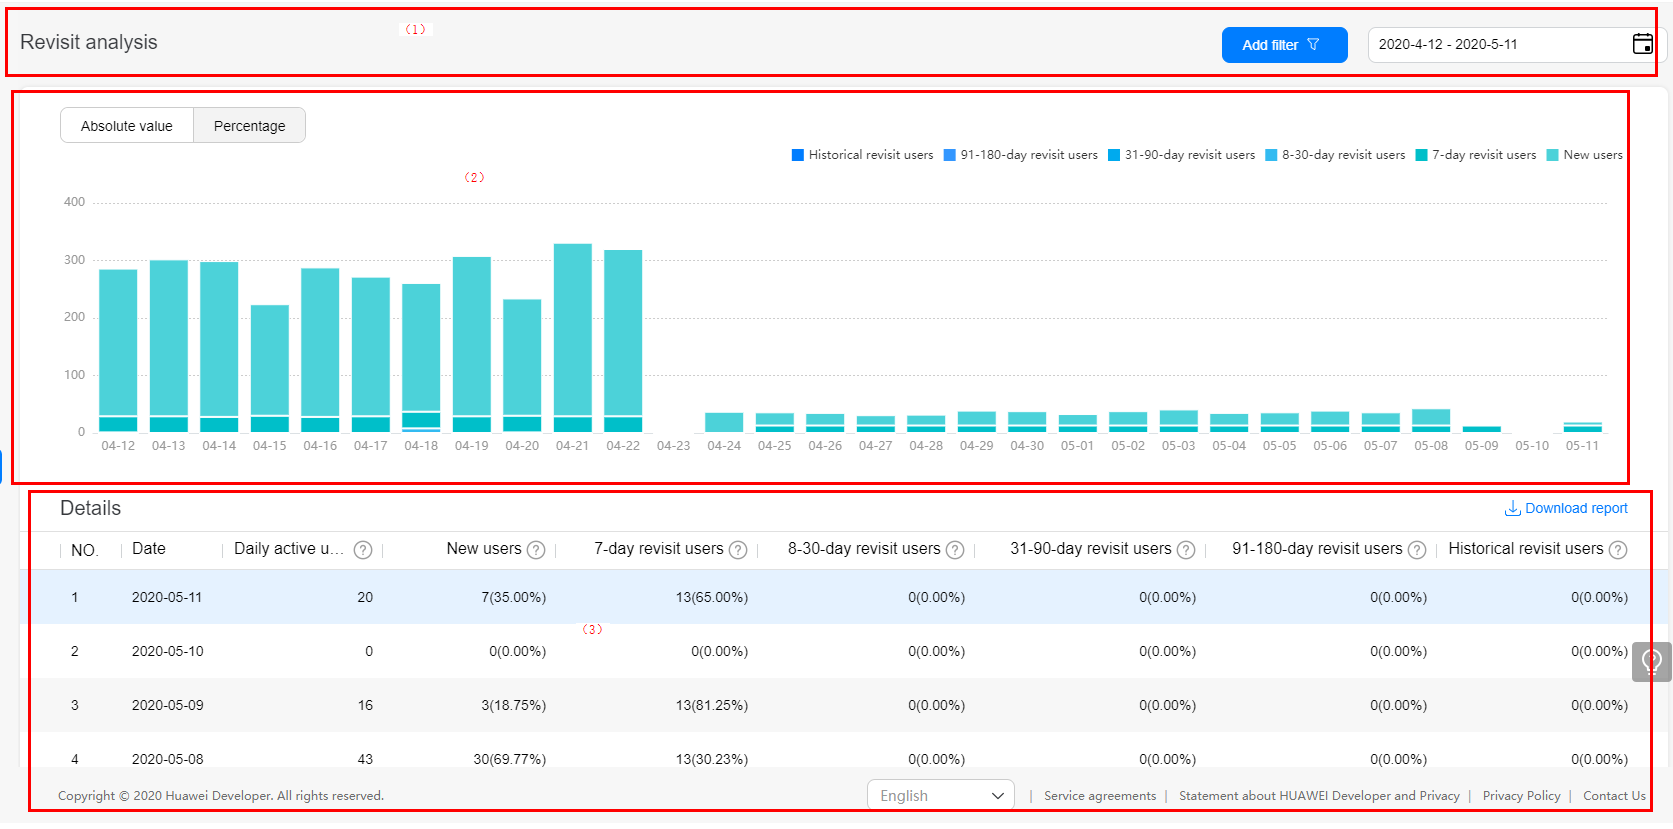
Use the filter control and date control as needed to quickly filter data in the specified range. For details about how to use the filter control and date control, please refer to Project overview.
In area (2), view the comparison analysis chart of each indicator. Indicators can be compared by percentage or absolute value.
In area (3), view details about each indicator. You can click Download table to download revisit user details for personalized analysis.
The version distribution report displays the app adoption rate, user engagement, and stability, helping you optimize version release policies.
Real-time dashboard
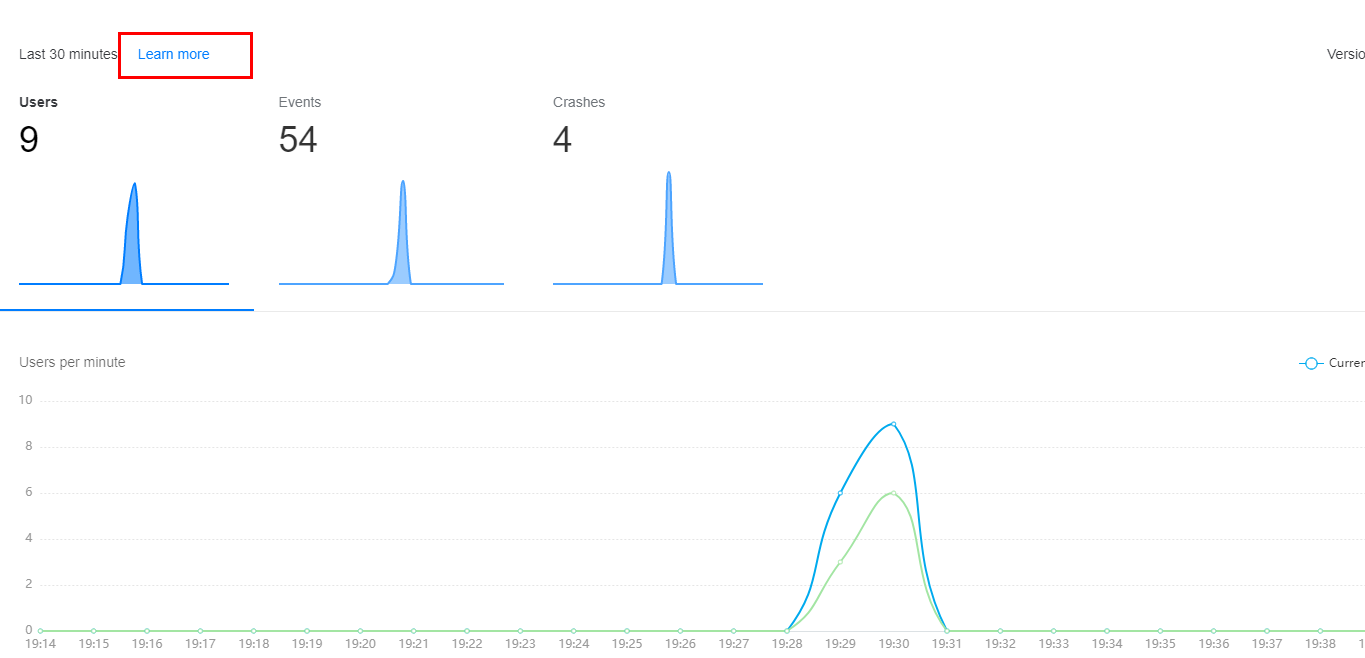
You can select the desired version from the Version drop-down list to view the adoption rate and stability of the app version in the last 30 minutes. Click Learn more if you want to view real-time analysis details, including event analysis and user analysis.
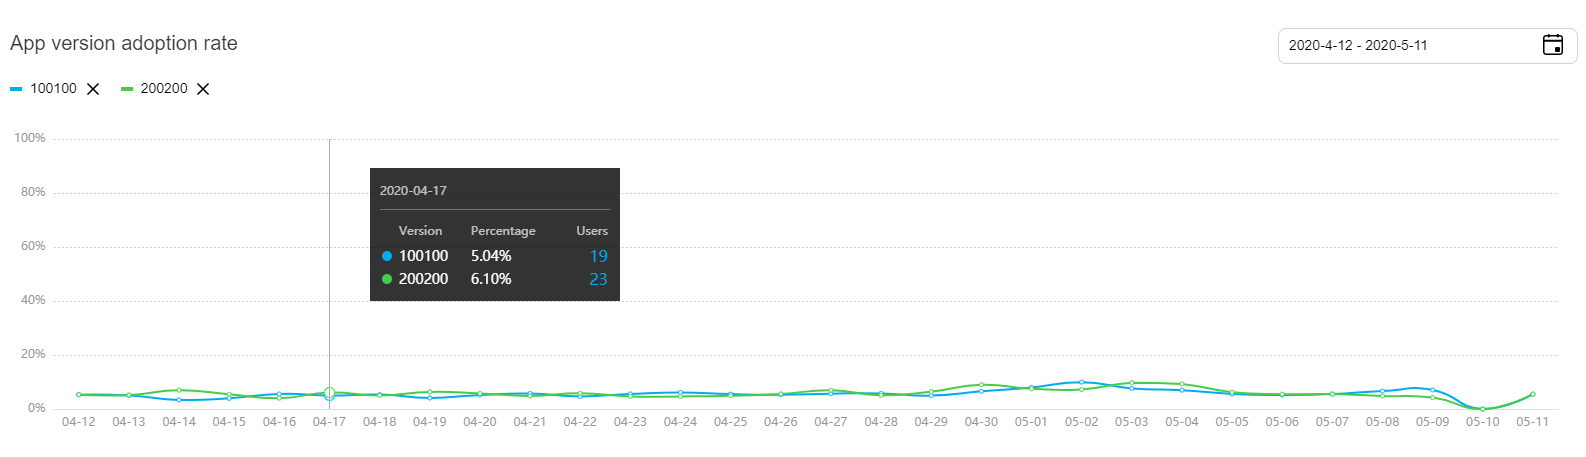
App version adoption rate
By default, this area displays the adoption rate trend of top 5 app versions with most users. You can use the date control to set the time range.
App version details
This area displays the number and percentage of active users, average activity interval, average page access times, average session times, number of crashes, number of affected users, crash rate, and status of each version on the statistical day, helping you understand the user activeness of each version.

Active users: Number of unique users who accessed an app on the day that the statistics were collected.
Active user percentage: Percentage of active users of a version in the total number of active users on the day that the statistics were collected.
Average activity interval: Sum(Total number of days between the day that the statistics were collected and the last active day for active users on the day that the statistics were collected)/Number of active users on the day that the statistics were collected.
Page access times: Sum(Total number of app pages accessed by users on the day that the statistics were collected)/Number of active users on the day that the statistics were collected.
Sessions: Sum(Total number of app access sessions on the day that the statistics were collected)/Number of active users on the day that the statistics were collected.
Access duration: Sum(Total session duration of active users on the day that the statistics were collected)/Number of active users on the day that the statistics were collected.
Crash: Number of app crashes.
Affected users: Number of users affected by crashes in a specified period.
Crash rate: Number of crashes/Number of startups.
Startup: Number of app startups.
Status: Version status defined based on the version release time, adoption rate of daily active users, and adoption rate increase.
① Successfully released: The adoption rate of daily active users is greater than 10%.
② Previously released: The version has been released for more than 15 days, and the adoption rate of daily active users is greater than 10%.
③ Being released: The adoption rate of daily active users has increased by more than 2% since the first day of release.
④ Low adoption rate: Since the first day of release, the adoption rate of daily active users has not increased by more than 2% and has never reached 10%.