User behavior analysis includes event analysis, page analysis, activity analysis, session path analysis, and launch analysis.
Event analysis: Displays the event overview and event analysis details, such as the event trend, event source model distribution, and event source system version distribution.
Page analysis: Displays the access trend, access depth, and stay duration of different pages in an app to determine the importance of each page and provide data support for page optimization strategies.
Launch analysis: Displays the number of launch times and time segments, and compare the data with the industry benchmark for further analysis.
Session path analysis: Displays the behavior paths of users in apps and provides product managers and operations personnel with key data about user actions in apps and the process of leaving apps.
Activity analysis: Displays the user activity, which is a key indicator for product stickiness and health. Through activity analysis, you can understand users' dependency on your product.
Procedure
1. Sign in to AppGallery Connect and select "My projects".
2. Click the app for which you need to view analytics data.
3. Go to "Analyze > User Behavior > Event analysis".
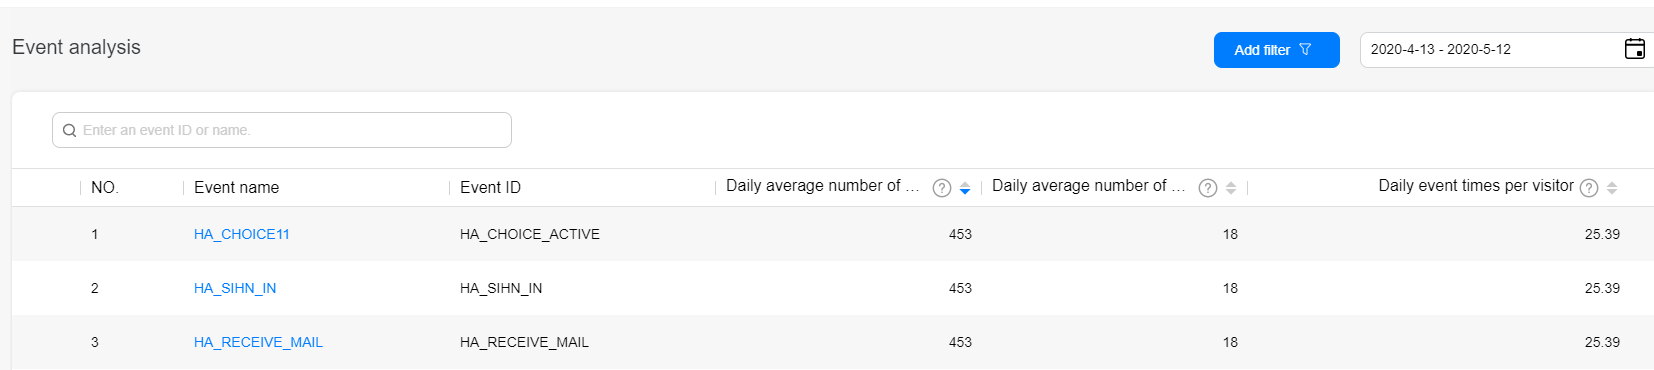
You can view the list of all events, including the event name, event ID, daily average number of events, daily average number of users, and daily average event times.
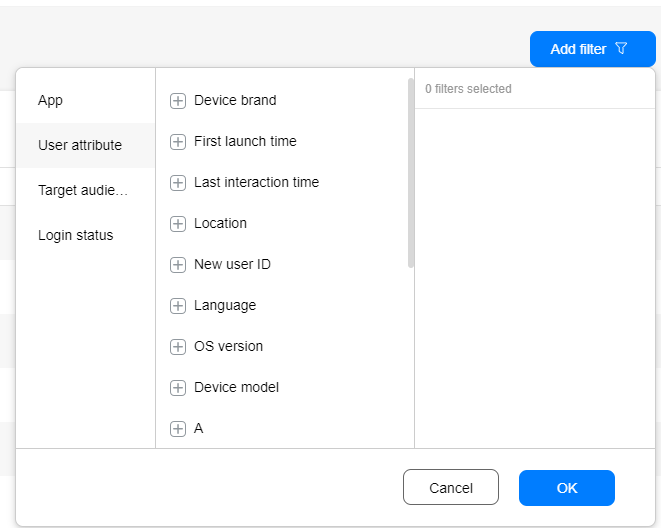
Filter: Filters events by app type, app category, user attribute, and audience.
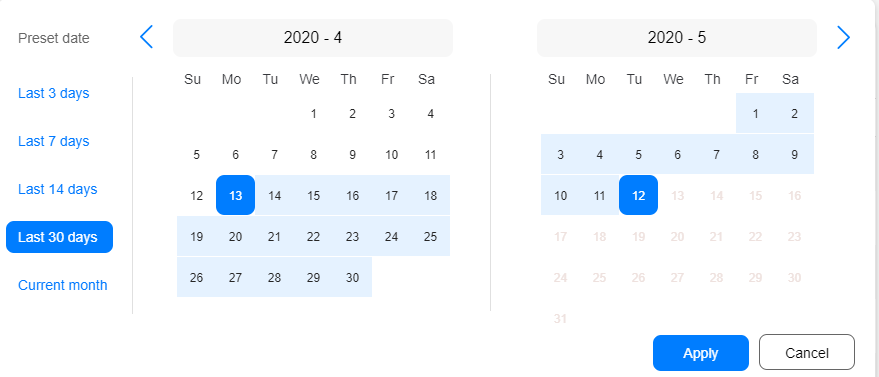
Date: Filters events by time range.
Viewing event details (daily update)
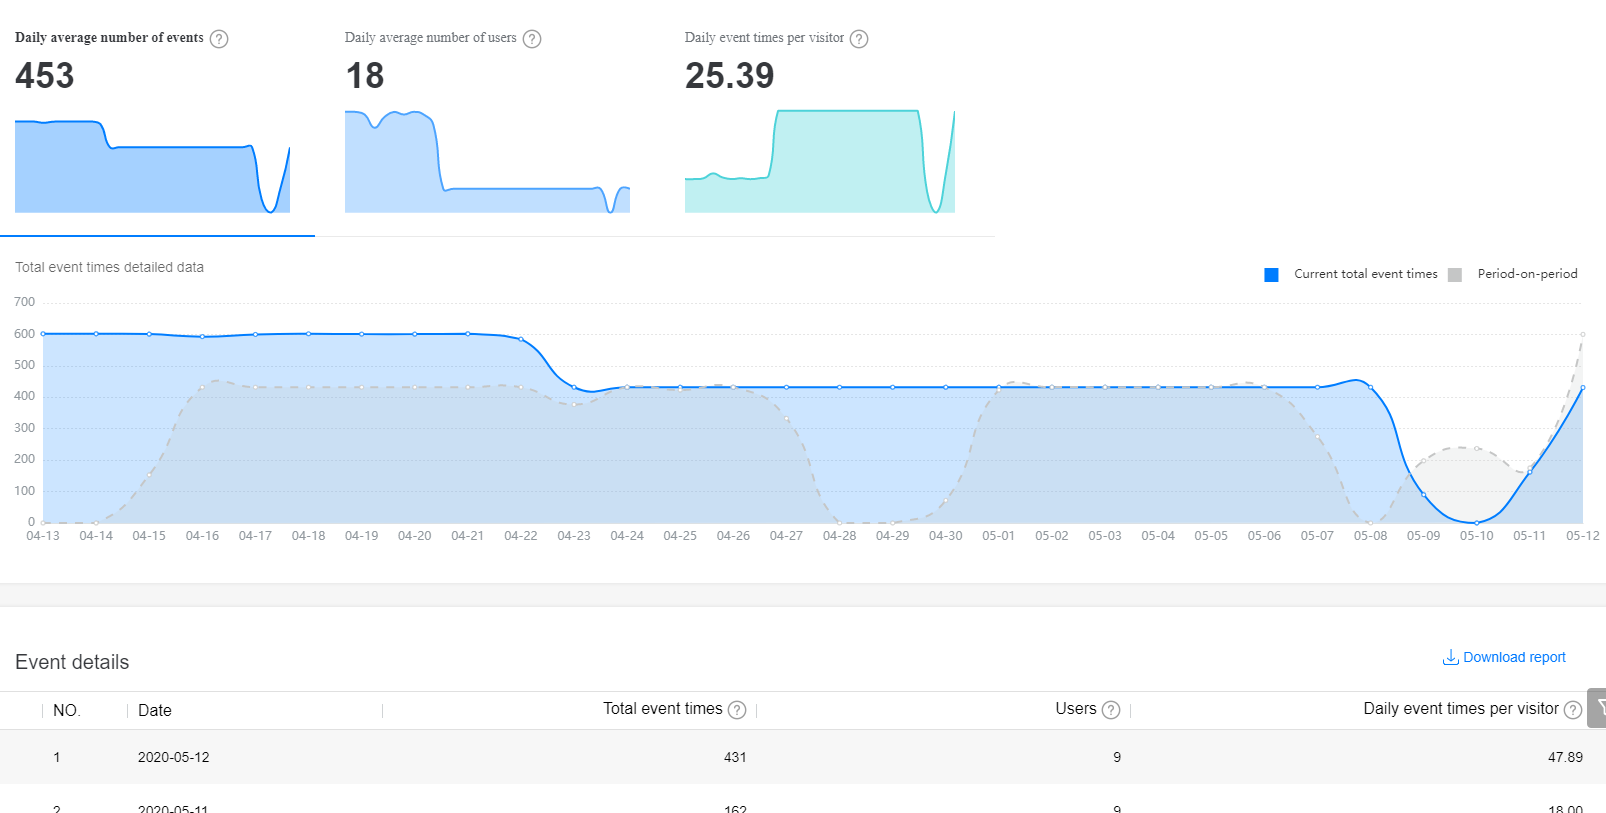
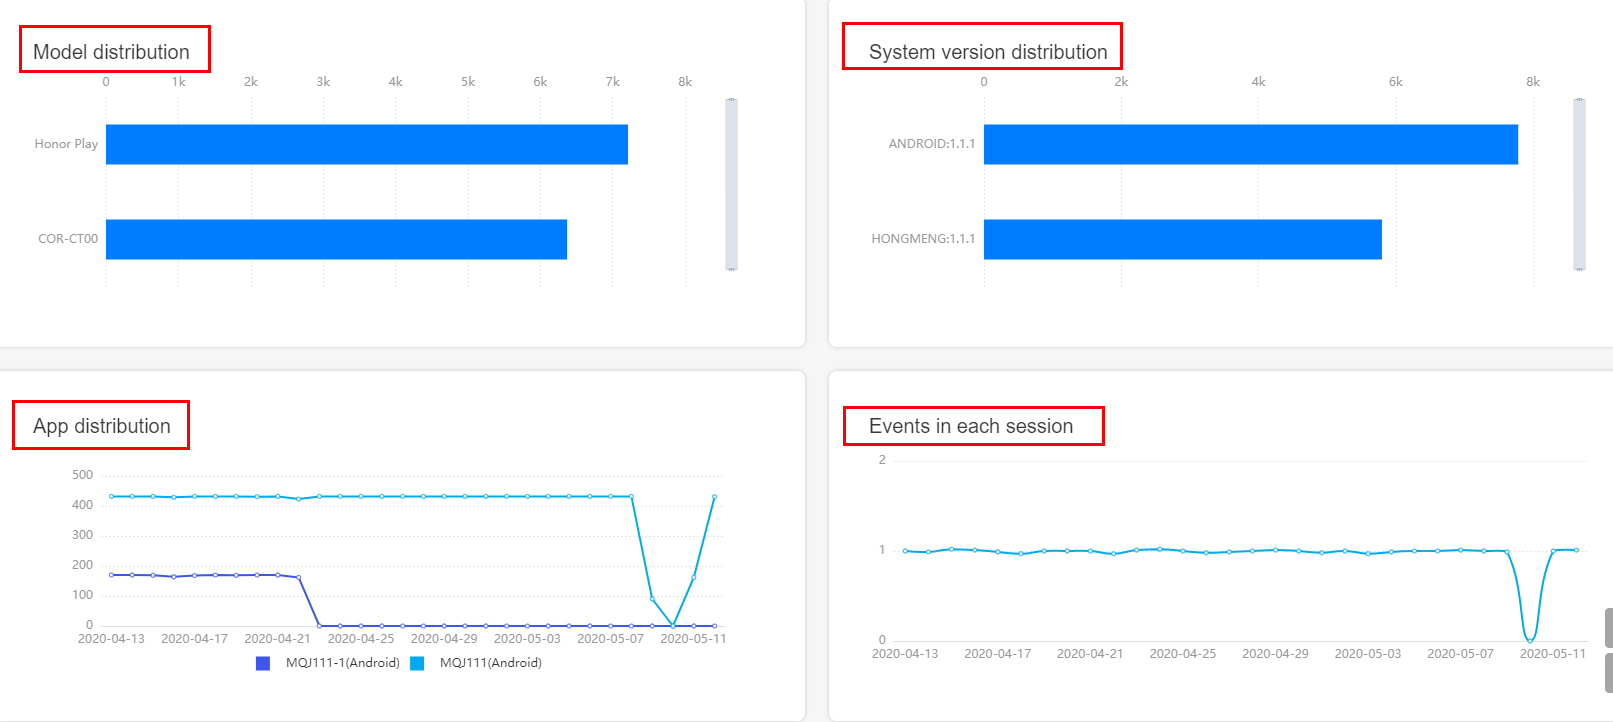
You can click an event to view its details, including the real-time trend, historical trend, distribution of custom parameters, and default indicator analysis (app version distribution, model proportion distribution, OS version distribution, and number of events per session).
Except for real-time trend that is updated every minute, other indicators are updated every day.
Use the filter control and date control in area (1) to quickly filter data in the specified range. For details about how to use the filter control and date control, please refer to Project overview. Use the event selection drop-down list box in area (2) to quickly select the events to be analyzed.


Real-time trend
Through the real-time trend indicator, you can:
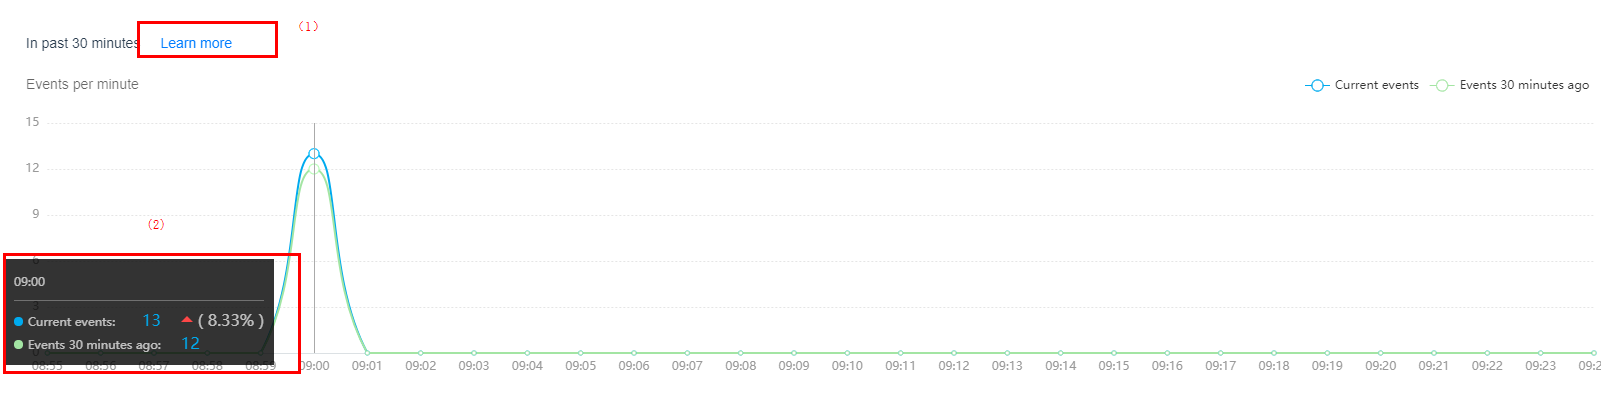
View the change trend of event quantity per minute in the last 30 minutes.
Compare the event quantity per minute with the event quantity 30 minutes ago, as shown in area (2).
Click Learn more to analyze the event in real time. For details, please refer to Real-time monitoring.
Historical trend
Through the historical trend indicator, you can:
View the change trend of number of daily average number of events, daily average number of users, and daily average event times in the specified time range.
View daily details about the number of events, number of users, and event times in a specified time range.
Default indicator analysis
By default, HUAWEI Analytics Kit provides the following analysis indicators: model distribution, system version distribution, app distribution, and number of events per session.These indicators enable you to quickly understand the performance of concerned events among different audiences.
Custom parameter distribution
In addition to default indicator analysis, you can also specify event parameters for analysis. This allows you to gain deeper insights into your users. For details about how to specify parameters to be analyzed, please refer to Event Management.
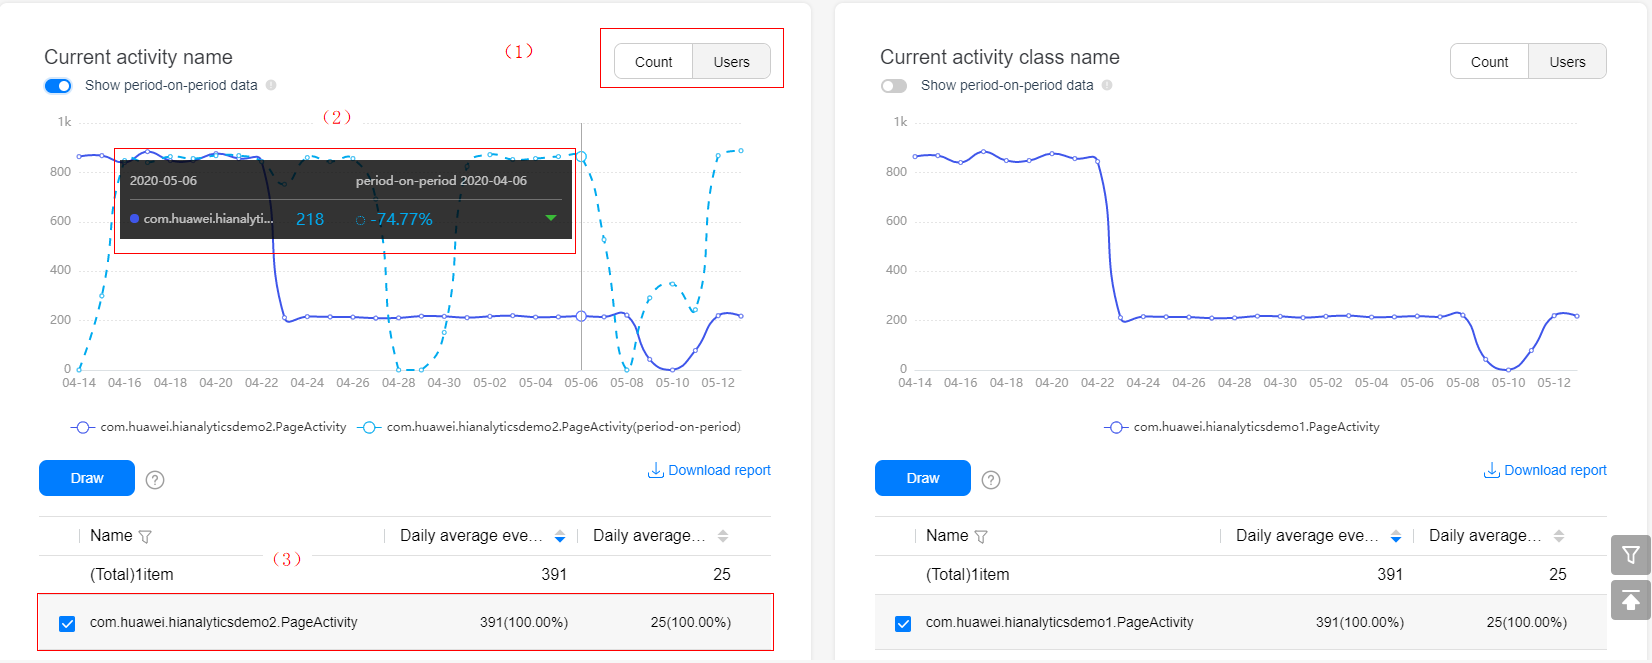
Through the custom parameter distribution report, you can:
For string-type parameters, view the quantity distribution of each value and user quantity distribution of each value in area (1), daily comparison of the quantity of each value in area (2), and details about each value in area (3) in a selected time range.
For numeric-type parameters, view the average value distribution and total value distribution in a selected time range.
Specifications
Maximum number of events supported by an app: 500 (including predefined events and custom events).
Maximum number of event parameters that can be registered for an event: 25
For example, if event A reported by the device contains 100 event parameters, you can register a maximum of 25 event parameters in the event management module.
Maximum number of event parameters that can be registered for an app: 100 (excluding the parameters of events automatically collected by the system).
Maximum number of parameter values (accumulated) that can be collected for each string-type parameter of an app: 500 (Excess parameter values are classified as others.).
Length of the Event ID and parameter ID: not more than 256 characters.
Length of the event name and parameter name: not more than 255 characters.
Length of the event description: not more than 1000 characters.
Procedure
1. Sign in to AppGallery Connect and select "My projects".
2. Click the app for which you need to view analytics data.
3. Go to "Analyze > User Behavior > Page analysis".

Use the filter control and date control to quickly filter data in the specified range.
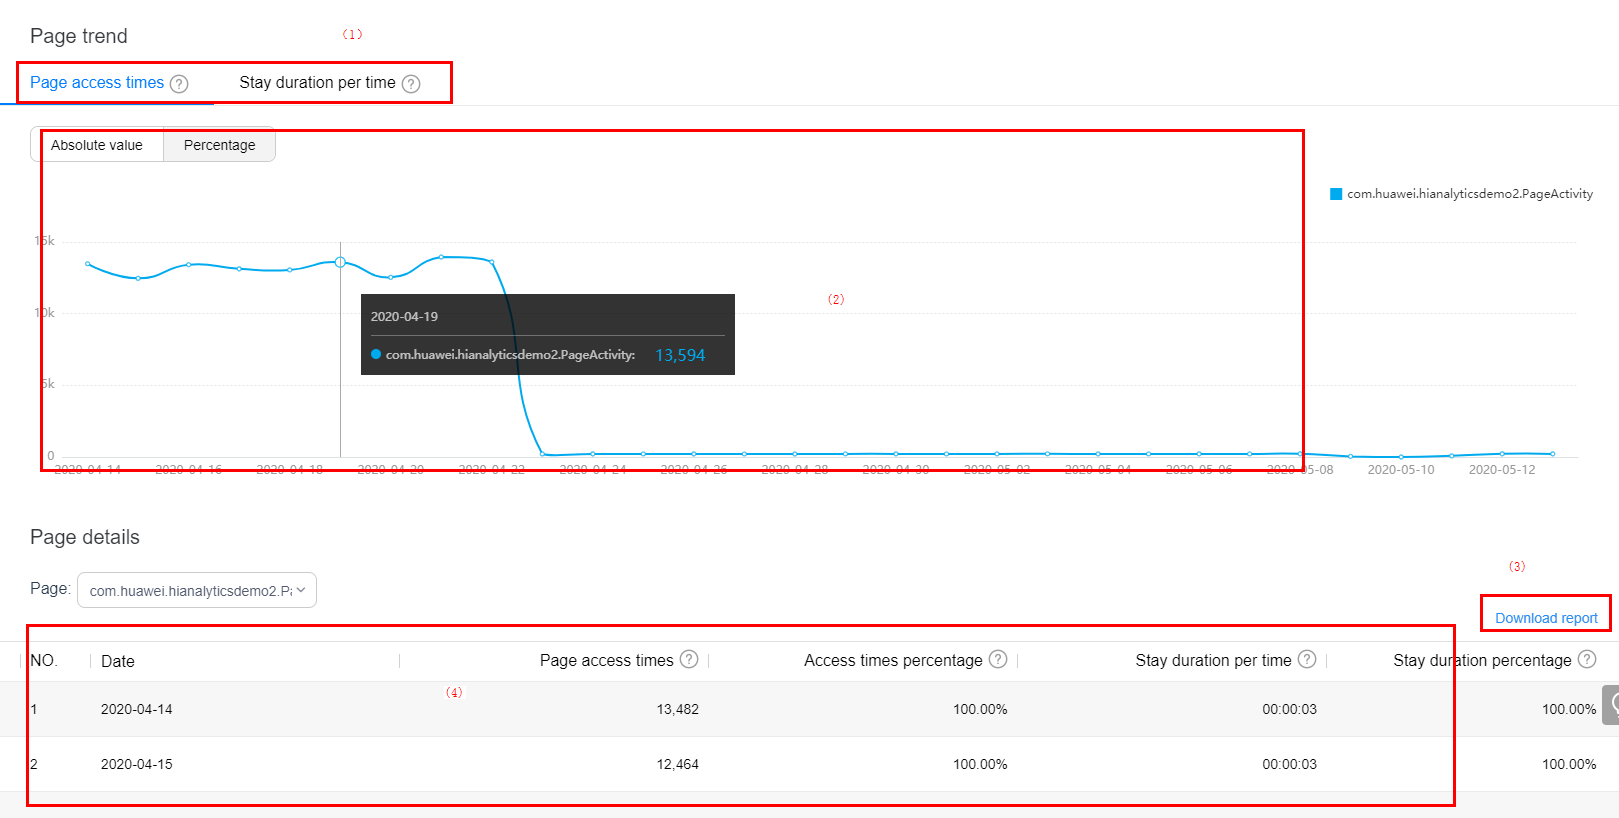
The page analysis report contains a chart in the upper part and a table in the lower part. Click area (1) and select Page access times or Stay duration per time to view the page access trend. The trend chart is displayed in area (2) and the access details are displayed in area (4).
Click Download table in area (3) to download the page access details for personalized analysis.
Indicators:
Page access times: Number of times that a page is accessed. Repeated page redirections are also counted.
Access time percentage: Access times of current page/Total access times of top 10 pages.
Stay duration per time: Total duration that users stay on the current page/Number of page access times.
Stay duration percentage: Total duration that users stay on the current page/Total duration that users stay on all pages.
Procedure
1. Sign in to AppGallery Connect and select "My projects".
2. Click the app for which you need to view analytics data.
3. Go to" Analyze > User Behavior > Launch analysis".
Use the filter control and date control as needed to quickly filter data in the specified range.

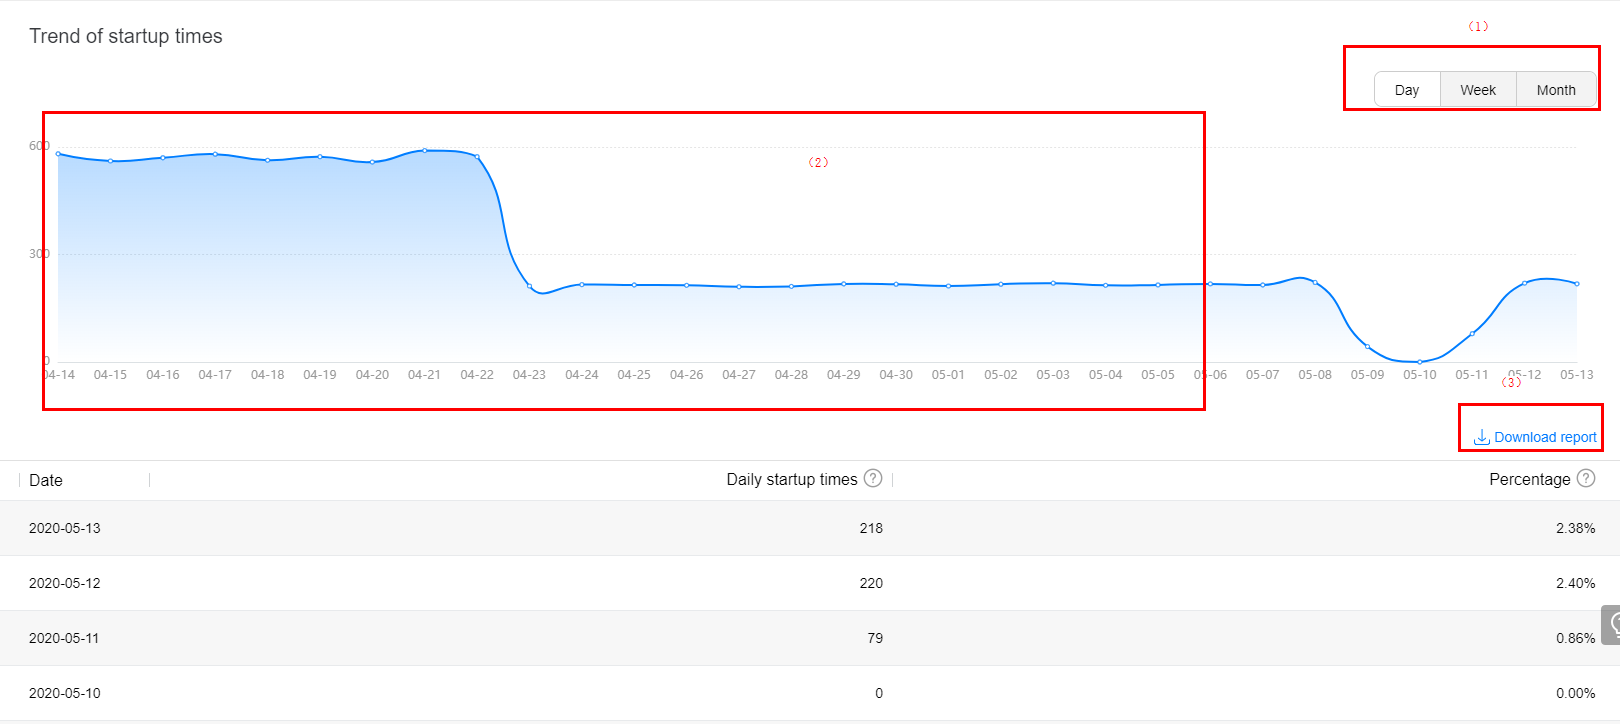
In area (1), choose to view launch time details by day, week, or month. The trend of the number of launch times is displayed in area (2).
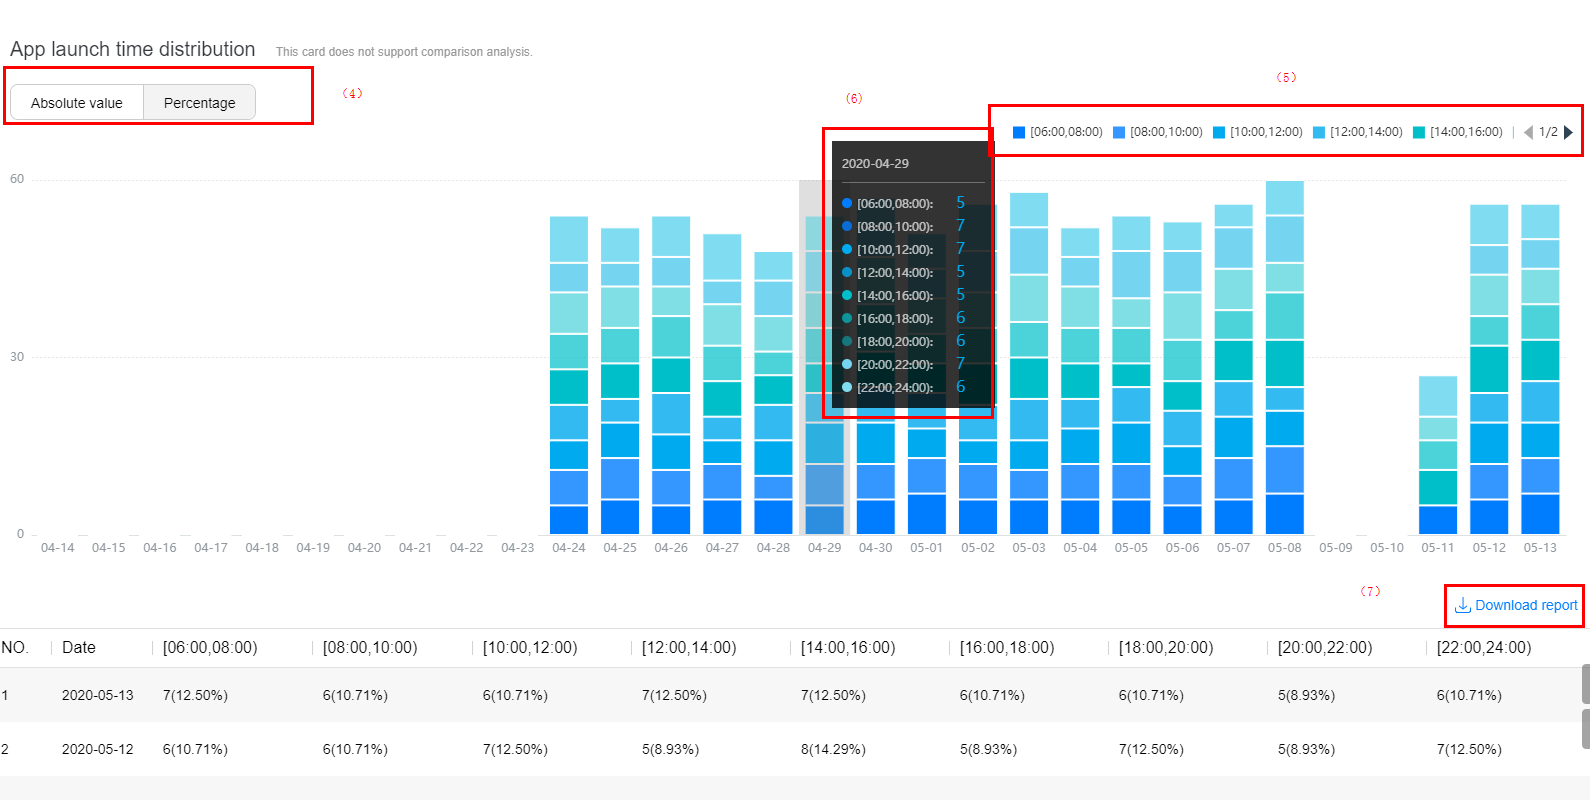
In area (3) or (7), click Download table to download launch times details for personalized analysis.
In area (4), choose to view launch times distribution by the absolute value or percentage. Currently, this card does not support comparison analysis.
View the launch times segment (from 06:00 to 24:00) in area (5) and the distribution of launch times segments in area (6).
4. Perform comparison analysis on launch times.
You can perform comparison analysis on launch times by the app type, app, user attribute, audience, or industry.
For example, you can compare the launch times trend of different device models or perform drill-down analysis for industry categories.
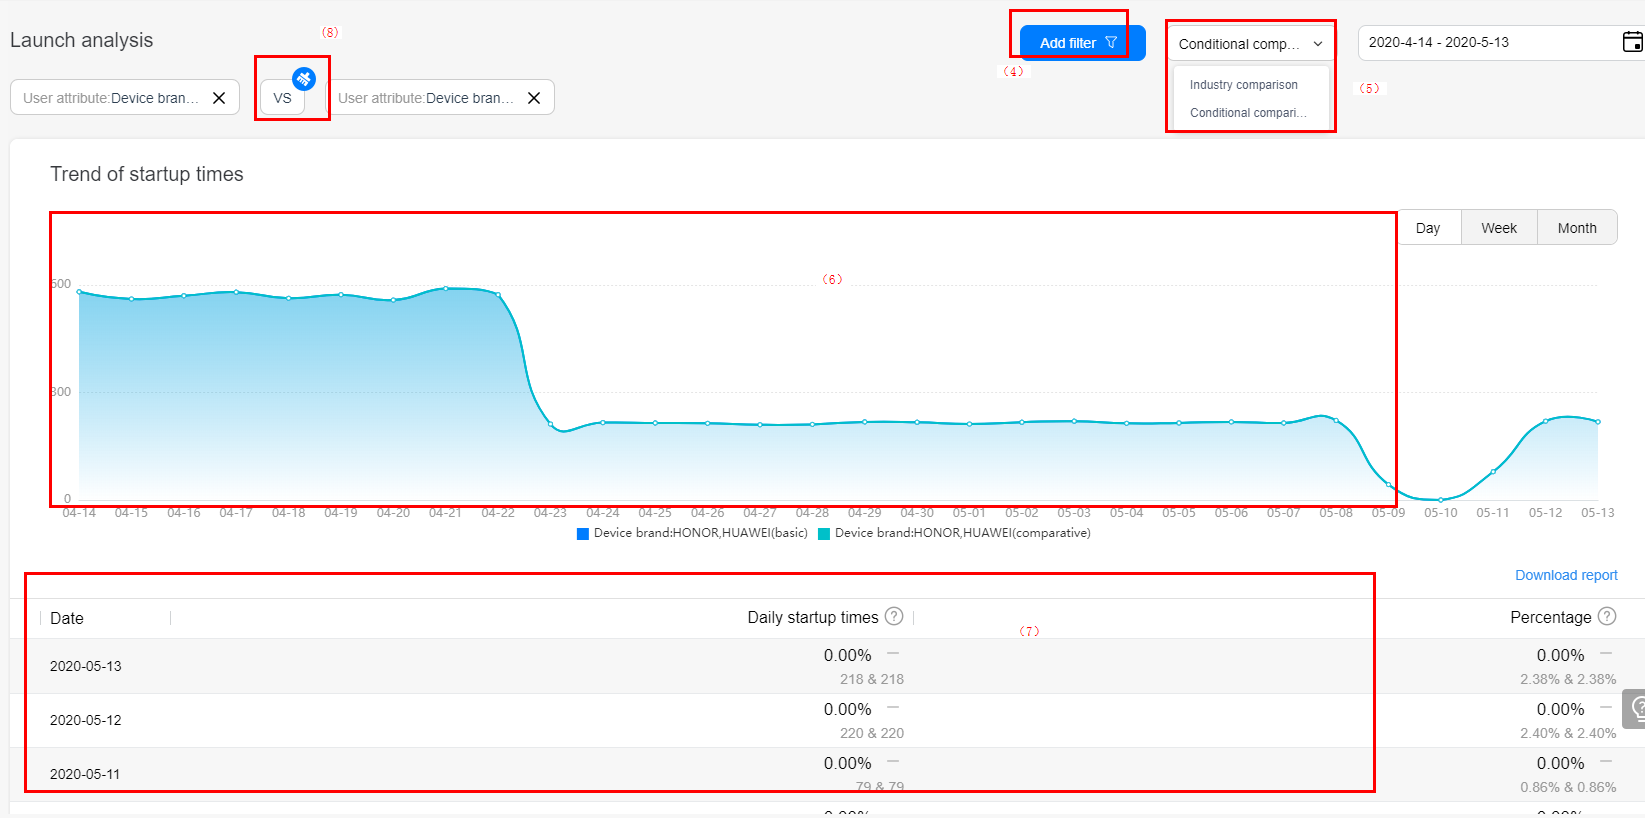
Click Add filter in area (4) to add filters and select User attribute comparison or Industry comparison as the comparison condition in area (5). Then, the comparison of the launch times trend is displayed in the chart in area (6), and the comparison details are displayed in the table in area (7). You can click VS in area (8) to clear the comparison condition.
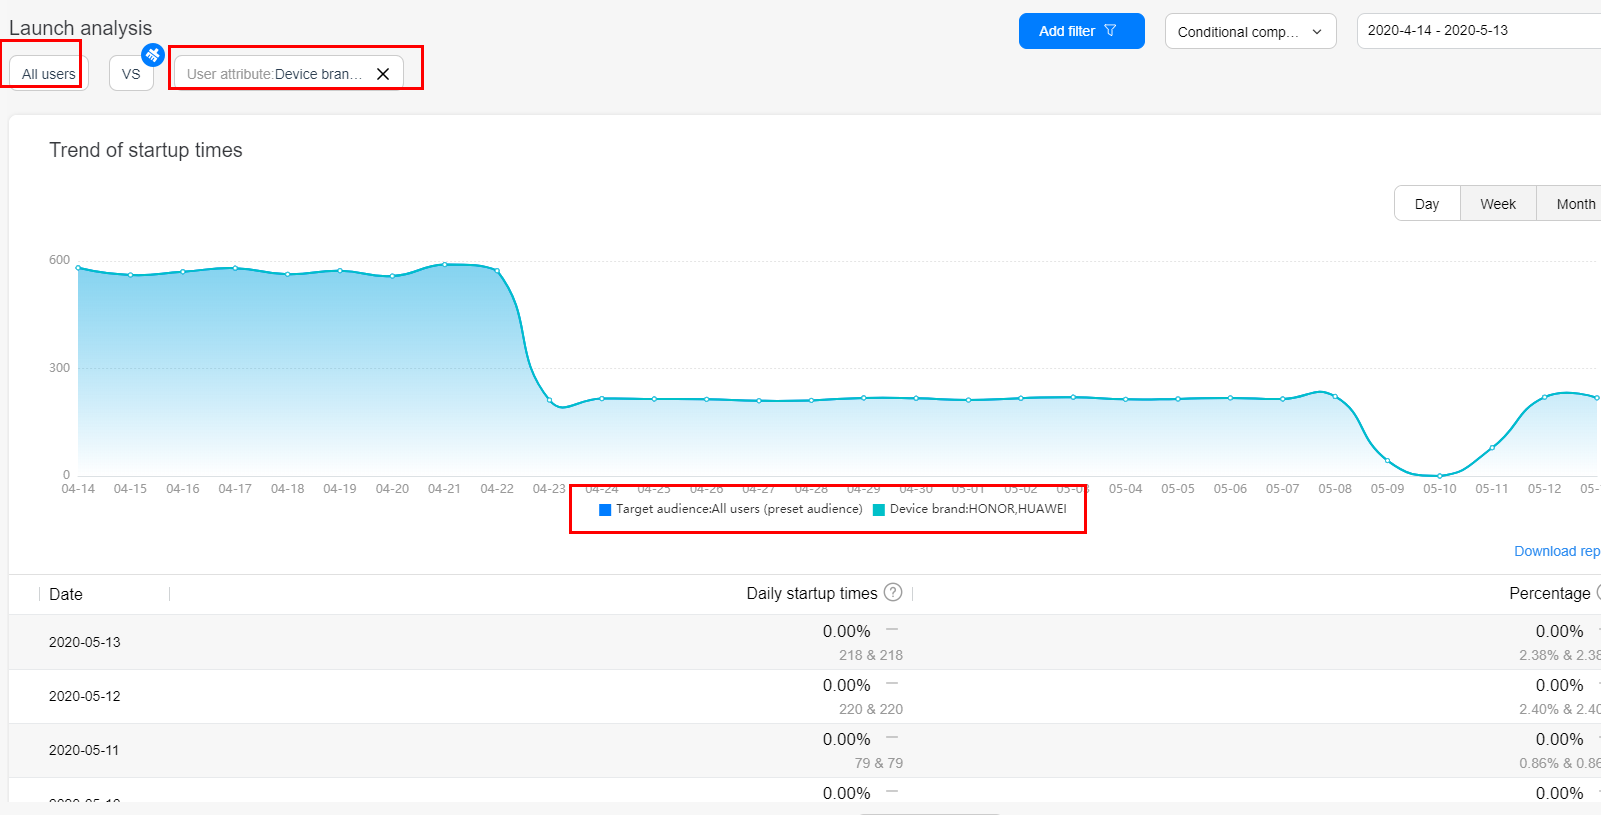
If you add a comparison analysis condition without adding a filter condition, the trend chart displays the comparison between all users and the selected users.
Indicators:
Daily startup times: Total number of times that a user launches an app every day.
Percentage: Sum(Number of launch times on the current day)/Sum(Number of launch times in the selected time segment).
Weekly startup times: Total number of times that a user launches an app every week.
Percentage: Sum(Number of launch times in the current week)/Sum(Number of launch times in the selected time segment).
Monthly startup times: Total number of times that a user launches an app every month.
Percentage: Sum(Number of launch times in the current month)/Sum(Number of launch times in the selected time segment).
Procedure
1. Sign in to AppGallery Connect and select "My projects".
2. Click the app for which you need to view analytics data.
3. Go to "Analyze > User Behavior > Session path analysis".
4. Set the search criteria.
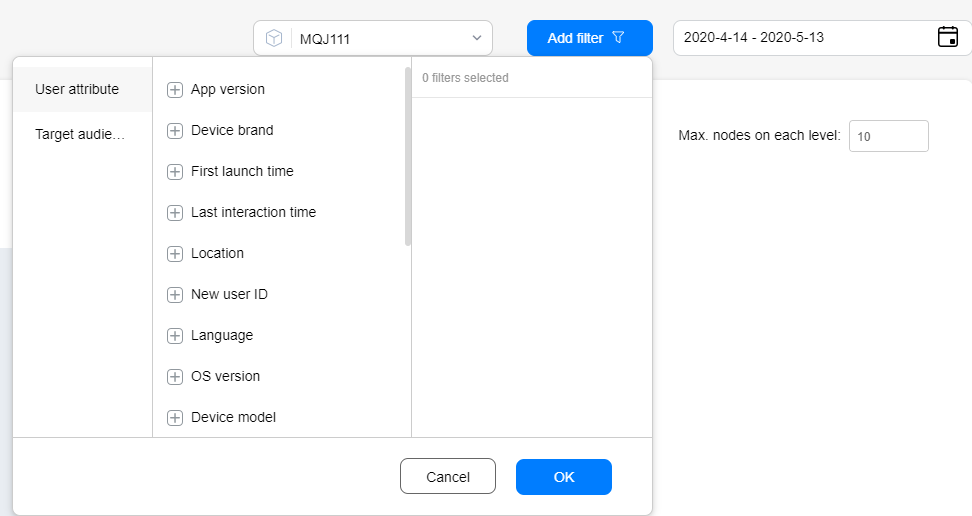
You can set the search criteria by user attribute, audience, and time.
View analysis reports.
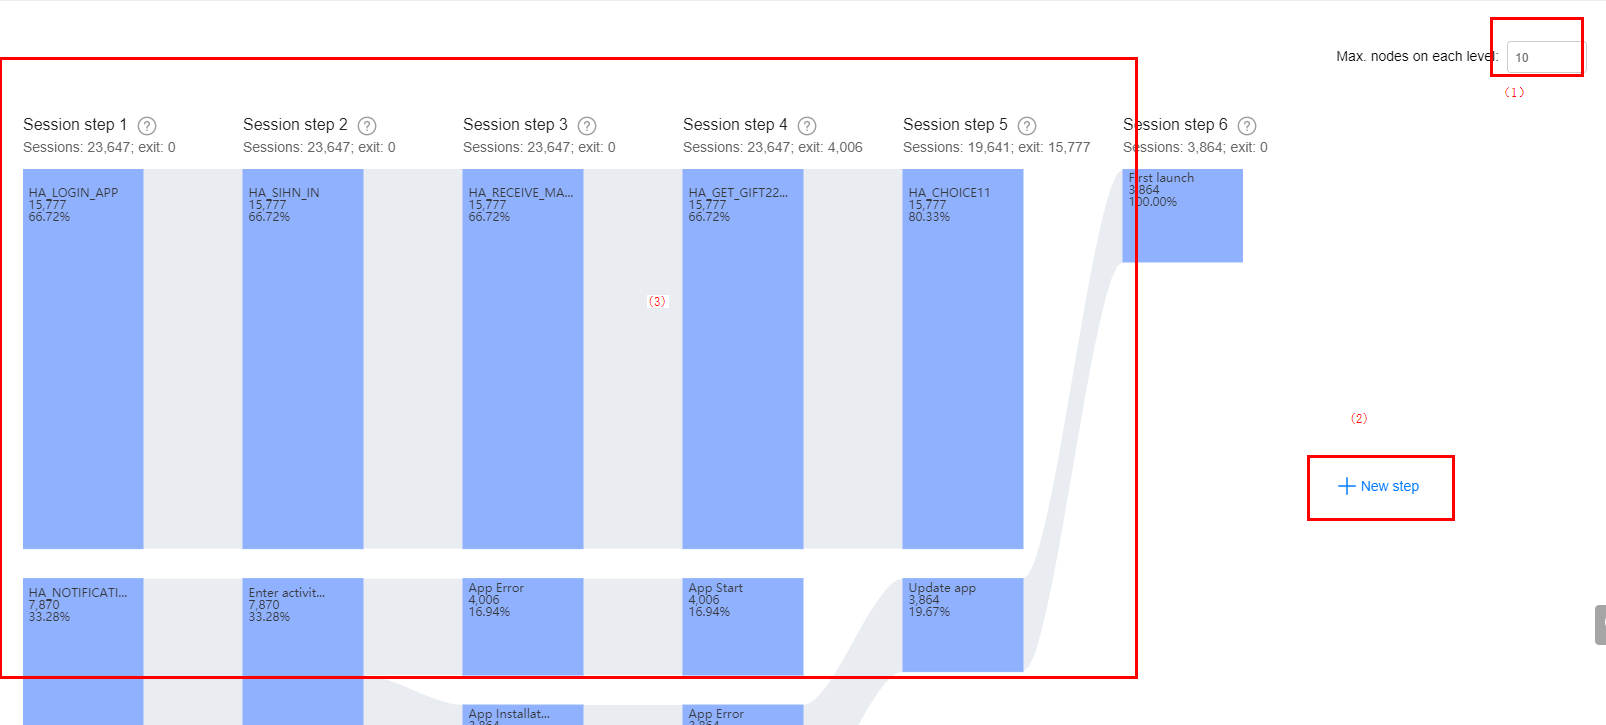
Path analysis is performed based on sessions. By default, six session steps and 10 nodes are displayed.
You can change the number of nodes displayed at each level in area (1) and add a step in area (2). The analysis result is displayed in a Sankey chart in area (3), showing the later and former paths and event flow direction of each event.
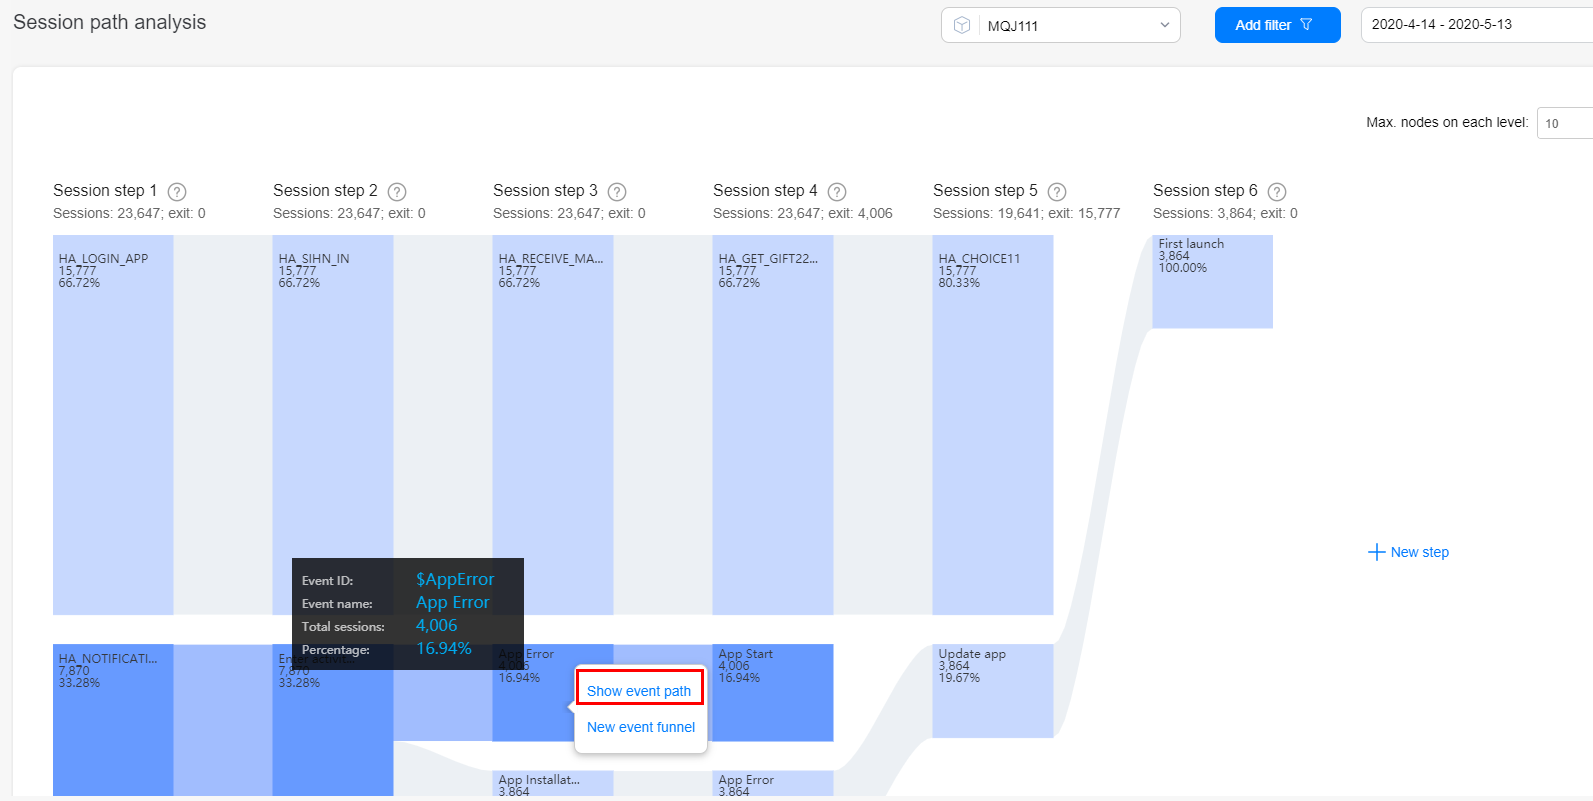
Right-click an event and choose Show event path. Then, steps involving this event are highlighted. Move the pointer to an event to view its details, including the event ID, event name, total number of sessions, and percentage.
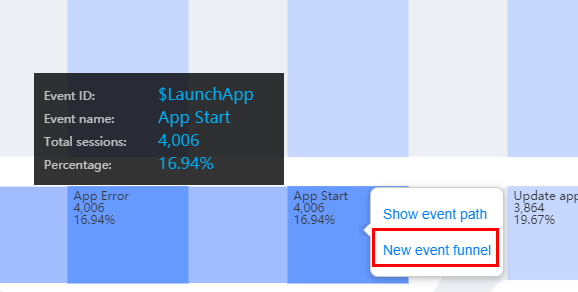
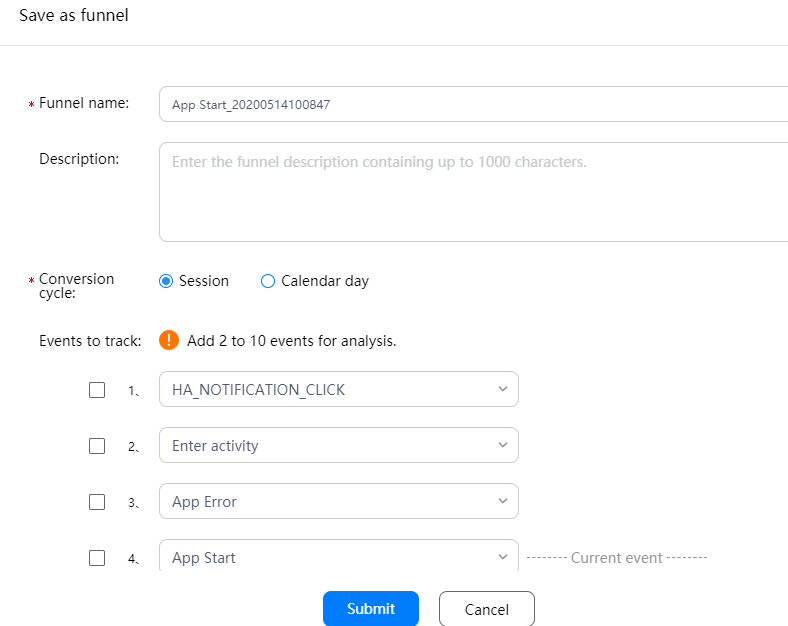
Save specific paths as a funnel.
Click an event that you are interested in and choose New event funnel to create a funnel for paths related to this event, so that you can continuously observe the conversion.
The path analytics model visually displays user behaviors in a Sankey chart, helping you analyze and mine the source and destination of users in apps. You can use this model with other analytics models for in-depth analysis to gain insight into user behavior motivation and guide users to use the optimal path or the expected path through product optimization or operations policies.
Specifications
The path analysis Sankey chart supports a maximum of 15 session steps and 20 nodes.
Procedure
1. Sign in to AppGallery Connect and select My projects.
2. Click the app for which you need to view analytics data.
3. Go to Analyze > User Behavior > Activity analysis.
Use the filter control and date control to quickly filter data in the specified range. For details about how to use the filter control and date control, please refer to Project overview.

View default indicators.
Click Default indicator in area (1). There are five default activity indicators, which are activity interval, startup times, sessions, page access times, and access duration.
Click an indicator in area (2) to view the change trend of the indicator in a selected time range.
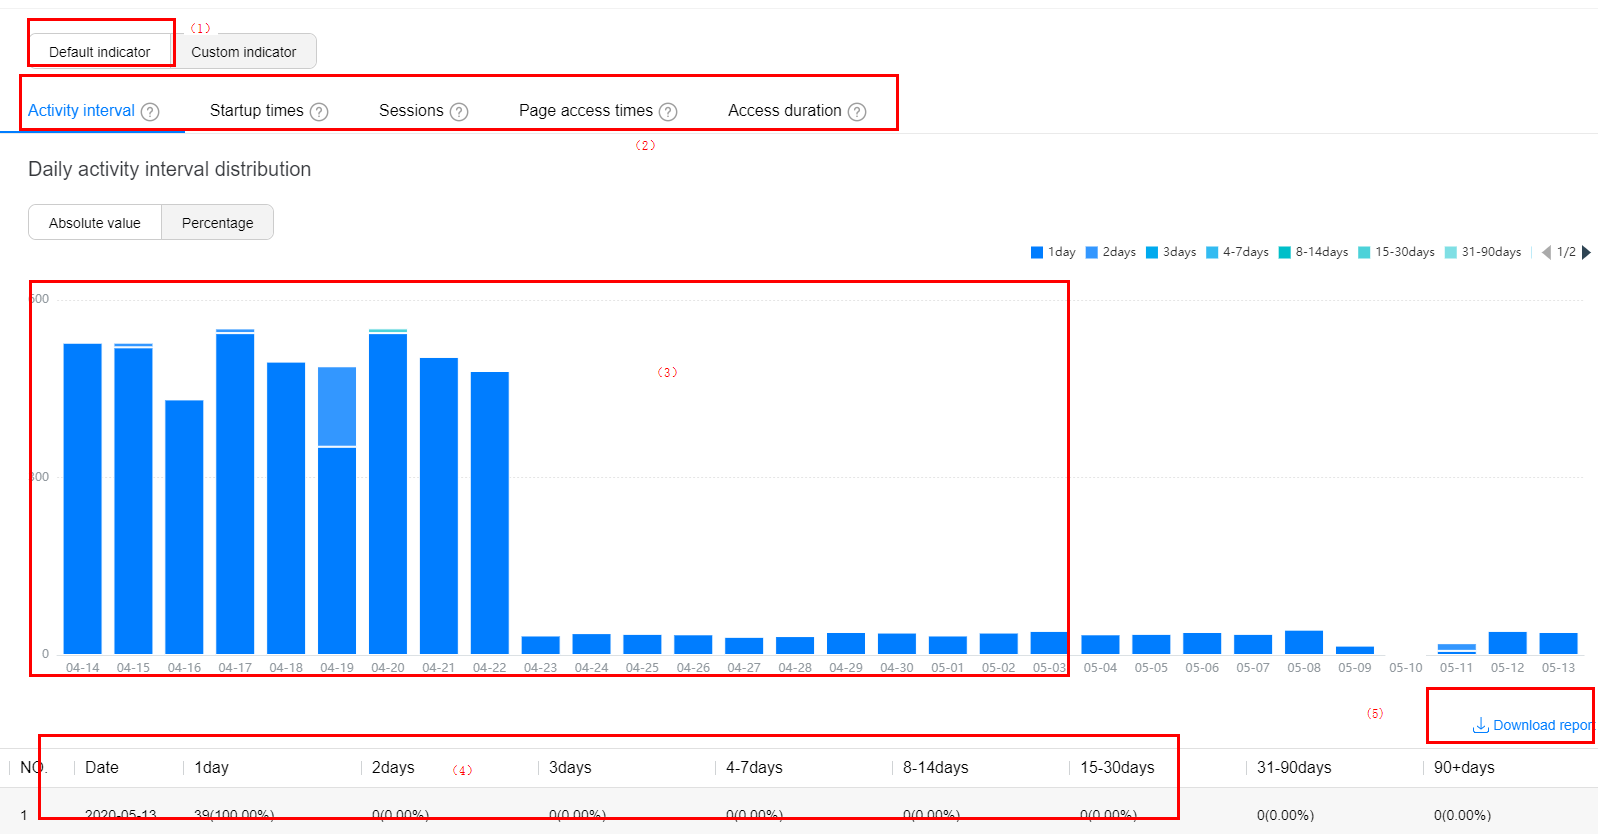
The indicator details are displayed in area (4). Click Download report to download the details for personalized analysis.
View indicator details.
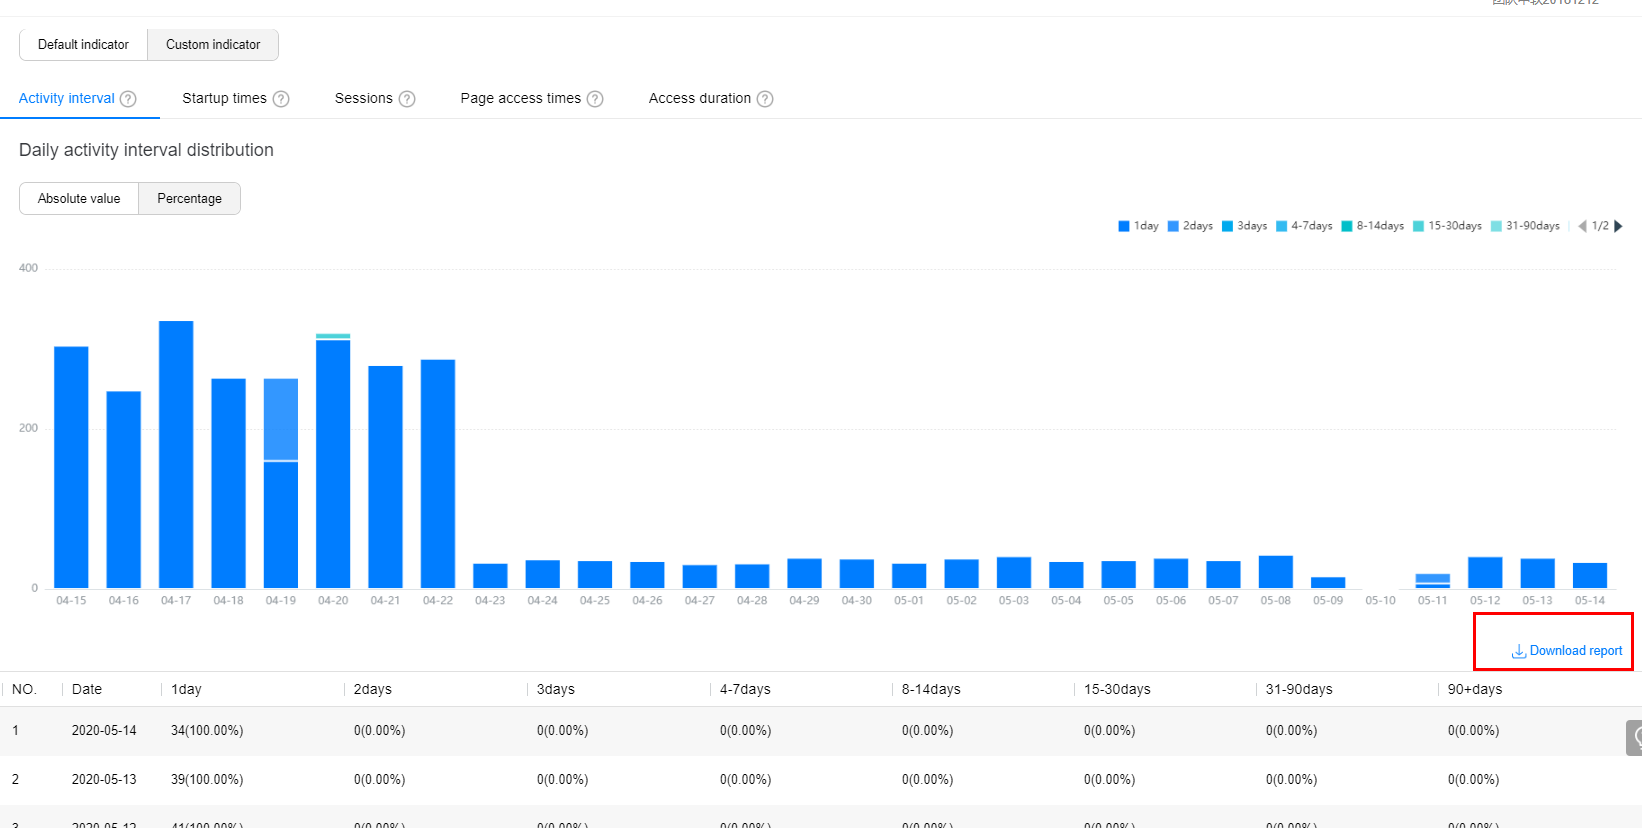
When you select an indicator, details about the indicator are displayed under the trend chart. You can click Download report to download the details for personalized analysis.
Viewing custom indicators
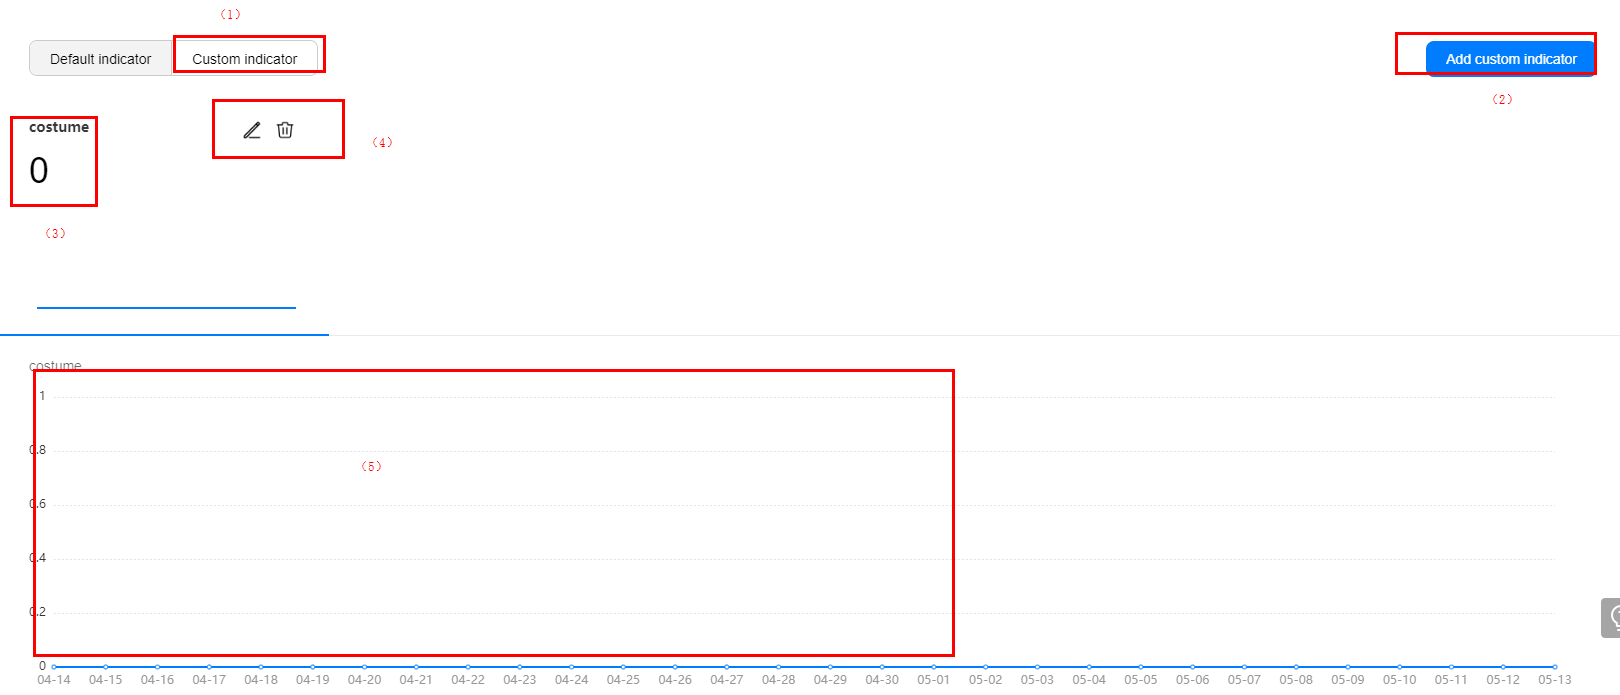
Click "Custom indicator "to view custom activity indicators.
Click "Add custom indicator "to add a custom indicator.
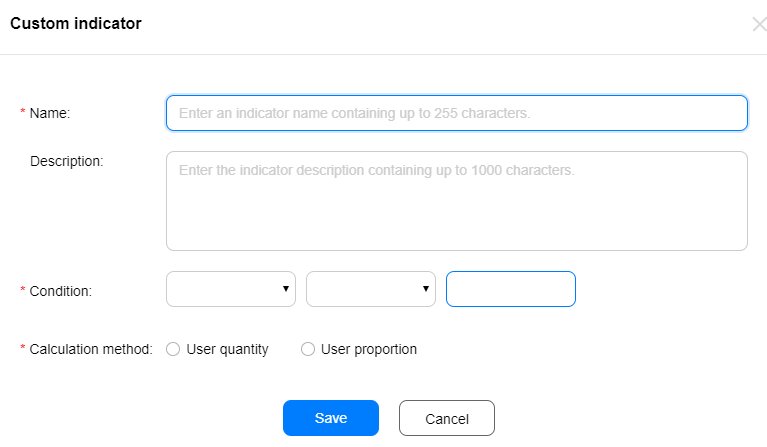
The related parameters are described as follows:
Name: Set it to a value that is easy to remember and understand.
Description: Set it to the purpose and standard of this indicator.
Condition: Set it based on the occurrence times and parameters of preset events and custom events.
The following table lists the operators supported by different types of parameters.
| Parameter | Supported Operator | Description |
|---|---|---|
Count | Greater than | Number of times an event occurs. |
Numeric parameter | Equal to, less than, greater than, greater than or equal to, less than or equal to, not equal to | / |
String parameter | Full match | / |
You can specify different indicator calculation methods based on the configured conditions. The following table lists the mapping between conditions and calculation methods.
| Condition Type | Supported Indicator Calculation Method |
|---|---|
Constructing indicator conditions using the number of events | User quantity, user proportion |
Constructing indicator conditions using string-type parameters | User quantity, user proportion |
Constructing indicator conditions using numeric-type parameters | User quantity, user proportion, sum, average |
The following table lists the calculation methods and standards.
| Calculation Method | Calculation Standard |
|---|---|
User quantity | Number of unique users meeting the conditions |
User proportion | Number of unique users meeting the conditions/Total number of unique users in a specified time range |
Sum | Sum of values of specified parameters in all events meeting the conditions. |
Average | Sum of value of specified parameters in all events/Number of users |
If multiple custom indicators are defined, you can click an indicator card to view the change trend of the indicator. The trend chart will be displayed in area (5).
To modify or delete a custom indicator, you can move the mouse pointer to the indicator card and click  to modify the indicator definition or click
 to delete the indicator, as shown in area (4).
Specifications
Added or modified custom activity indicators take effect on the next day.
A maximum of three custom activity indicators can be defined for each app.