
Retention is critical to app growth and operations. The retention rate represents users' continuous interest in products and is one of the main metrics for measuring the core value of products. Retention analysis helps you understand the continuous attractiveness of your product to users.
Procedure
Sign in to AppGallery Connect and select "My projects".
Click the app for which you need to view analytics data.
Go to "Analyze > Retention analysis > New user retention".
Use the filter control and date control to quickly filter data in the specified range. For details about how to use the filter control and date control, please refer to Project overview.
1) Viewing the new user retention trend
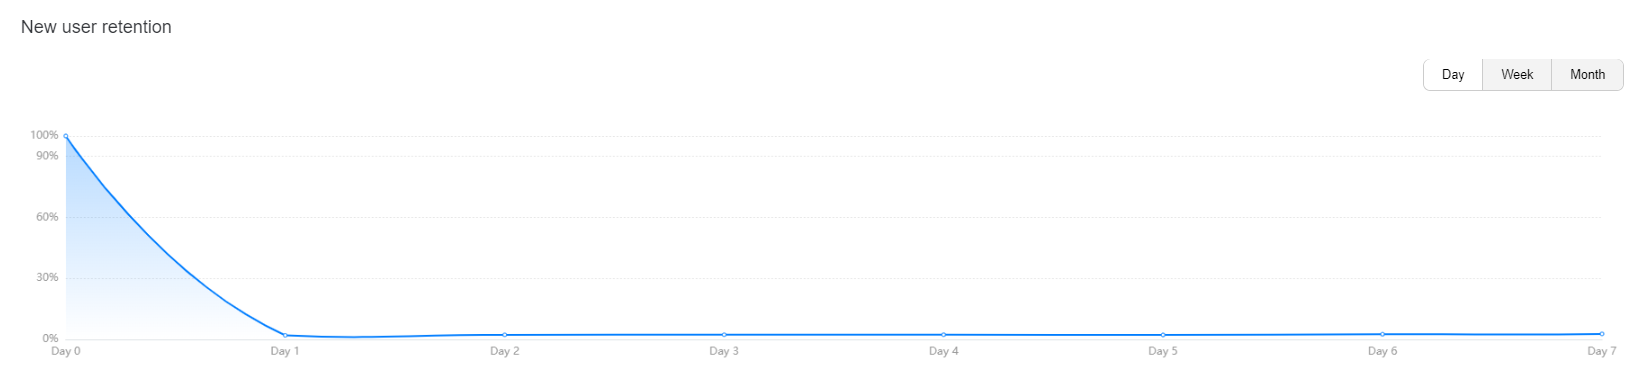
You can click the buttons to select a period (day, week, or month) to view the retention trend of new users in the specified time segment.
2) Viewing new user retention details and creating audiences
Click a user count or the column header in the table to save users as audiences. The audiences can be further analyzed and messages can be pushed to the audiences.
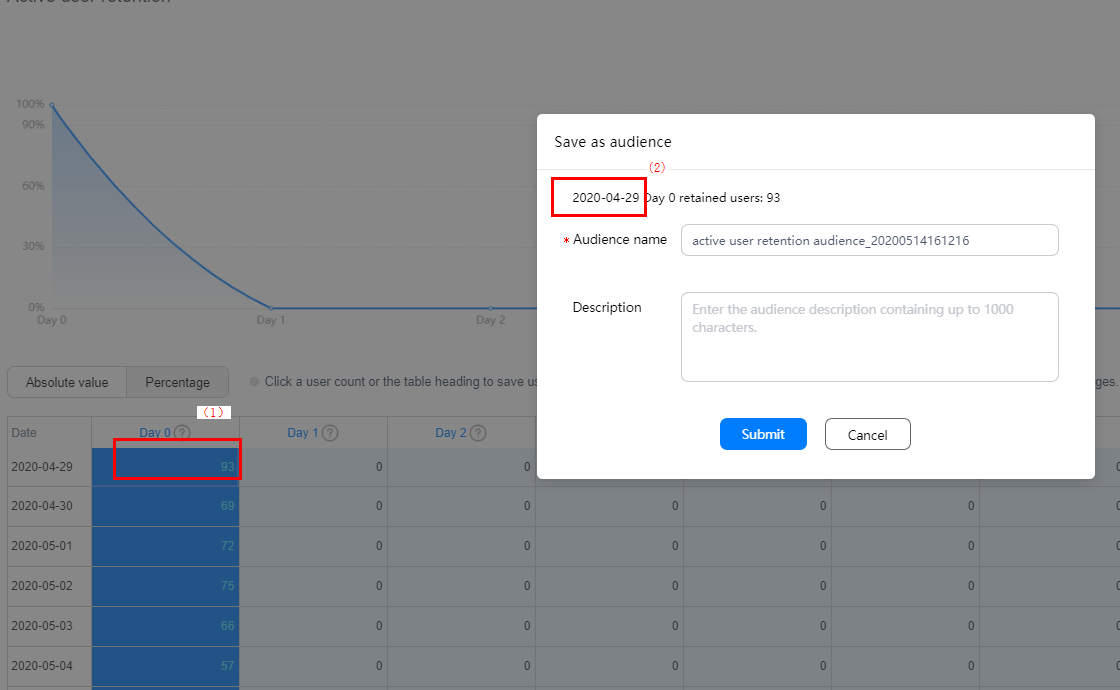
Click the user count in area (1) to save the retained users on that day as audiences, as shown in area (2).
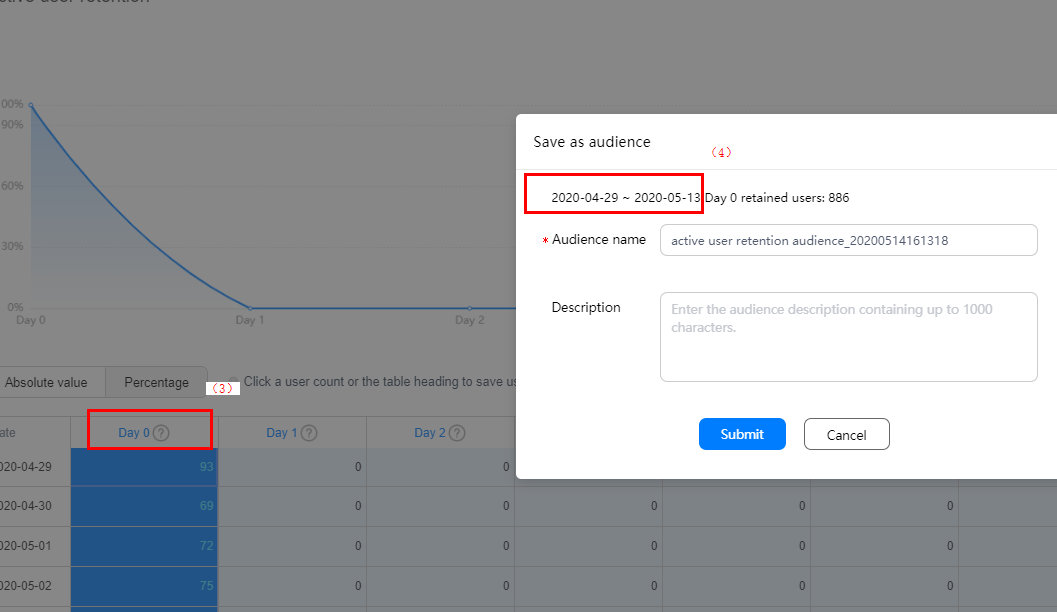
Click the column header in area (3) to save the retained users in that column as audiences, as shown in area (4).
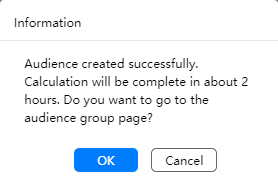
After you click Submit, a message is displayed, asking you whether to access the audience group page. The created audiences are displayed in the audience list on the audience analysis page. You can further analyze the audiences or have messages pushed to the audiences.
3) Adding comparison analysis
You can perform comparison analysis on new user retention by the app type, app, user attribute, or industry. For example, you can compare the new user retention trend of different device models or perform drill-down analysis for industry categories.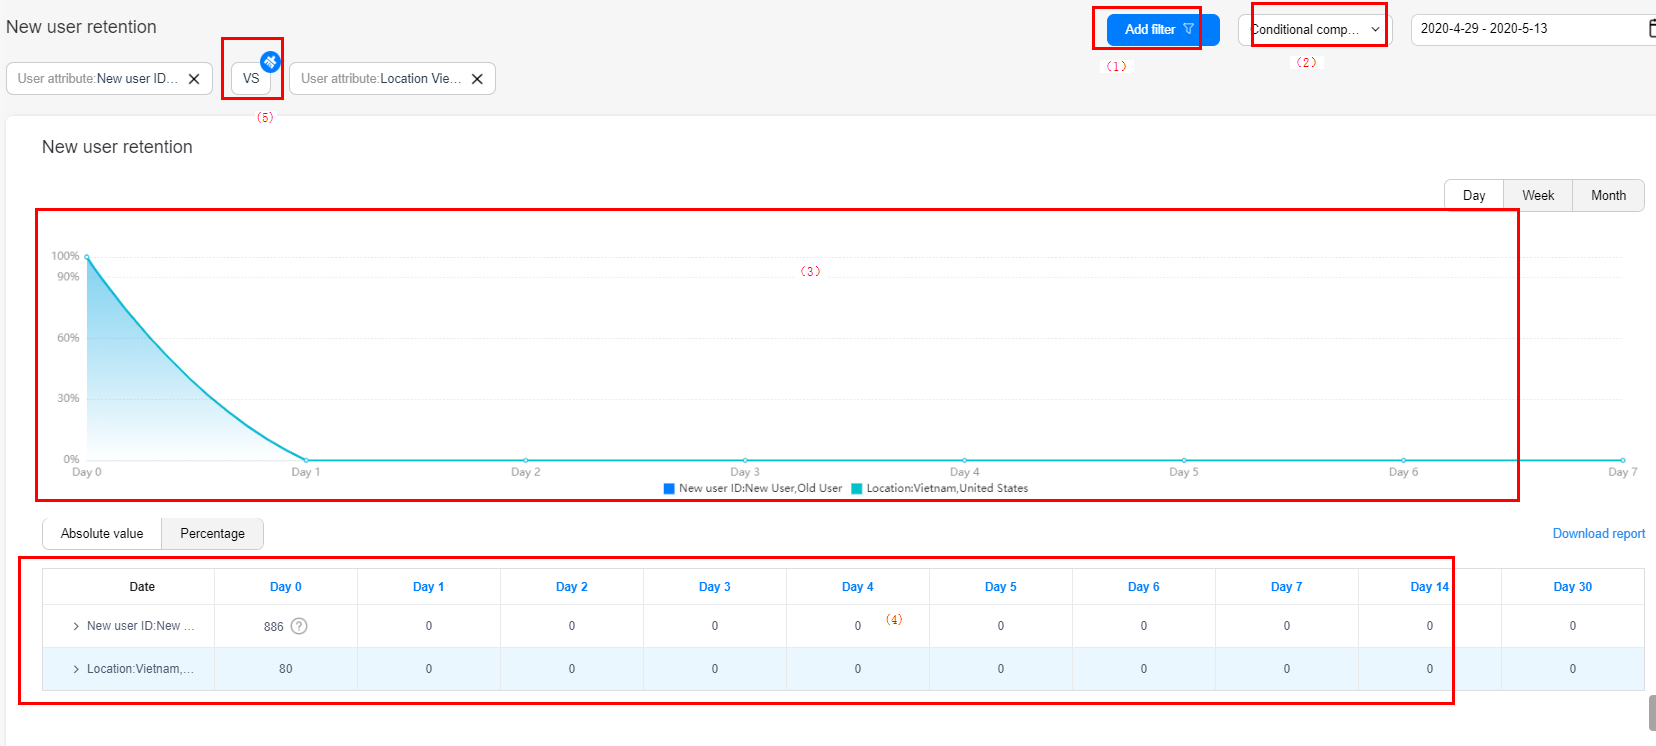
Click Add filter in area (1) to add filters, and click Add comparison analysis in area (2) to add comparison conditions. Then, the comparison result is displayed in area (3) and comparison details are displayed in the table in area (4). To clear the comparison conditions, click VS in area (5).
If you add a comparison analysis condition without adding a filter condition, the trend chart displays the comparison between all users and the selected users.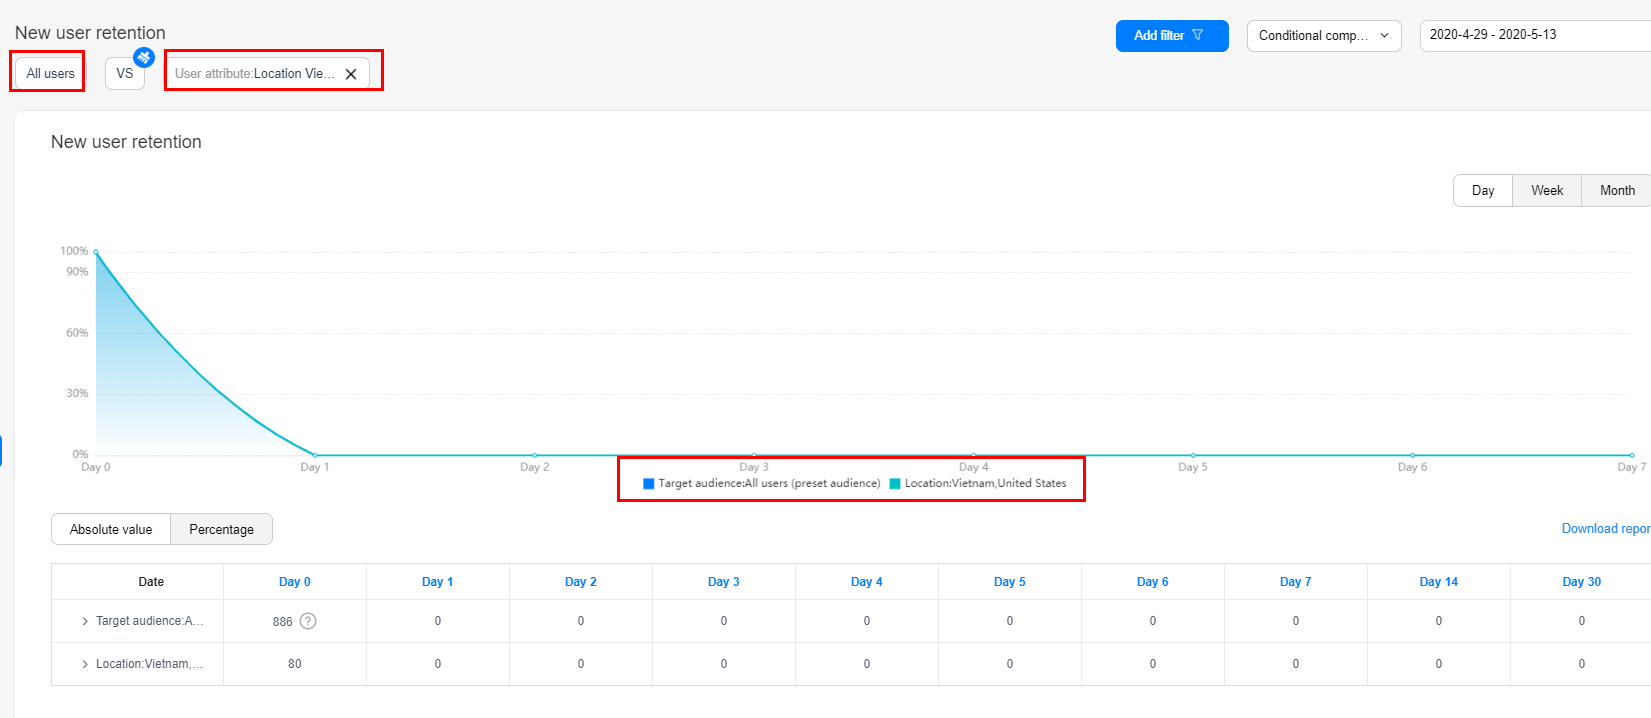
Procedure
Sign in to AppGallery Connect and select "My projects".
Click the app to manage.
Go to "Analyze > Retention analysis > Active user retention".
Use the filter control and date control to quickly filter data in the specified range. For details about how to use the filter control and date control, please refer to Project overview.

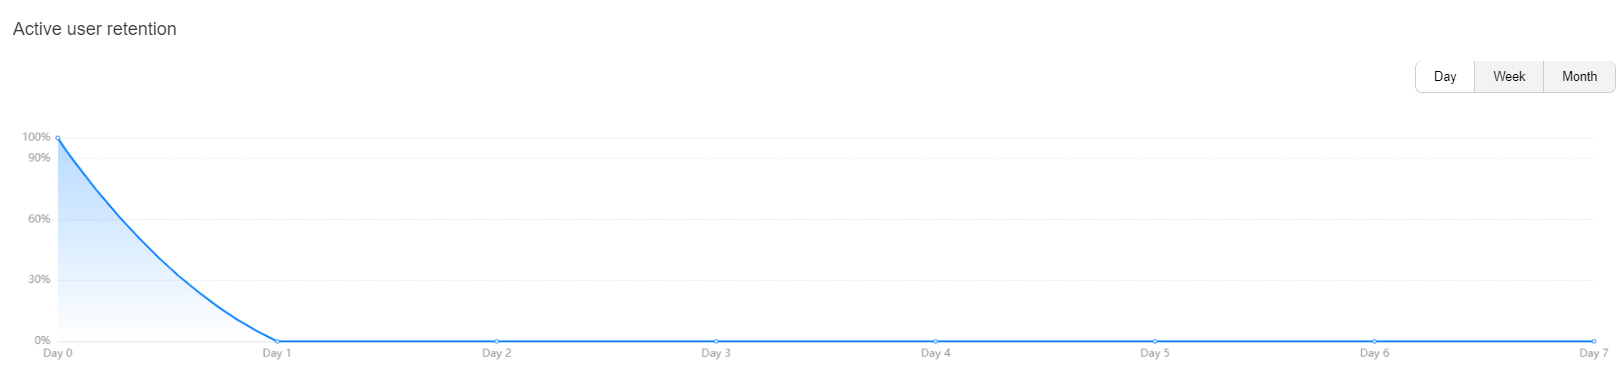
1) Viewing the active user retention trend
You can click the buttons to select a period (day, week, or month) to view the retention trend of active users in the specified time segment.
2) Viewing active user retention details and creating audiences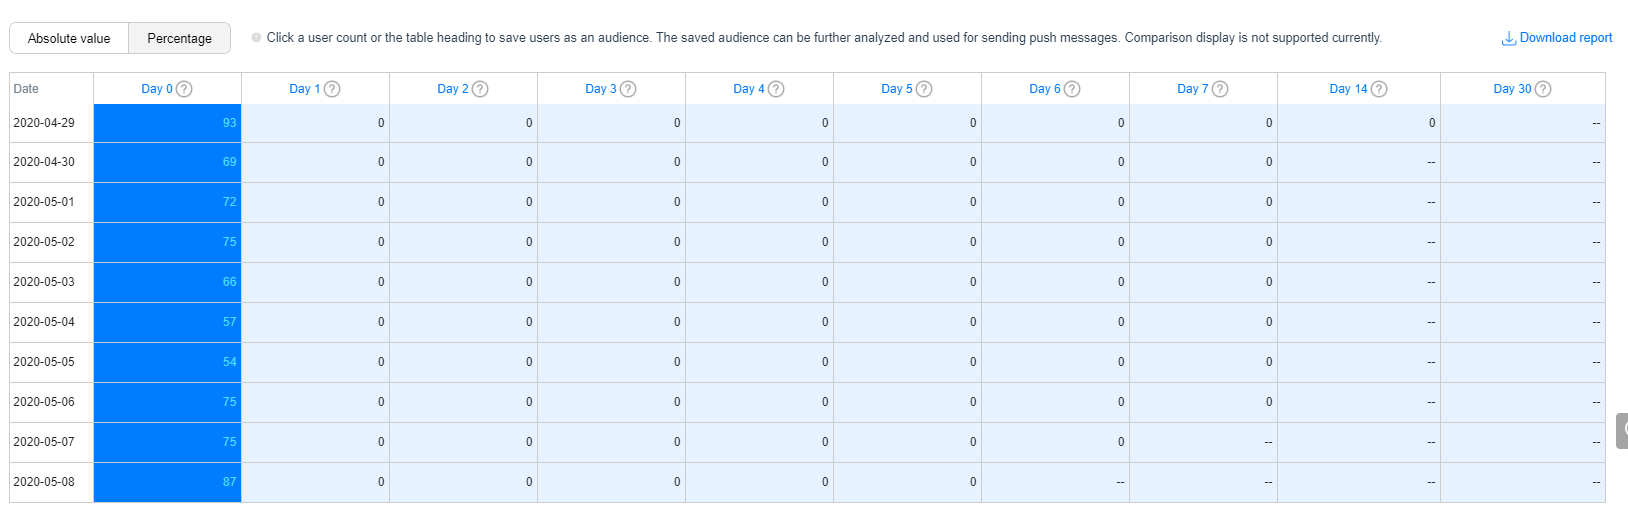
Click a user count or the column header in the table to save users as audiences. The audiences can be further analyzed and messages can be pushed to the audiences.
3) Adding comparison analysis
You can perform comparison analysis on active user retention by the app type, app, user attribute, audience, or industry. For example, you can compare the active user retention trend of different device models or perform drill-down analysis for industry categories.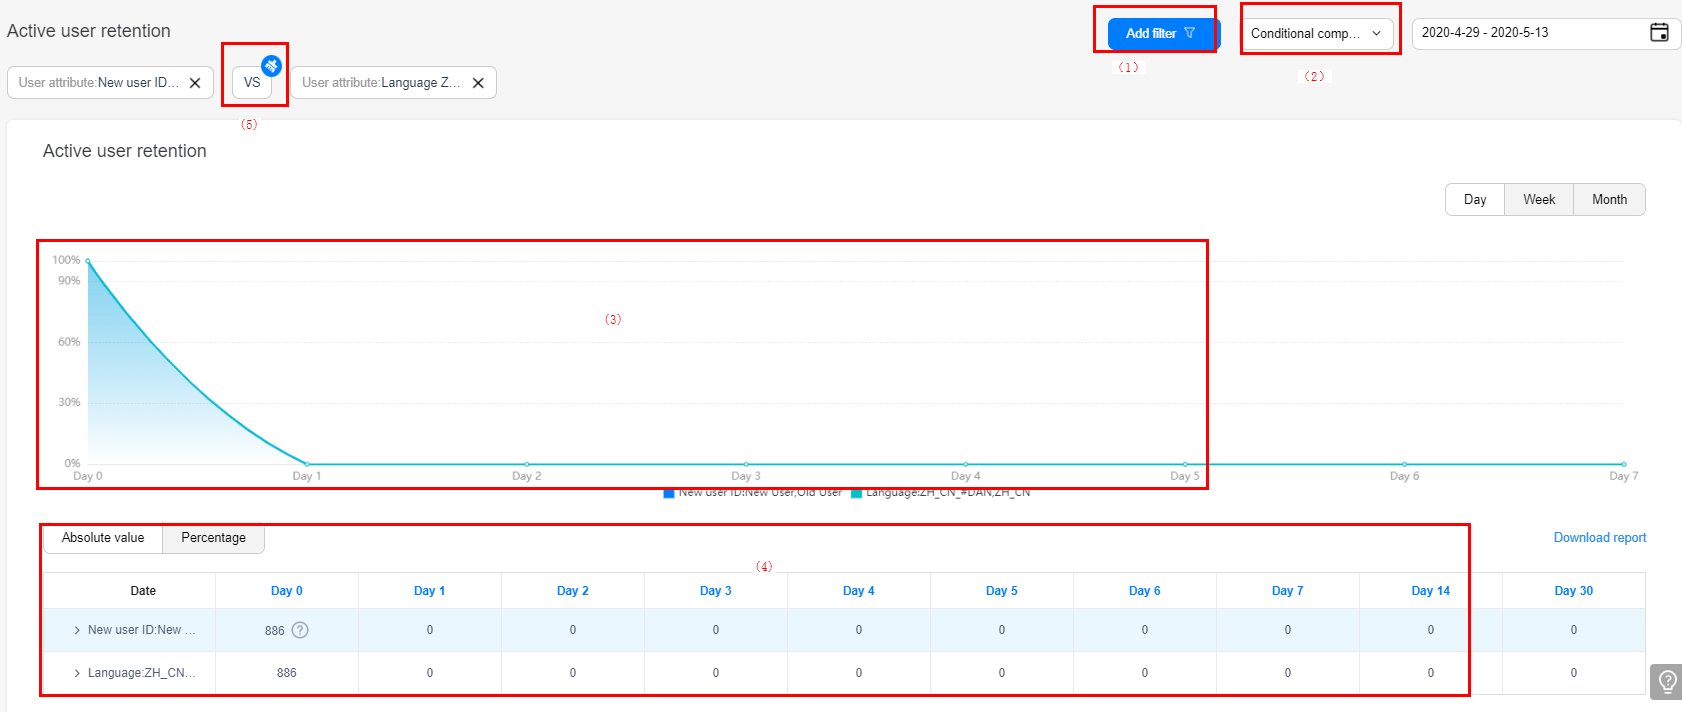
Click Add filter in area (1) to add filters, and click Add comparison analysis in area (2) to add comparison conditions. Then, the comparison result is displayed in area (3) and comparison details are displayed in the table in area (4). To clear the comparison conditions, click VS in area (5).
If you add a comparison analysis condition without adding a filter condition, the trend chart displays the comparison between all users and the selected users.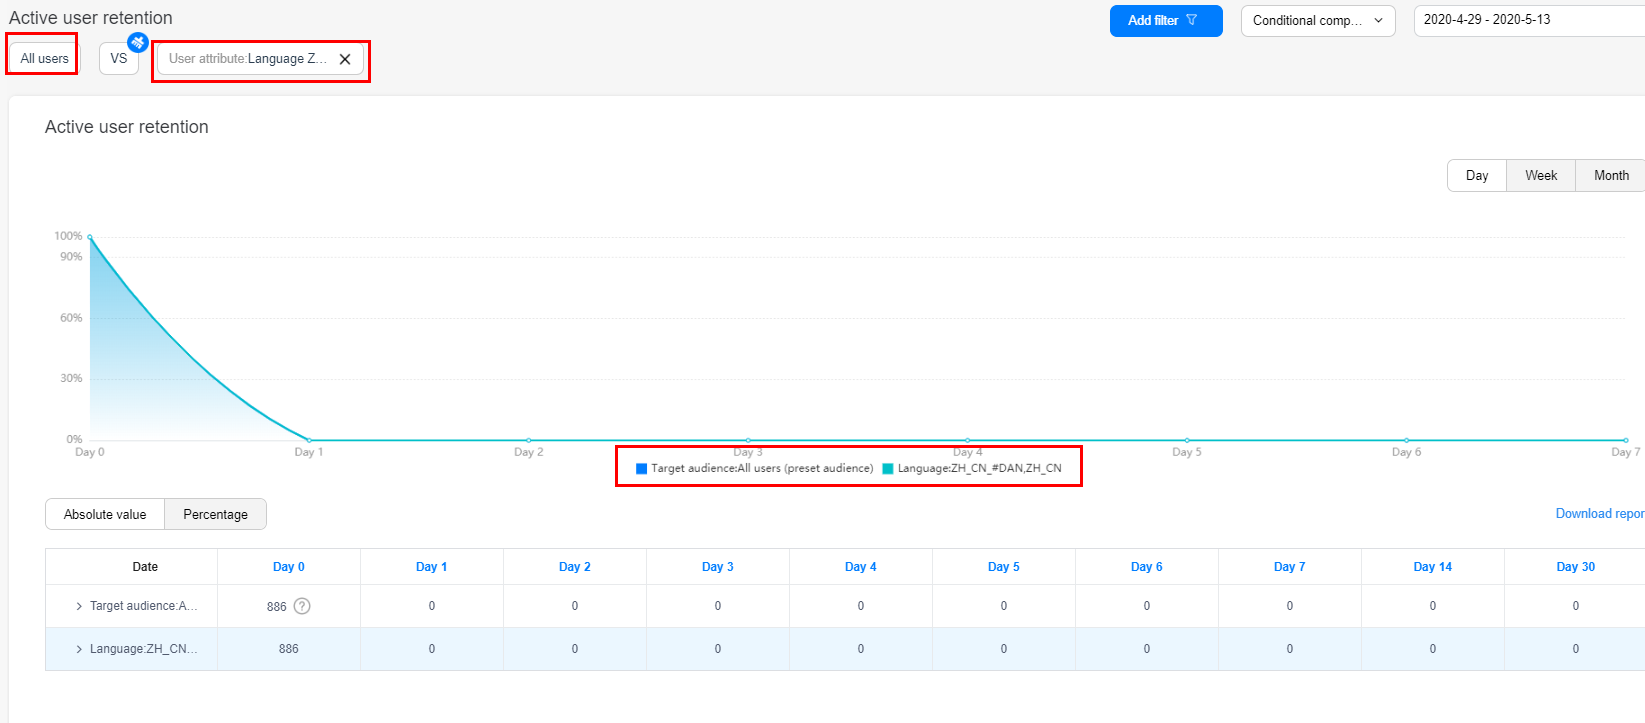
The new user retention report and active user retention report are updated by day. The time segment can be set to the recent 365 days at most.