Overview
Low Level Debugger (LLDB) is a next-generation, high-performance debugger. It can be used to set breakpoints, view and modify variables, perform memory operations, control threads, calculate expressions, backtrack stacks, and support cross-platform and plugin extension.
Developed based on llvm15.0.4, LLDB is the default debugger in DevEco Studio and supports debugging of C and C++ applications.
For details, visit the LLDB official website.
Features
LLDB has the following features:
Powerful debugging functionalities: LLDB supports breakpoint setting, variable viewing and modification, memory operation, thread control, expression calculation, and stack backtracking.
Cross-platform support: LLDB supports Windows, Linux x86_64, ohos, and macOS.
Plugin extension: LLDB supports plugin extension, which allows you to customize plugins as required.
How to Obtain
Install DevEco Studio, and obtain LLDB from its SDK components.
The following shows the path of LLDB in DevEco Studio (on Windows).
DevEco_Studio_Home/
└── sdk/
    ├── default/
    │   ├── HarmonyOS/
    │   │   └── native/
    │   │       └── llvm/
    │   │           ├── bin/
    │   │           │   └── lldb.exe                 # Main program on the Windows client
    │   │           └── lib/
    │   │               └── clang/
    │   │                   └── current/
    │   │                       └── bin/
    │   │                           ├── aarch64-linux-ohos/
    │   │                           │   └── lldb      # Independent ARM64 debugger
    │   │                           └── arm-linux-ohos/
    │   │                               └── lldb      # Independent ARM32 debugger
    │   └── hms/
    │       └── native/
    │           └── lldb/
    │               ├── aarch64-linux-ohos/
    │               │   └── lldb-server              # ARM64 debugging server
    │               ├── arm-linux-ohos/
    │               │   └── lldb-server              # ARM32 debugging server
    │               └── x86_64-linux-ohos/
    │                   └── lldb-server              # x86_64 emulator debugging server
Path of the LLDB client executable file on Windows:
<DevEco_Studio_Home>\sdk\default\HarmonyOS\native\llvm\bin\lldb.exe
Static lldb
Table 1 Directory of the static lldb tool
Path Description \DevEco Studio\sdk\default\HarmonyOS\native\llvm\lib\clang\current\bin\aarch64-linux-ohos\lldb Static lldb for the aarch64-linux-ohos architecture \DevEco Studio\sdk\default\HarmonyOS\native\llvm\lib\clang\current\bin\arm-linux-ohos\lldb Static lldb for the arm-linux-ohos architecture lldb-server
Table 2 Directory of the lldb-server tool
Path Description \DevEco Studio\sdk\default\hms\native\lldb\aarch64-linux-ohos\lldb-server lldb-server for the aarch64-linux-ohos architecture \DevEco Studio\sdk\default\hms\native\lldb\arm-linux-ohos\lldb-server lldb-server for the arm-linux-ohos architecture \DevEco Studio\sdk\default\hms\native\lldb\x86_64-linux-ohos\lldb-server lldb-server for the x86_64-linux-ohos architecture

Signature verification mechanism:
At runtime, lldb-server verifies its digital signature. Only lldb-servers signed by Huawei can be used to debug applications.
lldb-server is a special version processed by the closed-source signature.
This design is used to protect HarmonyOS debugging permissions and prevent unauthorized debugging.
Functionalities
The following lists some functionalities supported by LLDB. For more commands, see Introduction to LLDB and GDB to LLDB command map. LLDB differs slightly on Windows, Linux x86_64, and macOS.
Logging
# Record the complete debugging session to a file.
(lldb) log enable -F -T -p -f d:\lldb.log lldb all
(lldb) log enable -F -T -p -f d:\lldbgdbremote.log gdb-remote all
# Example: Filter and record only breakpoint events.
(lldb) log enable -f /tmp/breakpoints.log lldb break
# View the current log configuration.
(lldb) log list
Breakpoint management
# Set a function breakpoint (fuzzy match is supported).
(lldb) breakpoint -f main.cpp -l 266
# Set a conditional breakpoint, which is triggered when x is greater than or equal to 100.
(lldb) breakpoint set -f main.cpp -l 20 -c '(x > 100)'
# List all the breakpoints.
(lldb) breakpoint list
# Disable the breakpoint temporarily.
(lldb) breakpoint disable 1
Watchpoint management
# Monitor variable changes.
(lldb) watchpoint set variable global_var
# Monitor memory address changes.
(lldb) watchpoint set expression -w write -- 0x7ffeefbff5d8
# View watchpoint list.
(lldb) watchpoint list
Expression processing
# Create a variable.
(lldb) print int $value1 = 7
(lldb) expression int $value2 = 7
# Prints a variable value.
(lldb) print $value1
(lldb) expression $value2
# Calculate a variable.
(lldb) expression $value1 * 3
# Format the output in hexadecimal.
(lldb) p/x 12345
Viewing variables
# View initialized local variables of the current frame.
(lldb) frame variable
# View global and static variables.
(lldb) frame variable -g
# View registers.
(lldb) register read
Process/Thread management
# Display thread backtraces (of all threads).
(lldb) thread backtrace all
# Step over.
(lldb) thread step-over (or next)
# Step out of the current frame.
(lldb) thread step-out (or finish)
Assembly processing
# View registers.
(lldb) register read
# Change the PC register.
(lldb) register write pc `$pc+8`
# View the assembly instructions of the current stack frame.
(lldb) disassemble --frame (or dis -f)
# View the assembly instructions of the main function.
(lldb) disassemble -name main
# Single-step through assembly instructions and step over function calls.
(lldb) nexti
# Single-step through assembly instructions and step in function calls.
(lldb) stepi
Signal processing
# Print backtraces when signals are captured.
(lldb) process handle SIGSEGV -s true
# View the current signal processing configuration.
(lldb) process handle
Attaching to a process
# Attach to a PID, which requires the debugging permission.
(lldb) process attach -p 1234
Environment Setup
Local debugging (limited mode)
Obtain the root permissions for the HarmonyOS device.
Debug directly on the device. There is no need to use DevEco Studio.
Select the path of static lldb based on the CPU architecture and use hdc to transfer the path to the device.
hdc file send \DevEco Studio\sdk\default\HarmonyOS\native\llvm\lib\clang\current\bin\aarch64-linux-ohos\lldb /data/local/tmp/debugserver
Select the path of lldb-server based on the CPU architecture and use hdc to transfer the path to the device.
hdc file send \DevEco Studio\sdk\default\hms\native\lldb\aarch64-linux-ohos\lldb-server /data/local/tmp/debugserver
Remote debugging (primary mode)
One-click debugging:
- Download DevEco Studio and perform one-click debugging according to the debugging method of the IDE. For details, see Debugging on DevEco Studio.
- You can connect a Windows or macOS computer to a HarmonyOS device or Emulator to debug native C++ applications.
- Debug directly on DevEco Studio without pushing lldb or lldb-server.
Manual debugging:
- To manually perform remote debugging (without using DevEco Studio), for example, to debug binary files, ensure that the device has LLDB server and the PC has LLDB.
- Set up lldb-server. You are advised to push it using DevEco Studio. For manual push, select the path of lldb-server based on the CPU architecture and use hdc to transfer the path to the device.
hdc file send \DevEco Studio\sdk\default\hms\native\lldb\aarch64-linux-ohos\lldb-server /data/local/tmp/debugserver
Install LLDB on the PC (use the lldb.exe file on Windows). Then, establish a remote connection between the LLDB and the LLDB server on the OHOS device for debugging.
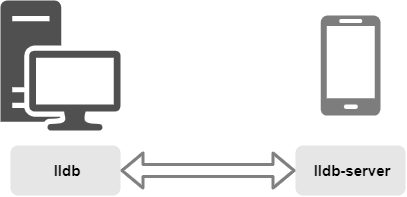
The following table describes the device status and supported debugging.
Status Supported Debugging lldb-server Path root image + SELinux disabled All types of C/C++ applications and binary files Any executable directory root image + SELinux enabled All types of C/C++ applications and binary files /data/local/tmp/debugserver user image + SELinux enabled HAP files compiled and signed in debug mode in DevEco Studio Automated deployment

root image: Run the hdc shell id command and uid=0(root) is displayed. Alternatively, run the hdc shell command to enter the interactive command environment and the prompt is #.
user image: Run the hdc shell id command and uid=2000(shell) is displayed. Alternatively, run the hdc shell command to enter the interactive command environment and the prompt is $.
SELinux enabled: Run the hdc shell getenforce command and Enforcing is displayed.
SELinux disabled: Run the hdc shell getenforce command and Permissive is displayed.
CAUTION
You are advised to create a native project in DevEco Studio and click the Debug button to automatically push the lldb-server. This avoids version compatibility and permission issues.
[h2]Using LLDB to Start and Debug Applications
The following walks you through on how to debug an executable file named a.out in HarmonyOS. The file contains debugging information and is generated by the Clang compiler, which is of the same version as LLDB.
Source file: hello.cpp
#include <iostream>
using namespace std;
int main() {
    cout << "hello world!" <<endl;
    return 0;
}
Compilation:
<clang distribution>/bin/clang++ --target=aarch64-linux-ohos --sysroot=<sysroot distribution> -g hello.cpp -o a.out
Obtain the executable file a.out.
Run the hdc shell command to enter the interactive command environment of the mobile phone and access the lldb path.
Run LLDB and specify the file to debug as a.out.
./lldb a.out
Set breakpoints at the main function in the code.
(lldb) b main
Run the application, and it stops at the first breakpoint.
(lldb) run
Continue to run the application.
(lldb) continue
List all the breakpoints.
(lldb) breakpoint list
Show the arguments and local variables of the current frame.
(lldb) frame variable
Run debugging commands as required to continue debugging.
Exit debugging.
(lldb) quit
[h2]Using LLDB to Debug Running Applications
The following walks you through on how to debug an executable file named a.out in the mobile phone. The file contains user input and debugging information and is generated by the Clang compiler.
Source file: hello.cpp
#include <iostream>
using namespace std;

int main() {
    int i = 0, j = 5, sum = 0;
    cout << "Please input a number of type int" <<endl;
    cin >> i;
    cout << i;
    sum = i + j;
    cout << sum <<endl;
    return 0;
}
Compilation:
<clang distribution>/bin/clang++ --target=aarch64-linux-ohos --sysroot=<sysroot distribution> -g hello.cpp -o a.out
Run the hdc shell command to enter the interactive command environment of the mobile phone and access the lldb path.
Start the application on CLI 1. (The message "Please input a number of type int" is displayed.)
./a.out
Run LLDB on CLI 2.
./lldb
Attach to the application.
(lldb) process attach --name a.out
Set a breakpoint in line 10 of hello.cpp.
(lldb) breakpoint set --file hello.cpp --line 10
Enter an integer on CLI 1.
88
Continue to run the application on CLI 2. The application stops at the breakpoint.
(lldb) continue
Run debugging commands as required to continue debugging.
Detach from the application.
(lldb) detach
Exit debugging.
(lldb) quit

You can attach to the application and set breakpoints in whichever order you like.
Remote Debugging

Remote debugging refers to cross-device debugging using LLDB. The following describes how to debug applications on HarmonyOS devices across devices.
For details about remote debugging based on DevEco Studio, see Starting Debugging.
During remote debugging, lldb-server and lldb must be used together.
The remote debugging procedures for Windows, Linux x86_64, and macOS are the same.
[h2]Remote Debugging on Root Image

The application or binary file to be debugged must be a native C++ project of the aarch64-linux-ohos architecture.
You are advised to disable SELinux during debugging.
Source file: hello.cpp
#include <iostream>
using namespace std;
int main() {
    cout << "hello world!" <<endl;
    return 0;
}
Compilation:
<clang distribution>/bin/clang++ --target=aarch64-linux-ohos --sysroot=<sysroot distribution> -g hello.cpp -o a.out
Open CLI 1 and disable SELinux.
hdc shell setenforce 0
Open CLI 1 and push lldb-server and a.out to the device.
hdc file send lldb-server hdc file send a.out /data/local/tmp/debugserver/debugserver
hdc shell chmod 755
/data/local/tmp/debugserver/lldb-server /data/local/tmp/debugserver/a.out
Run lldb-server. (8080 is a valid port number that is not in use. You can customize it.)
hdc shell /data/local/tmp/debugserver/lldb-server p --server --listen "*:8080"
Open CLI 2 and run the binary file lldb.
./lldb
Select and connect to the remote device on the LLDB CLI.
(lldb) platform select remote-ohos
(lldb) platform connect connect://localhost:8080
Specify the binary file a.out on the device to be debugged.
(lldb) target create /data/local/tmp/debugserver/a.out
Set breakpoints at the main function in the code.
(lldb) b main
Launch
(lldb) run
Display source code for the current target process.
(lldb) source list
Run debugging commands as required to continue debugging.
Exit debugging.
(lldb) quit
[h2]Remote Debugging on User Image

SELinux is enabled by default for the user image and cannot be disabled.
You are advised to use HUAWEI DevEco Studio to debug the HAP file of the HarmonyOS device running a user image.
lldb-server must be pushed to the specified directory /data/local/tmp/debugserver, for example, /data/local/tmp/debugserver/lldb-server or /data/local/tmp/debugserver/com.example.myapplication/lldb-server.
lldb-server is obtained from the aarch64-linux-ohos architecture directory. For details, see Table 1 Directories of the lldb-server tool.
In this example, the HAP file is compiled from the native C++ default project created based on DevEco Studio, which contains the debug information.
During debugging, ensure that the device is unlocked. The debugger cannot start when the screen is locked.
Open CLI window 1 and push lldb-server and the HAP file to the device.
hdc shell mkdir data/local/tmp/debugserver/com.example.myapplication
hdc file send lldb-server data/local/tmp/debugserver/com.example.myapplication
hdc shell chmod 755 data/local/tmp/debugserver/com.example.myapplication/lldb-server
hdc shell mkdir data/local/tmp/d333e74fe3ab488aad622a7055fbf396
hdc file send C:\Users\xxx\DevEcoStudioProjects\MyApplication\entry\build\default\outputs\default\entry-default-signed.hap data/local/tmp/d333e74fe3ab488aad622a7055fbf396
Install and run the HAP file, and disable appfreeze.
hdc shell bm install -p data/local/tmp/d333e74fe3ab488aad622a7055fbf396
hdc shell aa start -a EntryAbility -b com.example.myapplication
hdc shell aa attach -b com.example.myapplication
Run lldb-server.
hdc shell aa process -a EntryAbility -b com.example.myapplication -D "/data/local/tmp/debugserver/com.example.myapplication/lldb-server platform --listen unix-abstract:///lldb-server/platform.sock"
Open CLI 2 and run the binary file lldb.
./lldb
Select and connect to the remote device on the LLDB CLI.
(lldb) platform select remote-ohos
(lldb) platform connect unix-abstract-connect:///lldb-server/platform.sock
Add the search path of the target executable file.
(lldb) settings append target.exec-search-paths "C:\Users\xxx\DevEcoStudioProjects\MyApplication\entry\build\default\intermediates\cmake\default\obj\arm64-v8a"
Set a breakpoint at line 6 in the source code.
(lldb) breakpoint set --file "C:/Users/xxx/DevEcoStudioProjects/MyApplication/entry/src/main/cpp/napi_init.cpp" --line 6
Specify the PID of the application corresponding to the HAP file on the device to be debugged.
(lldb) attach <pid>
Tap the device application to continue the response. The application stops at the breakpoint.
Continue the debugging.
(lldb) continue
Show the stack backtrace for the current thread.
(lldb) bt
Run debugging commands as required to continue debugging.
Exit debugging.
(lldb) quit
FAQ
When the run command is executed in the LLDB debugging environment, the console returns "error: 'A' packet returned an error: 8" or a similar error code indicating that the debugger cannot create a debugging process. What should I do?
This problem is usually caused by insufficient permissions. You are advised to perform the following steps to locate the fault:
(1) Check whether Developer options is enabled on the target device.
If not, enable it and then debug the device.
(2) Check whether the current user has the debugging permission on the target process.
user can debug only applications, not executable files.
What should I do if the error message "Permission denied" is displayed when I run lldb-server?
Generally, this is caused by the lack of the execute permission on lldb-server. You can add the execute permission.