Introduction
DevEco Profiler visualizes performance data in the data area. The visualization capabilities vary with the template you use. This topic describes the common capabilities available for all templates.

The data area can be divided into five parts.
① Toolbar: manages features such as marking, favoriting, offline symbol import, lane filtering, and lane startup configuration, as well as control over session status and the timeline.
 : Click this button to view all markers that have been placed. You can view or redirect to the marker description and time, and change the marker color.
 : Click this button to hide or collapse favorite lanes. The active state hides or collapses favorite lanes; the inactive state displays them.
 : Click this button to import a native library with debugging symbols. The corresponding native function stack symbols will be restored.
 : Click this button to filter lanes. Filtering out the lanes excluded from recording reduces the overhead of data collection, but also reduces data analysis dimensions.
 : Click this button to view and manage the plugin startup settings for different lanes. You can save these settings to a configuration file, and they will automatically be applied when you use this template type in the future.
② Timeline: provides a horizontal timeline to display the timestamps of data.
③ Marker bar: places markers to mark critical time points or periods.
④ Lane panel: displays lanes. A series of lanes is preset for each scenario-specific template. For example, Frame shown in the figure is a lane. A lane is the minimum unit of data to be analyzed in a specific dimension in DevEco Profiler. A lane presents performance data of a dimension. You can view data changes over time to identify anomalies. Drag to select a time range and view the corresponding details in the details panel.

- Lanes in each scenario-specific template follow the top-down analysis principle. Lanes at the bottom correspond to performance metrics closer to the underlying layer of the system. It is recommended that you analyze in top-down order.
- The panel in a lane displays performance changes over time, helping you locate the problematic time period. You can then view detailed data for each dimension during that period in the details panel and analyze specific parameters or attributes affecting performance.
⑤ Details panel: displays data details. After you select data in a lane, detailed data in the selected period is displayed in different graphs. The More panel provides supplementary description for the selected data on the details panel on the left.
[h2]Session Control
In the data area, you can start or stop a session by clicking the first button on the toolbar. The following figure shows the state transition of the first button with the data collecting status. If the first button is dimmed, data collecting is complete. The buttons provide the same effect as data collecting in the session area.

[h2]Timeline Control
DevEco Profiler provides various timeline operations.

 : displays all the data. After you click this button, the timeline is automatically adjusted and data within the session duration is displayed.
 (shortcut key: W or Ctrl+mouse wheel): zooms in to the timeline. After you click this button, the total duration displayed on the timeline decreases and more data details are displayed.
 (shortcut key: S or Ctrl+mouse wheel): zooms out of the timeline. After you click this button, the total duration displayed on the timeline increases, so you can better view the overall data trend.
You can drag the slider under the lane panel (shortcut keys: A, D, or Shift+mouse wheel) to adjust the time range shown in the timeline. You can drag the slider on the right of the lanes (or scroll the mouse wheel) to scroll the lanes up and down. For details about how to use the shortcut keys, see Shortcut Keys.

Shortcut keys are available only in the active lane area, which is indicated by a bright blue selection border.
[h2]Viewing the Details Panel
If you find suspicious data on the lane panel, you can use rectangle selection or click selection to select the data to be displayed on the details panel. You can click data in a lane to trigger click selection, or click, hold, and drag the mouse on the lane panel to trigger rectangle selection. You can hold down Alt during rectangle selection. In this case, the lane in the selected time period fills the entire lane panel when you finish selection.
Different lanes display data in different dimensions. Therefore, the data displayed on the details panel corresponds to the lane selected on the lane panel. The selected lane is displayed in blue. If you select a lane without performing rectangle selection or click selection, the details panel displays the complete and detailed data of the lane, as if you used rectangle selection to select the entire lane.
[h2]Adding or Editing Markers
DevEco Profiler provides markers to help you mark key time points or periods. It provides two types of markers:
- Single-point marker: Click a time point, and mark it (shortcut key: M). The icon
 (the color is customizable) is displayed.
- Time period marker: Drag to select a time period and click
 in the upper-right corner to add the start marker (shortcut key: Shift+M).
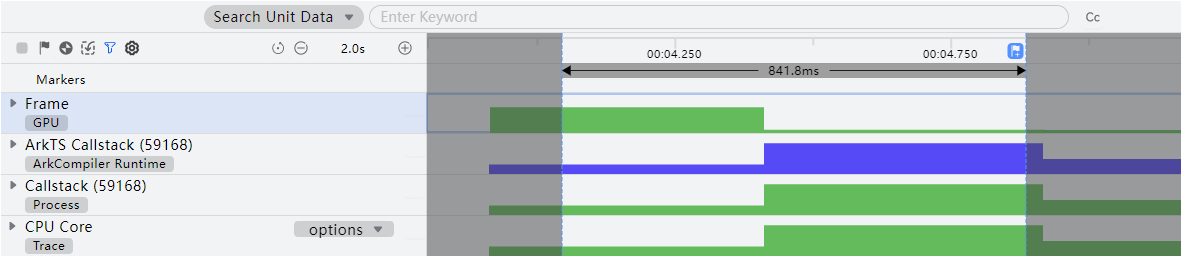
After a marker is placed, you can double-click the marker and modify its description and color in the displayed dialog box, or delete the marker.

You can press Ctrl+, to select a single-point marker forward; press Ctrl+. to select a single-point marker backward; press Ctrl+[ to select a time period marker forward; press Ctrl+] to select a time period marker backward.
In addition, DevEco Profiler shows the time difference between markers. Select a marker, then hover over another marker to see the time difference between the hovered and selected markers in the lower-right corner  of the panel. This feature is especially useful for analyzing time-sensitive performance problems.
[h2]Favoriting Lanes
If there are too many lanes, your concerned lanes may be far away from each other, leading to low analysis efficiency. To address this issue, DevEco Profiler enables you to favorite lanes. Specifically, hover over a lane, and click the  icon displayed to add the lane to favorites.

You can click the icon again to remove the lane from favorites. DevEco Profiler also supports lane collapse. You can click  to fold the favorite lanes.

For a favorited parent lane whose title is not fully displayed, hovering over the title area of the parent lane will show its title information.
For a favorited sub-lane, hovering over the title area of the sub-lane will show the title information of its parent lane and itself.

[h2]Expanding or Collapsing Sub-lanes
Use either of the following methods to expand or collapse sub-lanes:
1. Click  on the left of the parent lane.
2. Double-click the header area of the parent lane.
[h2]Global Search
To help you quickly search for concerned performance data, DevEco Profiler provides global search.
- Specify the search type in the search box. Select Search Units if you are looking to find specific lanes or Search Unit Data to search lane data. By default, the system searches lane data.

- Search for lane data. You can specify whether to search across the entire time range or within a selected time range both before you enter the search keywords and after the search results are displayed. In addition, you can select a particular lane to search within.

- Click the Cc button to toggle case sensitivity for keywords. Case-insensitive search is enabled by default. Clicking the button automatically re-triggers the search, and the result count is displayed on the right side of the search bar. Keywords that yield matches are logged in the search history. You can click
 or
 to navigate through the results. As you click through the results, the lane panel automatically jumps to the corresponding location, highlighting the selected result, and the details panel automatically refreshes to display the detailed data.

To help you analyze native function hotspots, DevEco Profiler supports symbol import. You can click  on the toolbar and select the .so library with debugging information to import. The tool uses the information to convert the collected function offset information into source code symbols (including system .so libraries, user-compiled .so libraries, and third-party libraries).


- For offline import of .so libraries with symbol information, their optimization levels (such as -O1, -O2, and -O3) must strictly match those of release .so libraries. You can view or configure the compilation optimization level in CMakeLists.txt.
- To prevent start address mismatches from affecting resolution accuracy, ensure the offline-imported .so library with symbol table information uses the same compiler flags as the release .so library.
Finding the source code of the problem is the most important part in profiling. For the function stack frame information displayed on the details panel (as shown in the figure below), you can double-click a stack frame node. The tool opens the related source code file in the editor and locates the code line. The prerequisite for using this feature is that the app being debugged is compiled in the current project of DevEco Studio and the source file is not moved.
