Located on the left of DevEco Profiler, the session area can be divided into three parts.
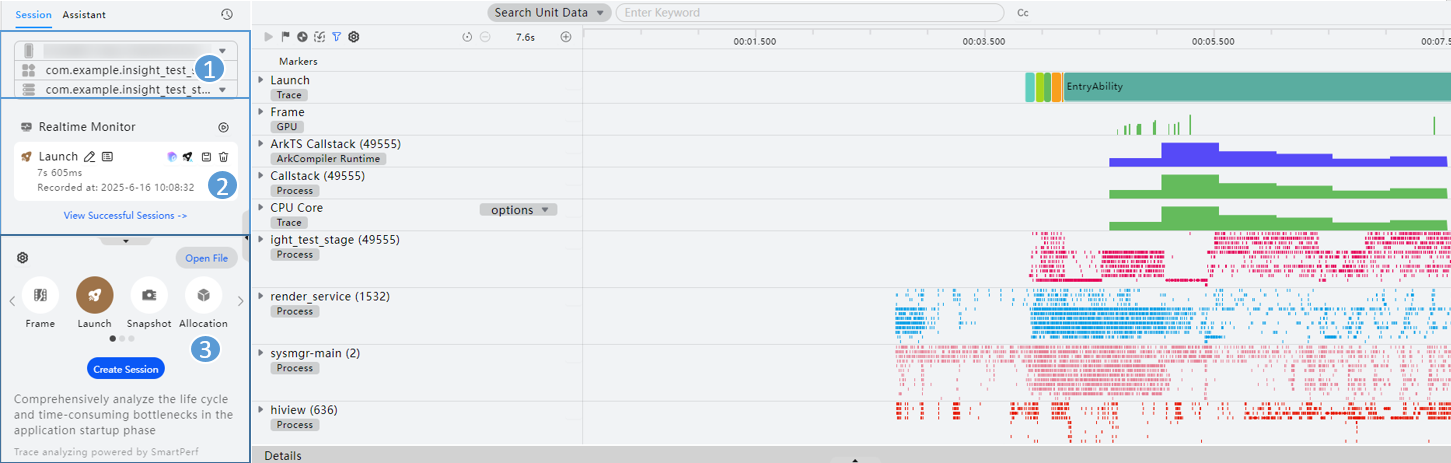
① Target selection area, where you can select a device, an app, and a process as the analysis target.
② Session list area.
- This area records all created profiling sessions, which can be reordered via drag-and-drop. Realtime Monitor tasks are displayed by default. Each session consists of the session name (Launch in the figure), current status (Recorded in the figure), and recording duration (7s 605ms in the figure). Click a session entry in the list to display its detailed data in the right-side data panel.
- Recording/Deleting a session: Hover over
 to check basic information of the profiling target in a tooltip. Click
 or
 on the right to start or stop recording when manipulating the target app to reproduce performance degradation scenarios.
 appears upon recording completion, indicating ongoing data parsing. Wait for parsing to finish. Click
 to delete the session.

- Only sessions that are successfully imported or have data successfully captured can be put in the session list. Sessions that fail to start or fail to have data captured are automatically deleted from the list after you change the device or app for analysis.
- Exporting data: After data parsing is complete, the session enters the data display state and data is displayed in the data area on the right. You can click
 on the session panel to export the data to the local host. Data export facilitates data sharing and prevents the loss of collected performance data.
- Viewing sessions: The session list contains active and historical sessions. Active sessions are displayed directly on screen, while historical sessions become visible only after you click View Successful Sessions. The total number of the two types of sessions cannot exceed 15. After you select a new profiling target, all existing active sessions are moved to the historical session list. Historical sessions support session deletion and data export.
③ Scenario-based template selection area.
- Creating a session: DevEco Profiler provides scenario-based analysis templates such as Frame, Launch, Snapshot, Allocation, ArkUI, ComMemory, Energy, ArkWeb, Network, Concurrency, Time, CPU, and FileSystem. These templates provide targeted data analysis solutions for various performance issues. Select a template icon and click Create Session below to create a session.
- Importing data: Click Open File to select data to be imported. Currently, .insight, .htrace, .ftrace, .heapsnapshot, .rawheap, .sys, .perfdata, .data, .nas (files containing native allocation data), .txt (files containing native allocation data), and .acm files can be imported.
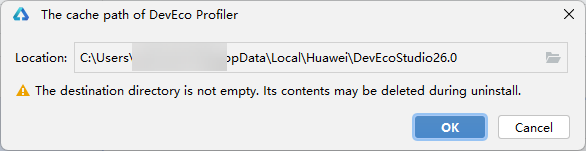
- Configuring the Profiler cache path: Click
 in the upper-left corner to set the path for storing Profiler cache files.