This section describes how to determine whether an app has janky frames, and then analyze the app's runtime logic using call stacks and trace information to identify the root causes.
For details about the basic operations related to app stuttering analysis, see Frame Analysis.
Analysis Steps
To analyze app stuttering issues:
- Check whether janky frames exist.
- If janky frames exist, further pinpoint the issue based on the call stack and trace information.
- Select the Frame lane. The Statistics area in the lower part of the window displays the frame information in the selected time range by process. If Jank Count is greater than 0, janky frames exist.
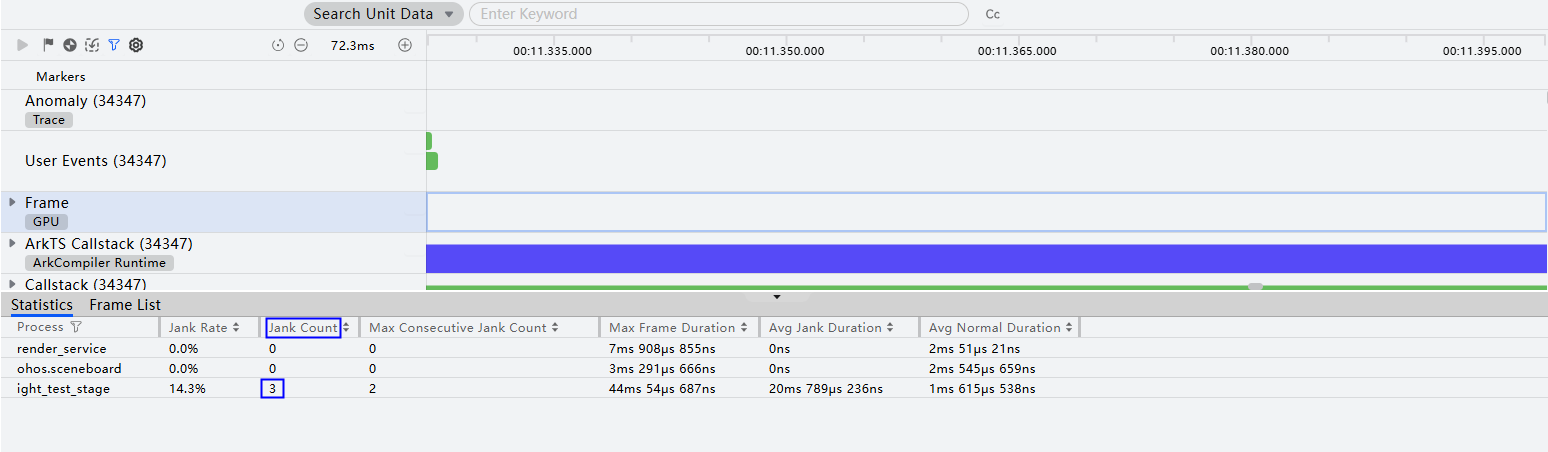
- Find the process with janky frames in the Statistics tab, and click the jump button next to the process name to go to the Frame List tab.

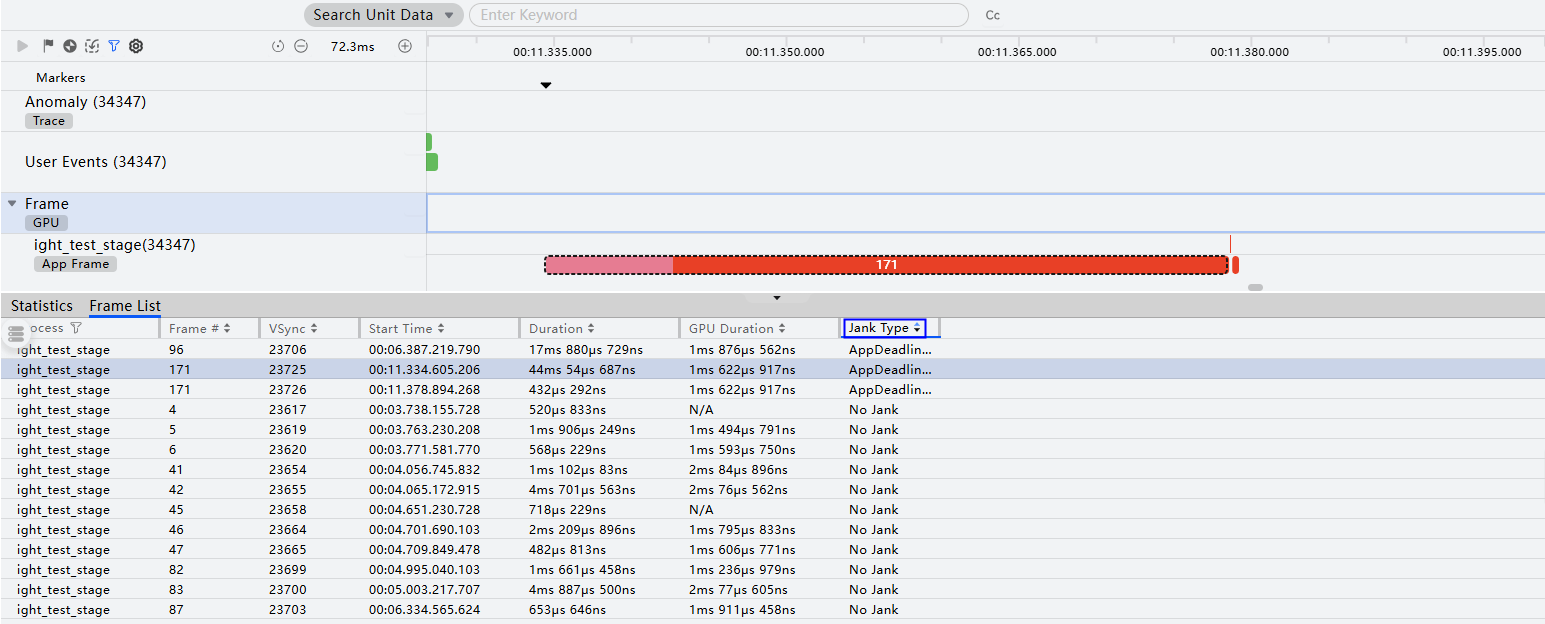
- On the Frame List tab, sort the process's frames by Jank Type in ascending order. You can click any janky frame on this tab to jump directly to that frame, and the frame will be selected in the lane.

- In the sub-lanes labeled RS Frame or App Frame, frames that are rendered normally are displayed in green; janky frames are displayed in red.
- AppDeadlineMissed indicates app-side frame stuttering.
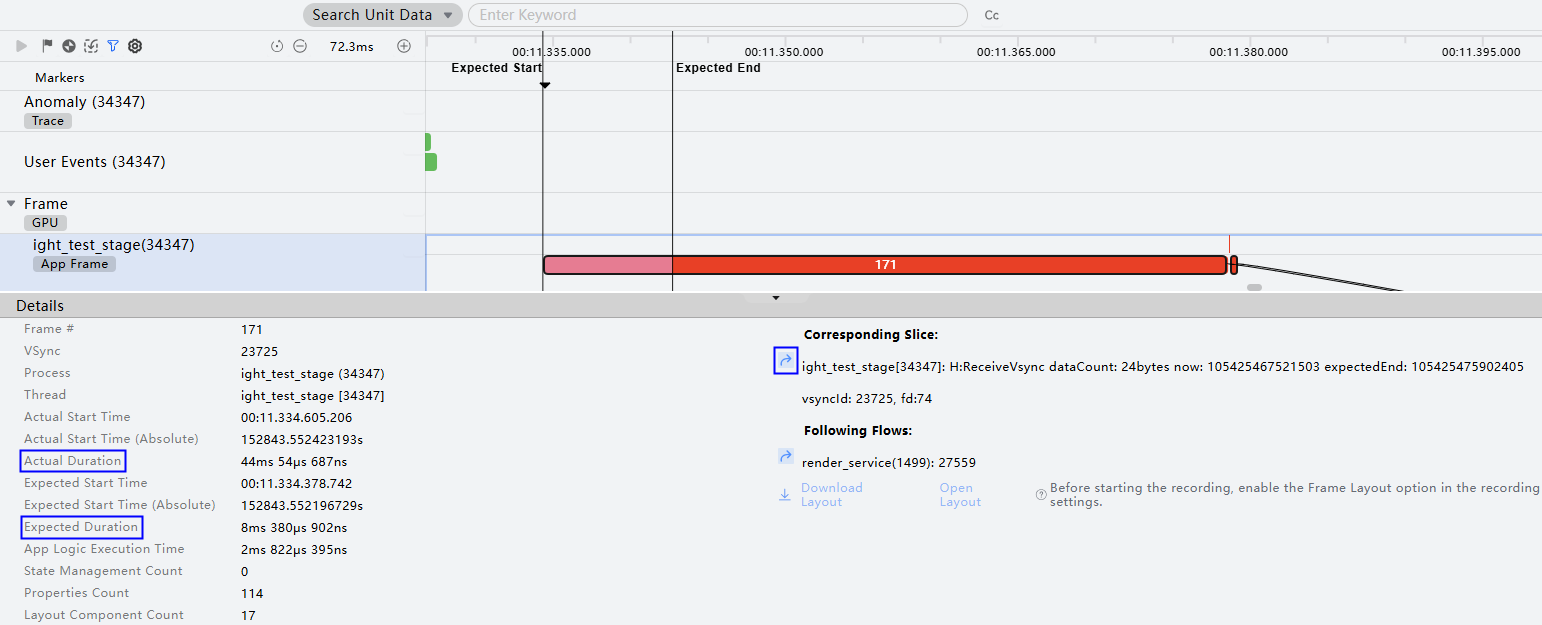
- Click the janky frame. The Details pane in the lower part of the window displays key information about this frame. Click the jump button in front of the app process on the right to navigate to the app process trace.
- Expected Duration: expected duration for rendering a frame. It is related to the frame rate. For example, if the frame rate is 120, and the corresponding Vsync period is 8.3 ms. That is, the frame rendering duration on the app or Render Service must be within 8.3 ms.
- Actual Duration: actual duration for rendering a frame.
As shown in the following figure, the expected frame rendering duration is 8 ms 330 μs, and the actual duration is 44 ms 54 μs, which far exceeds the expected duration. Thus, this frame is identified as a janky frame.
- Select the time range of the abnormal frame and conduct further analysis to locate the root causes based on the ArkTS Callstack lane, Callstack lane, and trace information.
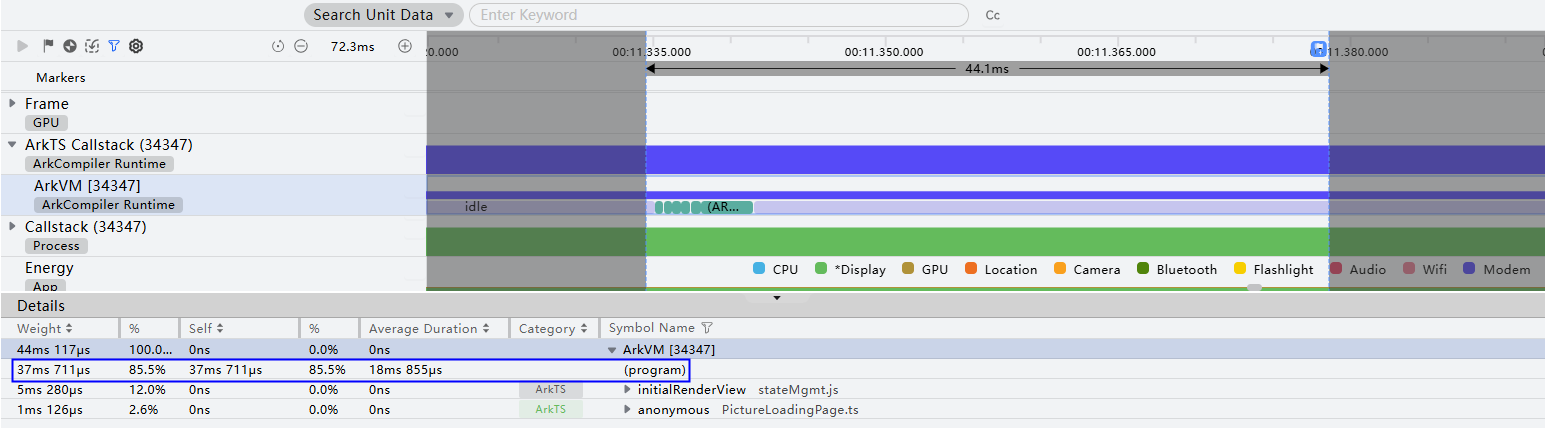
- Locate and select the abnormal frame to analyze. Check the ArkTS Callstack lane to analyze time-consuming functions on the ArkTS side. Prioritize the main thread call stack, that is, the ArkVM sub-lane where the thread ID matches the process ID. Here, you can view the execution duration of some methods on the ArkTS side.
- Check the call stack in the figure below. Except for (program), the execution time of all other entries in the call stack is within the expected frame rendering duration—8.3 ms (since the optimized device runs at 120 fps). Thus, the key focus for analyzing this janky frame is the execution time of (program).
(program) indicates that the program has entered a phase of pure native code execution. During this phase, no ArkTS code runs, nor are there any instances of ArkTS calling native code or native code calling ArkTS. As such, it is generally difficult to derive effective information from this phase, and you need to switch to the Callstack lane to view specific call stack details.
- Switch to the Callstack lane and check the main thread sub-lane (where the thread ID matches the process ID). Scroll to observe the function call stack with the largest proportion in the % column of the Heaviest Stack area below. In the Category column, bright colors represent the developer call stacks, while gray represents the system call stacks. It can be seen that the time spent in the figure below is mainly in system-side .so files, and the specific cause of the abnormality cannot be identified. Next, further analyze the app process trace information.

You can also click Call Trees at the bottom to hide system call stacks, reducing interfering information.
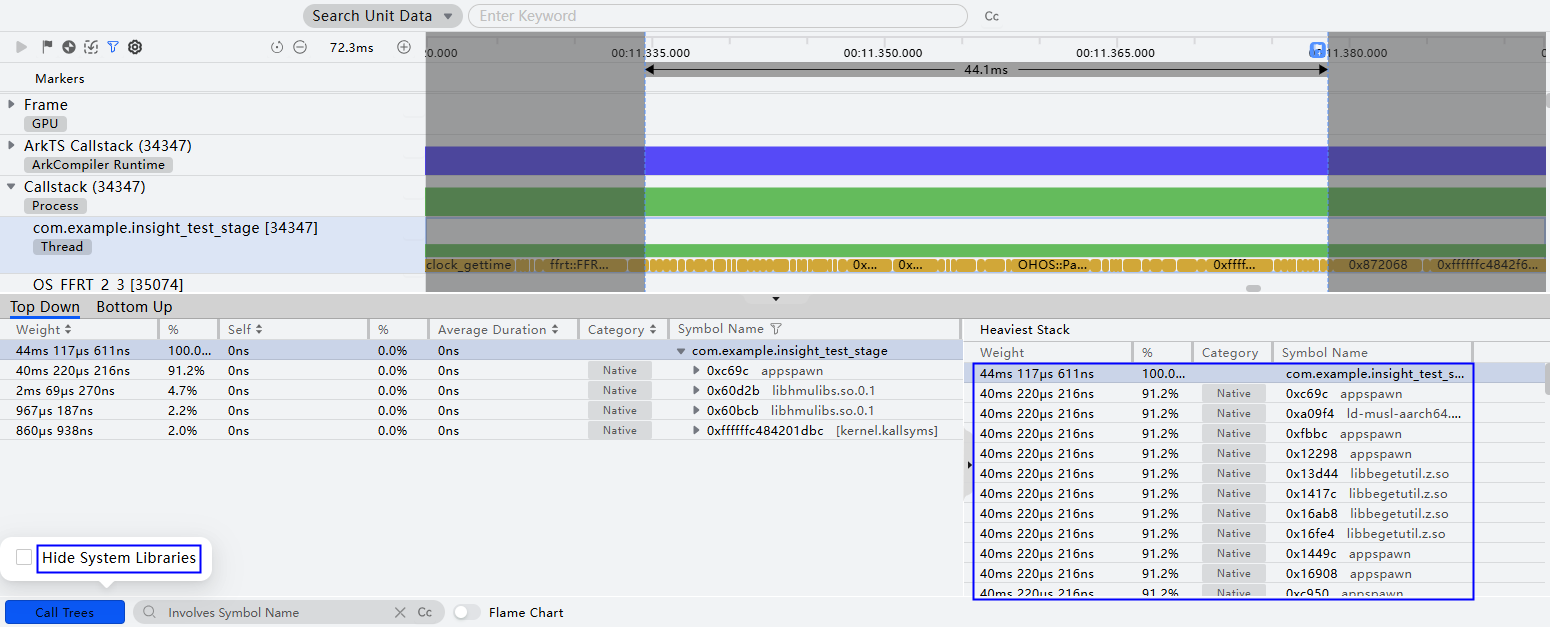
- Switch to the Process lane and view the main thread (whose thread ID is the same as the process ID).
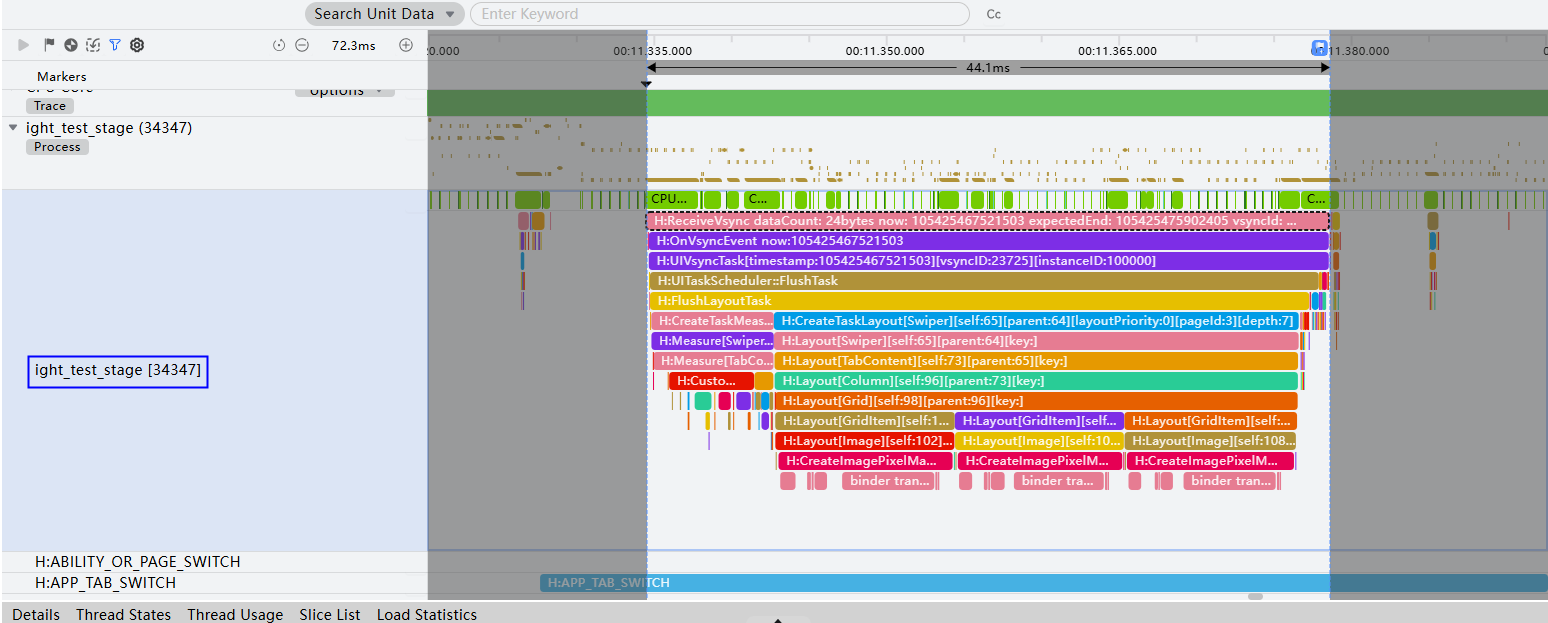
- The trace statistics list is available in the Details area at the bottom of the window. By expanding the most time-consuming trace layer by layer, you can pinpoint that the main time cost comes from three H:CreateImagePixelMap operations. Next, analyze the time consumption of the three H:CreateImagePixelMap operations.
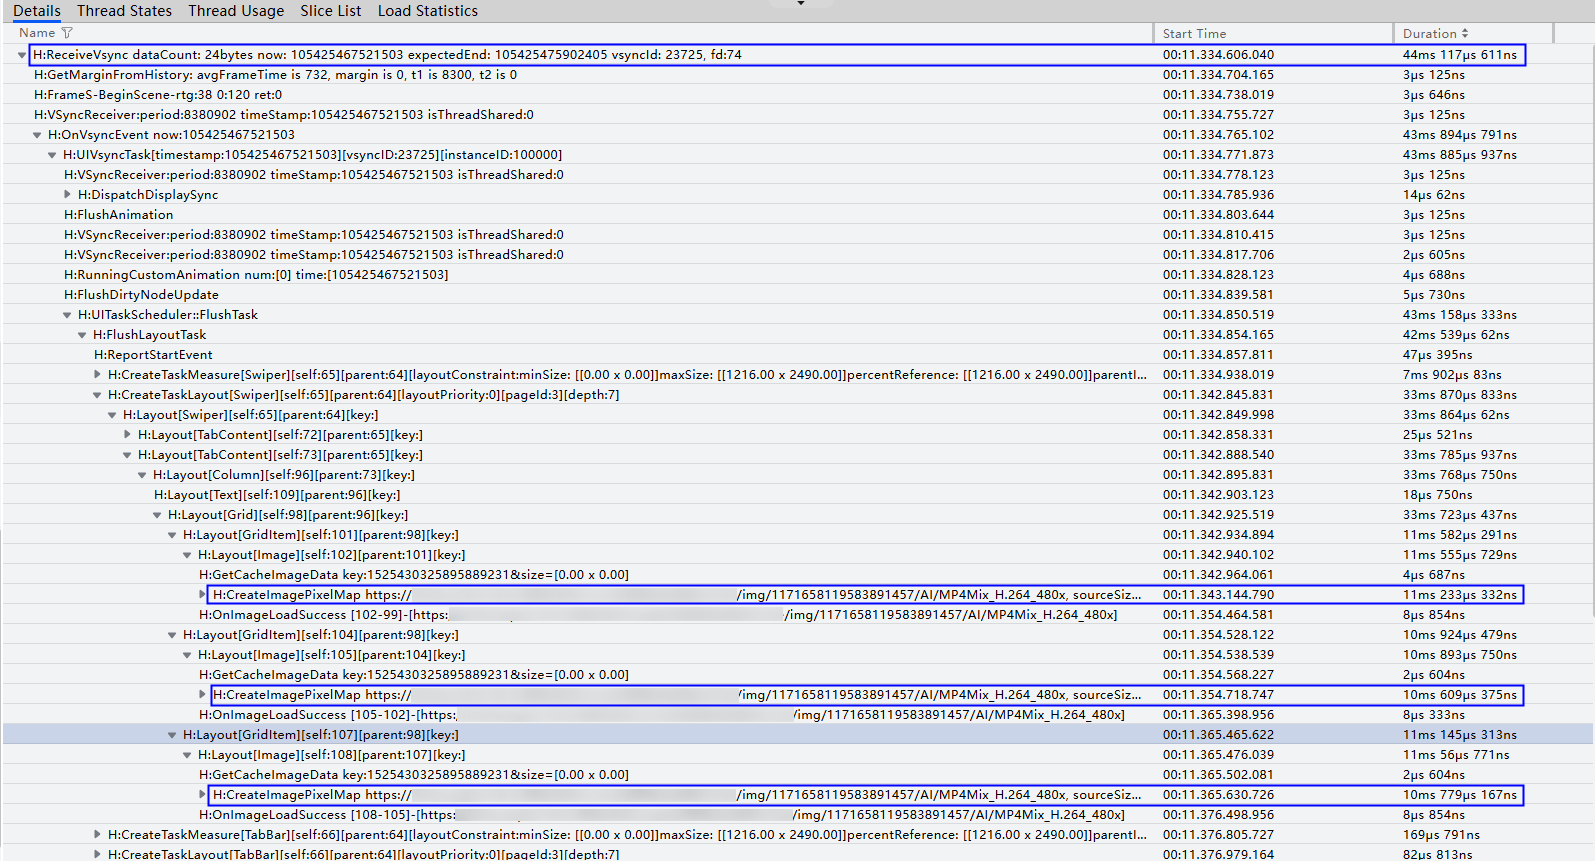
- H:CreateImagePixelMap is related to image loading. By checking the service code, it can be seen that this is due to the synchronous loading of network images. You are advised to change the loading mode to asynchronous.


Generally, the image loading process is performed asynchronously to avoid blocking the main thread and to streamline UI interaction. Synchronous loading is not recommended when the image loading takes a long time.