You can view disassembly code and debug with DevEco Studio. In addition, when the program breaks at a location without source code (for example, stepping into a function without debugging information), DevEco Studio automatically opens the disassembly view to display the current stop address of the program and the corresponding disassembly code.
Disassembly View
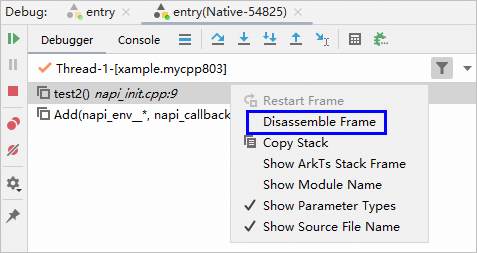
To view the assembly code corresponding to a stack frame, right-click the stack and choose Disassemble Frame from the shortcut menu.
On the Disassembly page, you can view the source code, function names, and switch to the corresponding source code.


