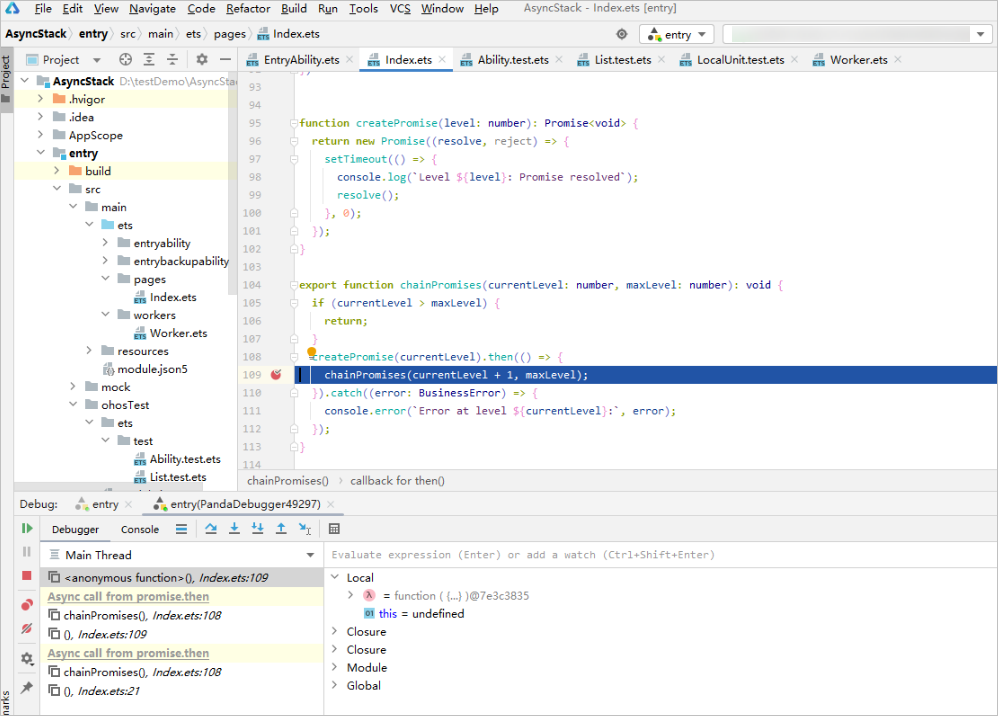
Since DevEco Studio 5.1.1 Beta1, you can enable the asynchronous stack tracing feature and set the asynchronous call chain depth to trace the sequence of asynchronous function calls.

- The Async Stack Traces feature is a global setting. Once enabled, it takes effect for all projects.
- After modifying Async Stack Traces or Async call chain depth, you need to restart debugging or start a new debugging session for the changes to take effect.
- The asynchronous stack of the setTimeout function does not take effect.
- The asynchronous stack does not display the variable list.
- Choose File > Settings (DevEco Studio > Preferences/Settings on macOS) > Build, Execution, Deployment > Debugger > Async Stack Traces(ArkTS).
- Check Enable async stack traces.
- Set Async call chain depth to a value greater than 0 to display the corresponding call chain layers during stack debugging.

- Set breakpoints in the asynchronous call chain and start debugging. After a breakpoint is hit, the stack list will display the corresponding call layers. If the actual number of call layers is less than the configured Async call chain depth, only the actual layers will be shown. Each asynchronous call in the chain is delimited by Async call from, followed by the calling function.