This section describes how to identify native memory leaks in an app.
For versions earlier than 6.1.0(23) Beta1, use the Native Allocation lane to locate the cause of native memory leaks.
For 6.1.0(23) Beta1 and later versions, use the All Heap lane to locate the cause of native memory leaks.
Identifying Memory Issues
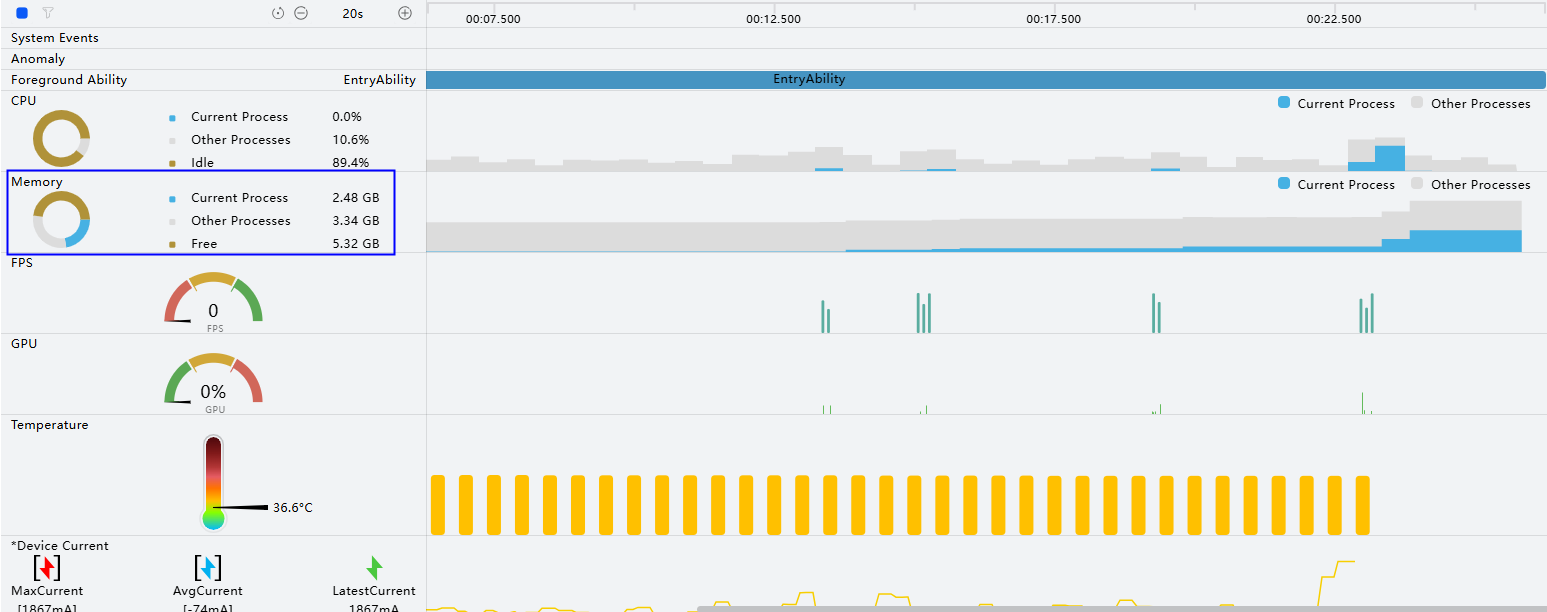
- Use the real-time monitoring feature to monitor the app's memory resources. Operate the app and observe changes in the Memory lane during execution.
If memory usage remains stable or returns to a normal level after a temporary increase, the app likely does not have a memory leak. Conversely, if memory usage continues to increase without returning to a normal level, or grows significantly beyond expectations, a memory leak is probable.
- Once a potential memory issue is identified, perform deep recording to capture detailed memory data of the app in the problematic scenario, so as to preliminarily locate the issue. You can use either the Allocation or Snapshot template in the Memory lane for recording.
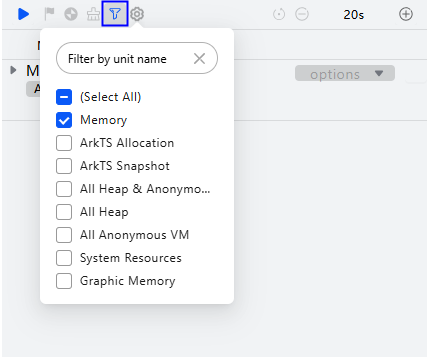
- Create an analysis task (taking the Allocation template as an example), and then deselect all lanes except the Memory lane to record only data in the Memory lane.

Other lanes will capture data such as memory allocation and memory objects. To avoid extra overhead and impact on analysis, you are advised to exclude these lanes from recording.
- Click
 to start recording.
- During recording, continuously perform app operations in the suspected scenario to help reproduce the issue.
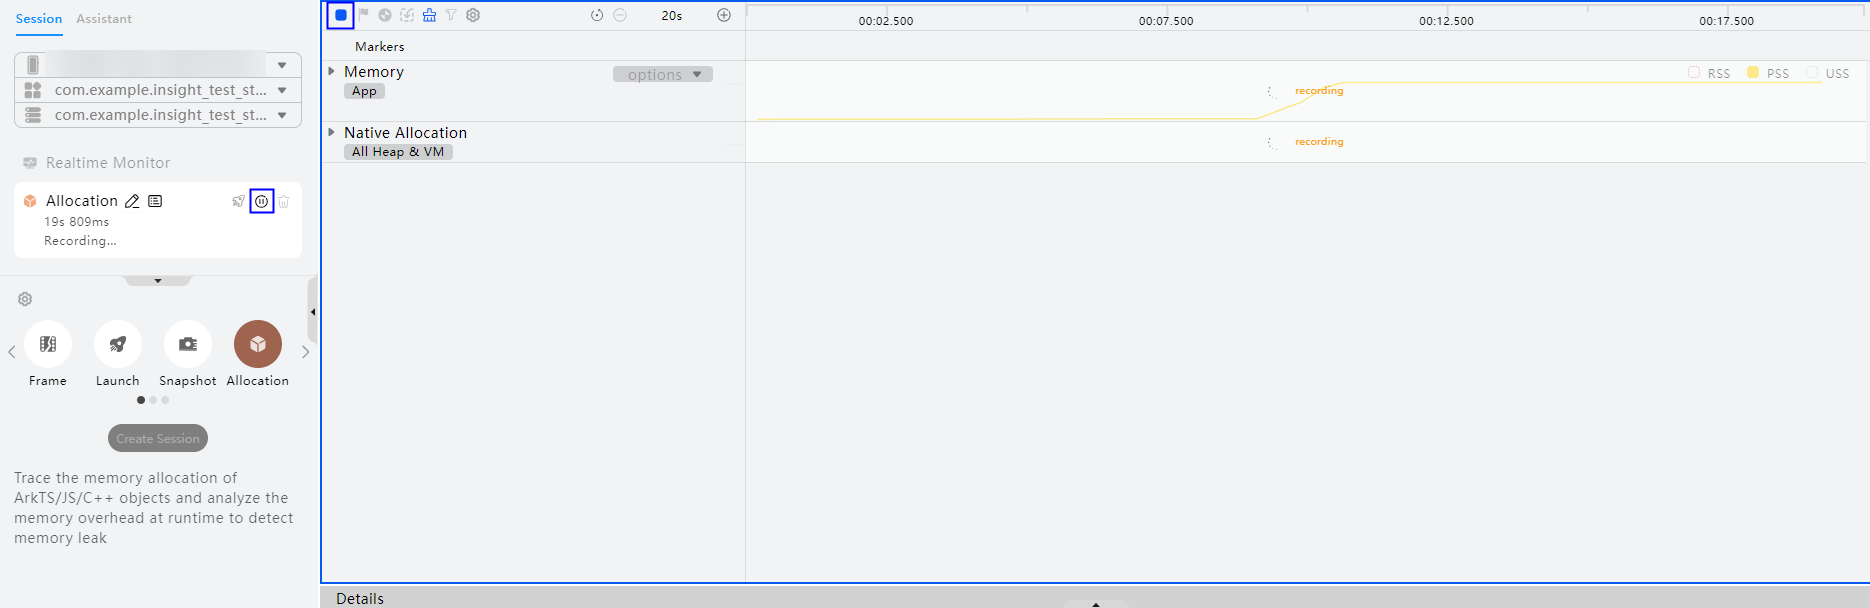
- To stop recording, click the stop or pause button, as shown in the figure below.
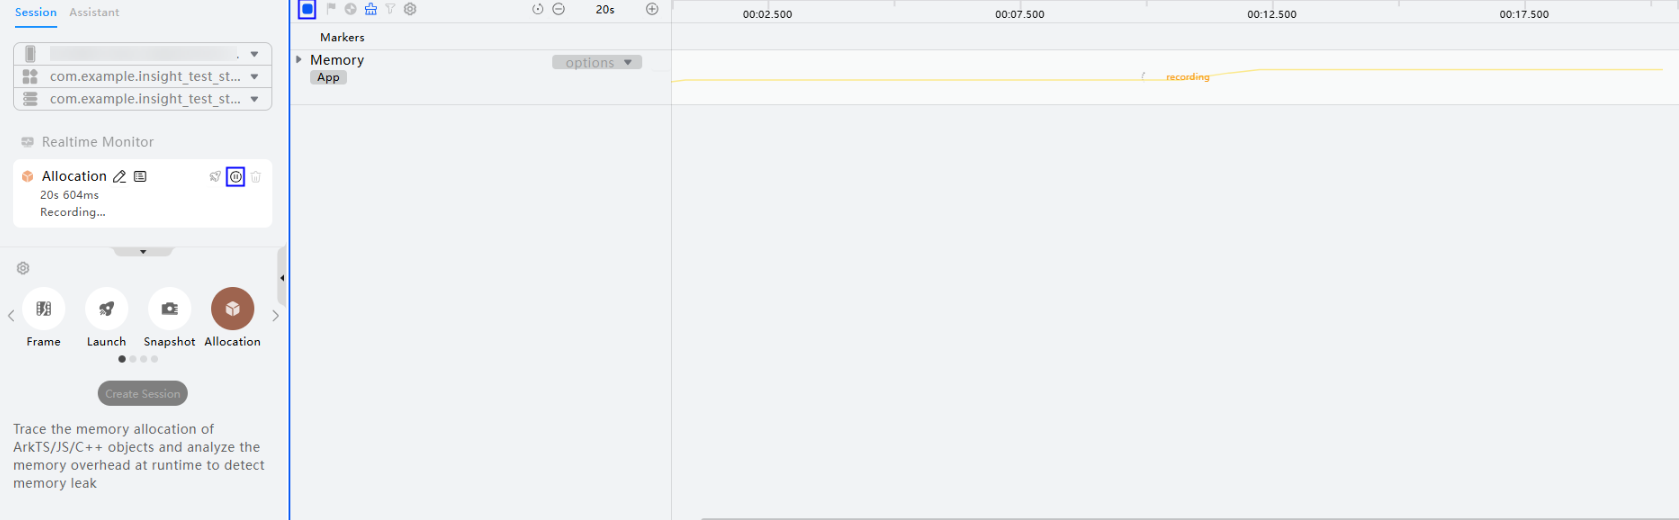
- After the recording is complete, expand the Memory lane. Native Heap refers to native memory, which mainly includes memory allocated via native APIs and heap memory requested in native code (typically C/C++). This memory must be manually managed by developers.
A significant rise in Native Heap may indicate a native memory leak. In this case, you can use the Allocation template for further analysis.

[h2]Recording Data with the Template
- Connect the device and click the app selection box to select the target app. Select the Allocation template, and click Create Session or double-click the Allocation icon to create an allocation session.
- Click the triangle button to start recording.

To analyze the launch memory, click
 next to the allocation task.

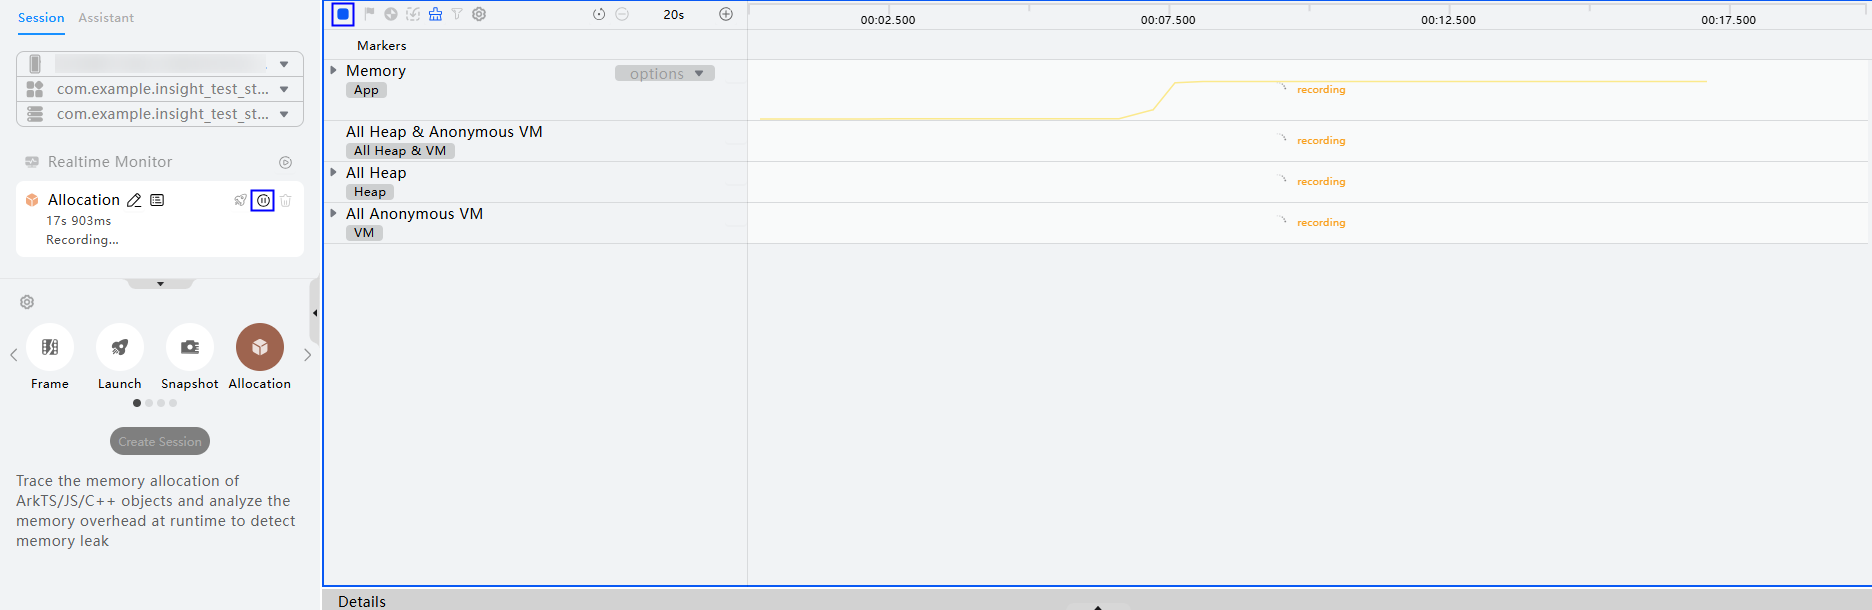
- Operate the app to reproduce the issue. After the issue is reproduced, click the square button in the following figure or the stop button on the left to stop recording.

By default, the statistics mode is used for data collection, where the tool delivers better collection performance and lower load.
[h2]Analyzing Native Data
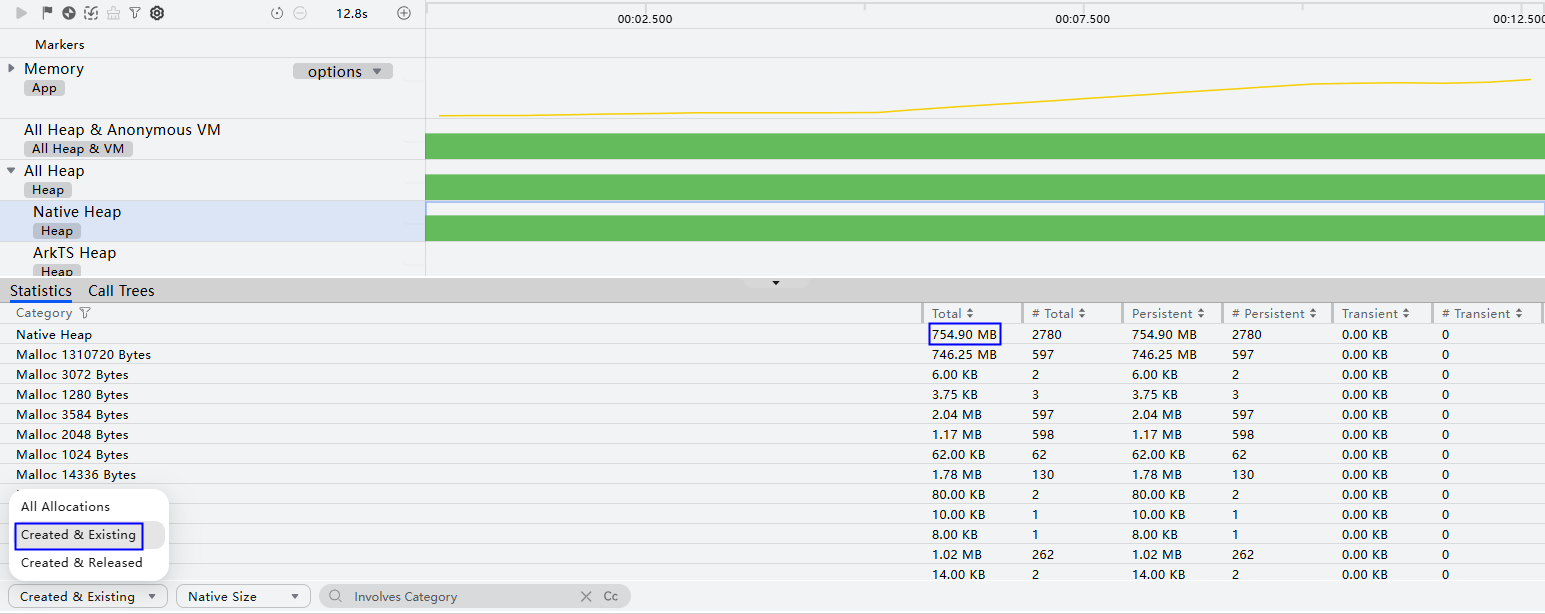
- Drag to select the Native Heap sub-lane in All Heap.
- On the Statistics tab page in the details area, select Created & Existing.
- All Allocations: indicates all memory allocation information within the selected time range.
- Created & Existing: indicates the memory that is allocated after the start of the selected range and not released before the end of the selected range. This option is selected by default.
- Created & Released: indicates the memory that is allocated after the start of the selected range and released before the end of the selected range.
- Switch to the Call Trees tab, which displays detailed information about the memory allocation stack.
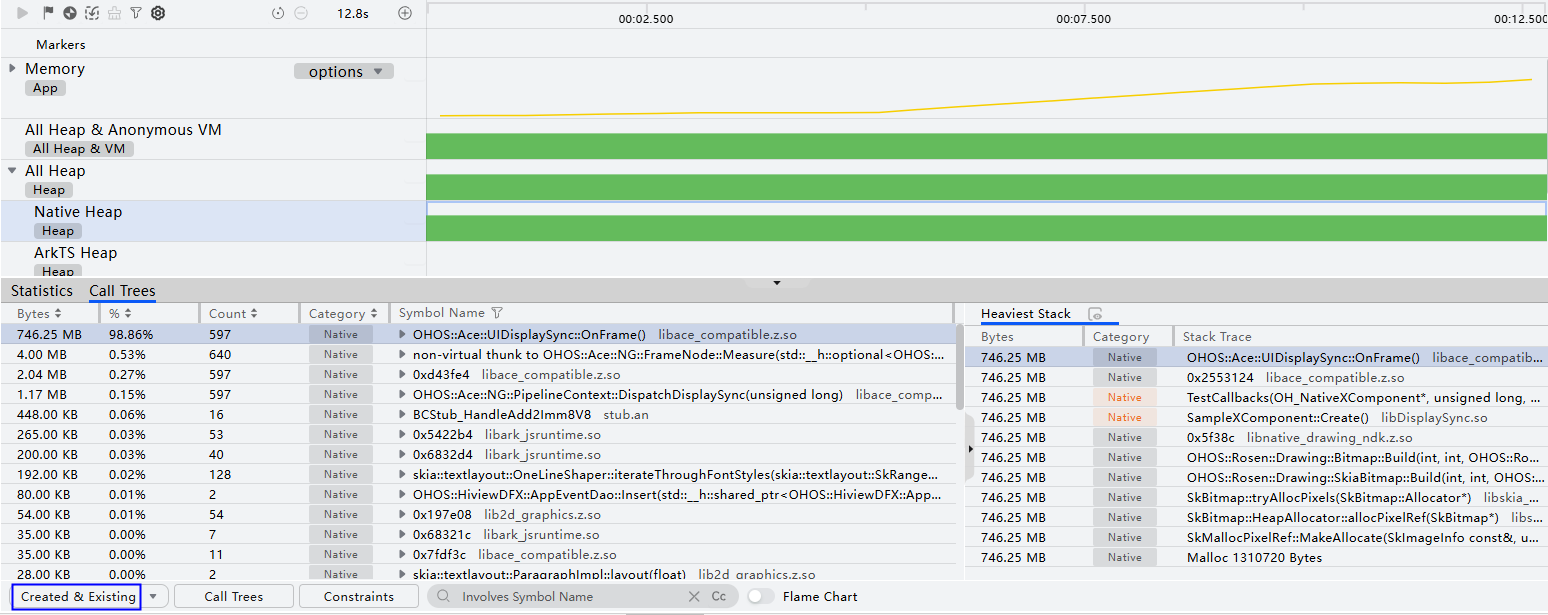
- Prioritize searching the memory allocation stack information for symbol names that are strongly related to the service code. These symbol names will appear in a bright color in the Category column. As shown in the figure above, the main leak sources lie on the service code. Conduct analysis based on the service code.

- In the Category column, the bright color indicates the developer call stack, and the gray color indicates the system call stack.
- Stack frames are predominantly native stacks. To facilitate the analysis of native function hotspots, the tool supports symbol importing. To inspect related stack details, import symbol-bearing .so libraries matching the corresponding version. For details, see Offline Symbol Parsing.
[h2]Recording Data with the Allocation Template
- Connect the device and click the app selection box to select the target app. Select the Allocation template, and click Create Session or double-click the Allocation icon to create an allocation session.
- Click the triangle button to start recording.

To analyze the launch memory, click
 next to the allocation task.

- Operate the app to reproduce the issue. After the issue is reproduced, click the square button in the following figure or the stop button on the left to stop recording.

By default, the statistics mode is used for data collection, where the tool delivers better collection performance and lower load.
[h2]Analyzing Native Data
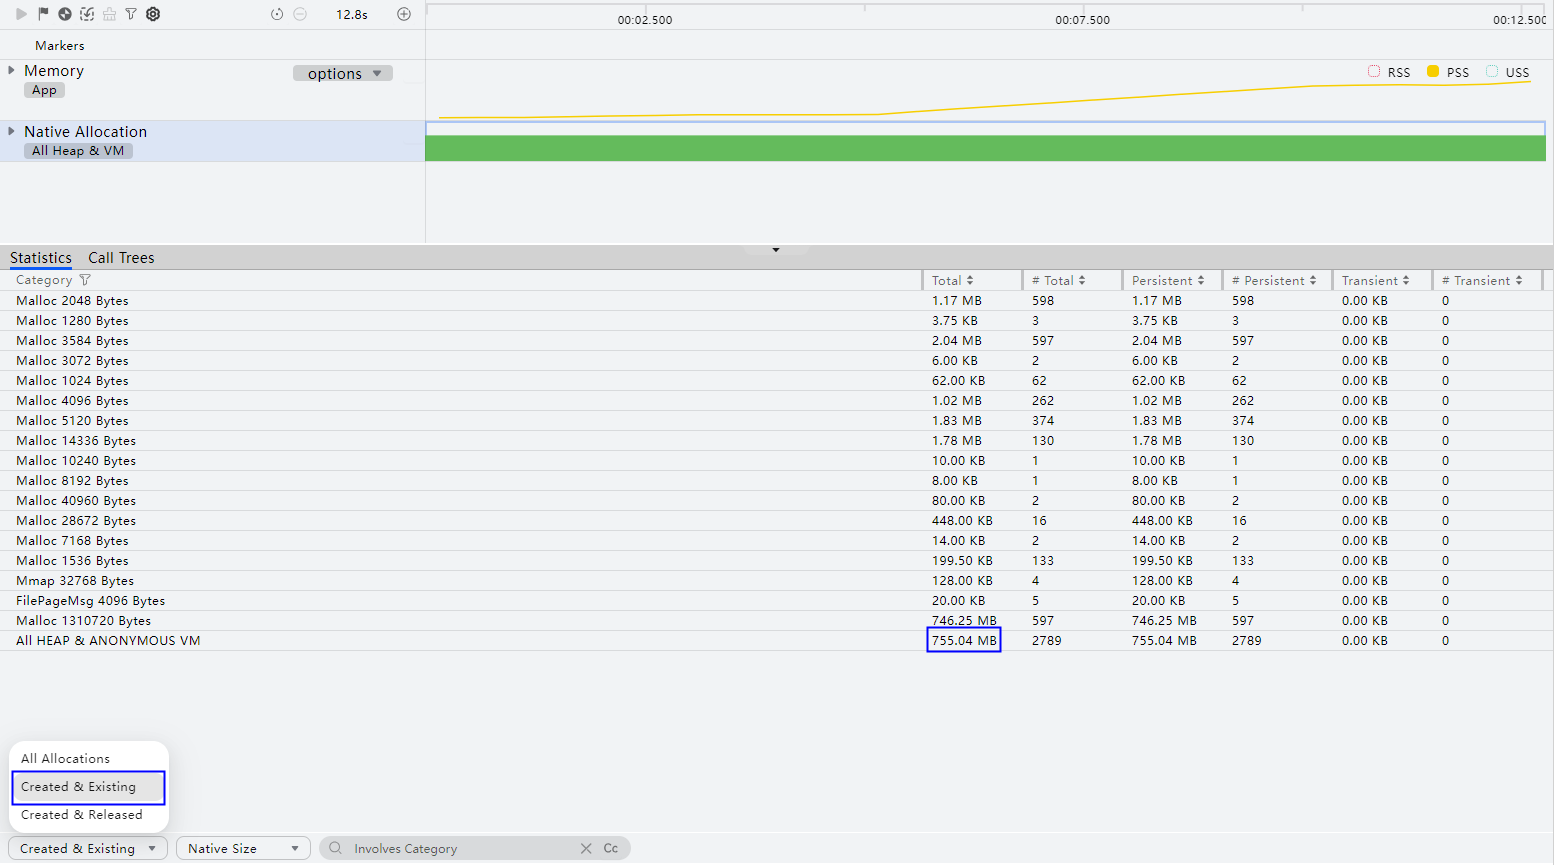
- Select the Native Allocation lane or sub-lane. The All Heap and All Anonymous VM sub-lanes indicate the memory allocated by the malloc and mmap functions, respectively.
- On the Statistics tab page in the details area, select Created & Existing.
- All Allocations: indicates all memory allocation information within the selected time range.
- Created & Existing: indicates the memory that is allocated after the start of the selected range and not released before the end of the selected range.
- Created & Released: indicates the memory that is allocated after the start of the selected range and released before the end of the selected range.
- Switch to the Call Trees tab and select Created & Existing to view detailed memory allocation stack information.
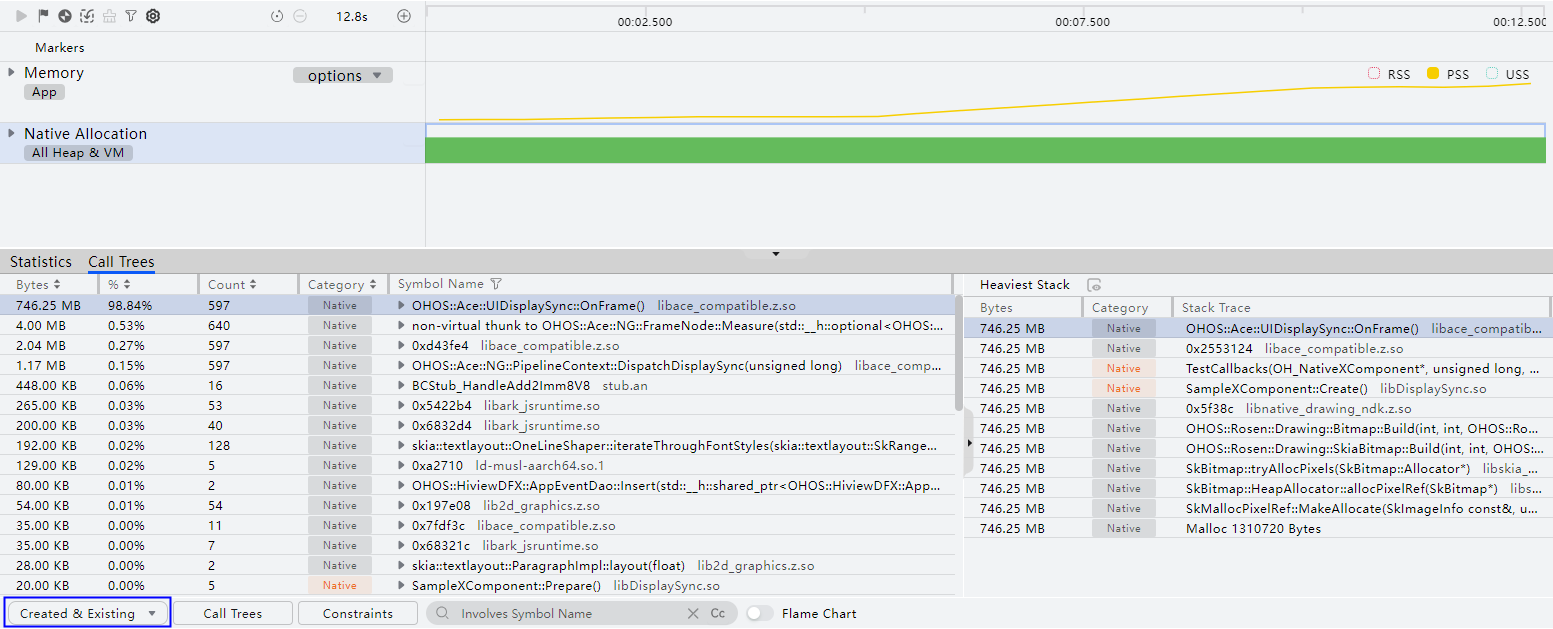
- Prioritize searching the memory allocation stack information for symbol names that are strongly related to the service code. These symbol names will appear in a bright color in the Category column. As shown in the figure above, the main leak sources lie on the service code. Conduct analysis based on the service code.

- In the Category column, the bright color indicates the developer call stack, and the gray color indicates the system call stack.
- Most of the stack frames are native stacks. Except for the .so files compiled by the app and .so files containing the API information, the other system libraries display only the .so library and function offset information. To view this information, import the .so library with symbols of the corresponding version. For details, see Offline Symbol Parsing.