For release apps, to reduce the app size and improve runtime efficiency, the code is optimized and debugging information is removed. As a result, the specific source files and line numbers cannot be directly located based on the stack information of the release app, making it difficult to quickly pinpoint and resolve issues.
To address this challenge, DevEco Studio provides a stack trace analysis feature for release apps. By leveraging build files with debugging information (such as .so, sourceMap, and nameCache files), you can restore C++ stack traces and ArkTS stack traces of release apps, as well as obfuscated method names and file names in ArkTS stack traces. For details about the build products and stack parsing principles, see Exception Stack Trace Analysis.
To analyze the stack trace, perform the following steps:
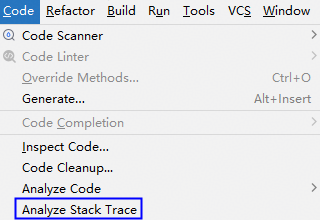
- Choose Code > Analyze Stack Trace on the menu bar, or right-click the stack information on the FaultLog page and choose Analyze Stack Trace from the shortcut menu.
- In the dialog box that is displayed, paste the stack information of the release app.
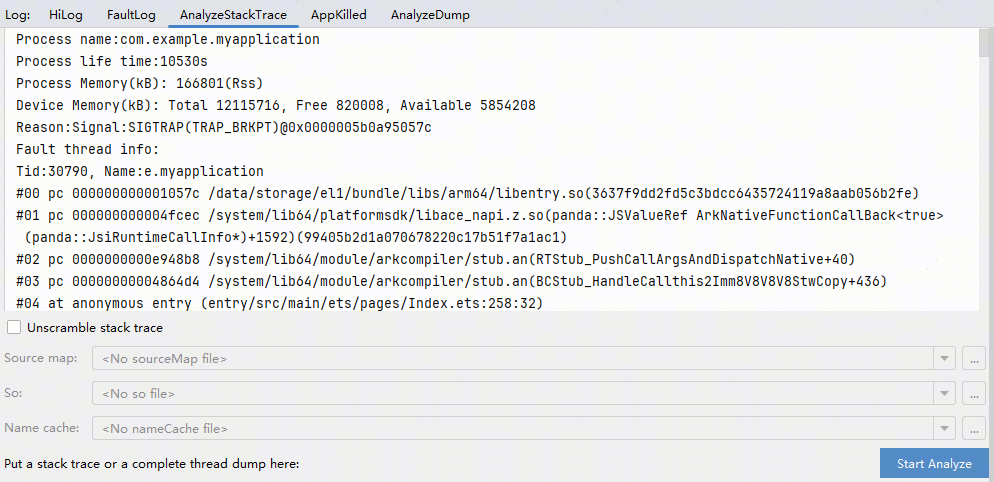
- If the current project is the project of the app where the stack is located and there is a release build, click Start Analyze to parse the project.
If the current project is not the one corresponding to the app where the stack trace resides, select Unscramble stack trace, add the sourceMap, .so, and nameCache files of the app, and click Start Analyze.
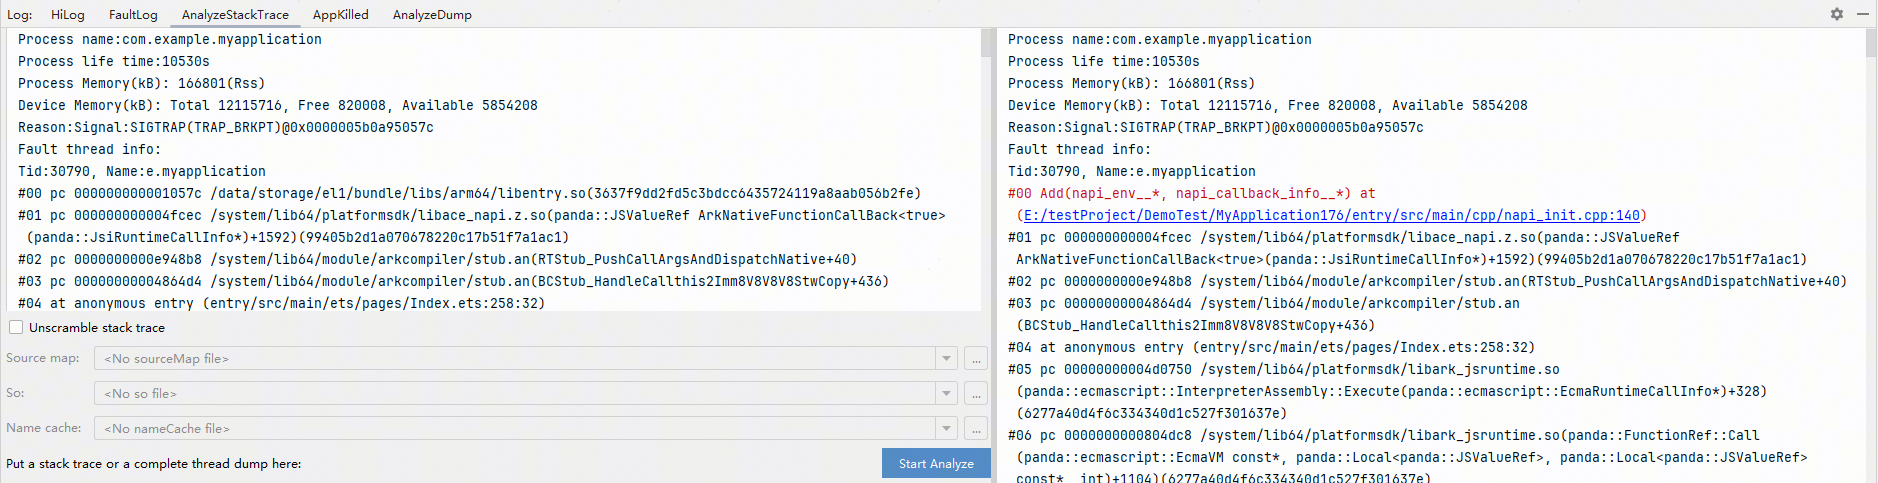
The parsed stack information is displayed in the right pane.
When a release app is built, the .so file does not contain symbol table information by default. To generate a .so file that contains symbol table information, set buildOption in the module's build-profile.json5 file as follows:
"buildOption": {
  "externalNativeOptions": {
    "arguments": "-DCMAKE_BUILD_TYPE=RelWithDebInfo"
  }
}
When analyzing an exception stack trace from native methods in a referenced release HAR module, check Unscramble stack trace and select the .so file with symbol information in the HAR module. The .so file of the HAR in the referencing project's build product does not contain symbol information. The relative path of the .so file in the module is build/default/intermediates/libs/default/{CPU type}/libxxx.so.