DevEco Profiler provides the Network template to help you inspect the HTTP stack-related network and network traffic information at app runtime, facilitating troubleshooting and optimization for network issues. The request duration is divided into the following five phases: DNS resolution, TCP connection, TLS connection, request waiting, and response receiving. The duration in each phase is displayed, allowing for targeted optimization of latency issues. In addition, the Details pane displays the information carried in each request, including data from the request side and response side, as well as their respective header, body, and cookie information, facilitating network issue location.
The Network template supports the following lanes: Network Traffic, Network Request, User Trace, ArkTS Callstack, and Callstack. This section describes the Network Traffic and Network Request lanes. For details about other lanes, see the corresponding template.
- For details about the User Trace, ArkTS Callstack, and Callstack lanes, see Basic Time Analysis: Time.

- Before analysis, create a Network analysis task and capture related data. For details, see In-depth Capture for Problem Locating. Alternatively, click Open File in the session area and import historical data.
- The network analysis task only supports the recording and optimization for request-type interfaces in Network Kit.
- Due to privacy and security policies, network analysis is not available for apps that have been released on AppGallery.
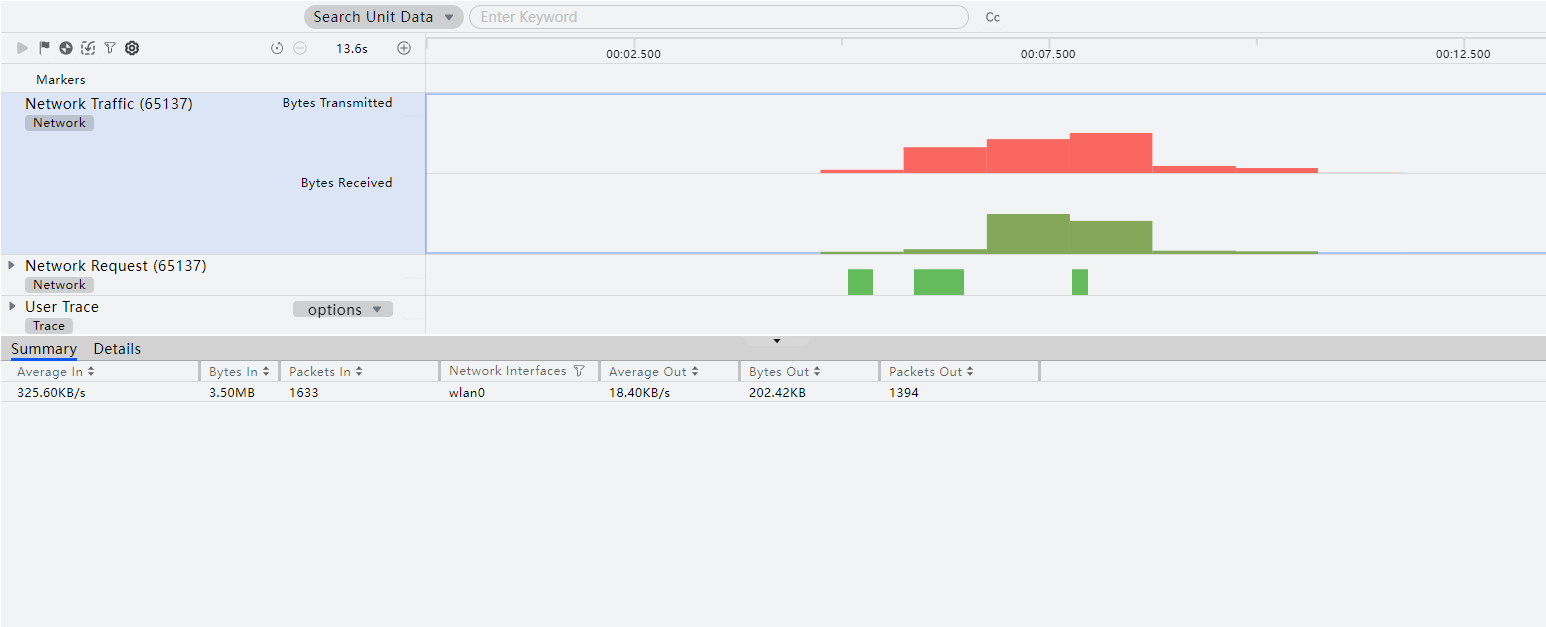
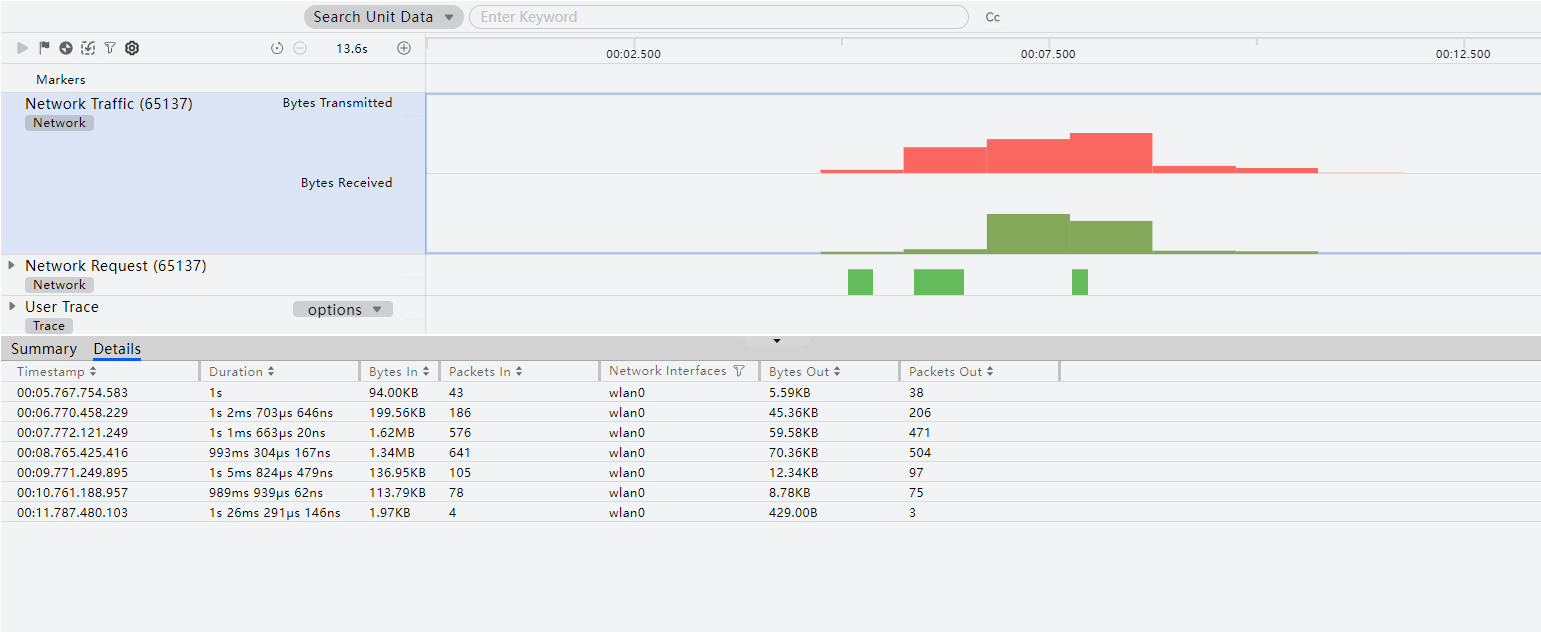
Click the Network Traffic lane to display the network traffic consumption during the capture. In the data area below the lane, click the Summary and Details tabs to inspect the respective statistics.
- On the Summary tab, check the aggregated traffic statistics for each network interface, including the average downlink traffic, total downlink traffic, number of downlink data packets, network interface, average uplink traffic, total uplink traffic, and number of uplink data packets.
- Switch to the Details tab to view periodically reported network data records sorted by timestamp. Each record includes the reporting timestamp, duration, downlink traffic, number of downlink traffic packets, network interface, uplink traffic, and number of uplink traffic packets.
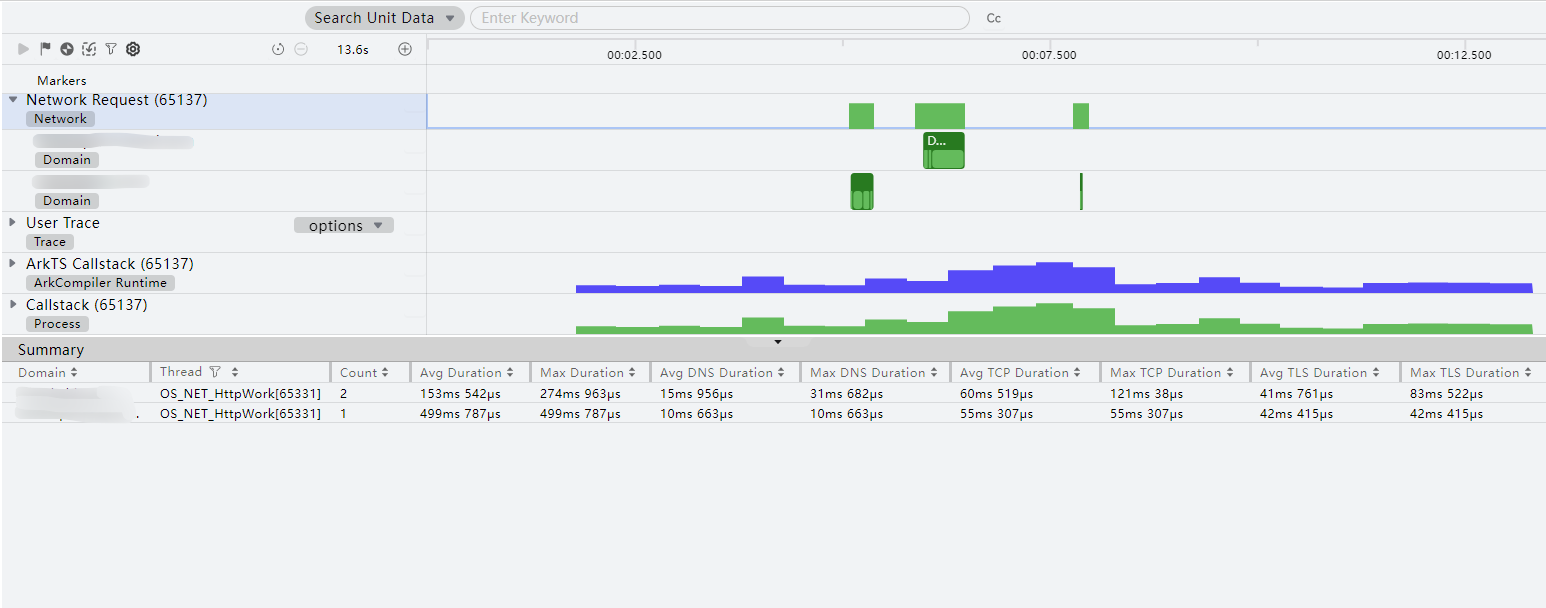
Click the Network Request lane. Inspect changes in network request count that occur during the capture in the data area below the lane.
- The Summary panel displays network request duration statistics by domain. The information includes the domain name, thread name, count, average duration, maximum duration, average duration for DNS resolution/TCP connection/TLS connection/waiting for response/receiving data, and maximum duration for DNS resolution/TCP connection/TLS connection/waiting for response/receiving data.
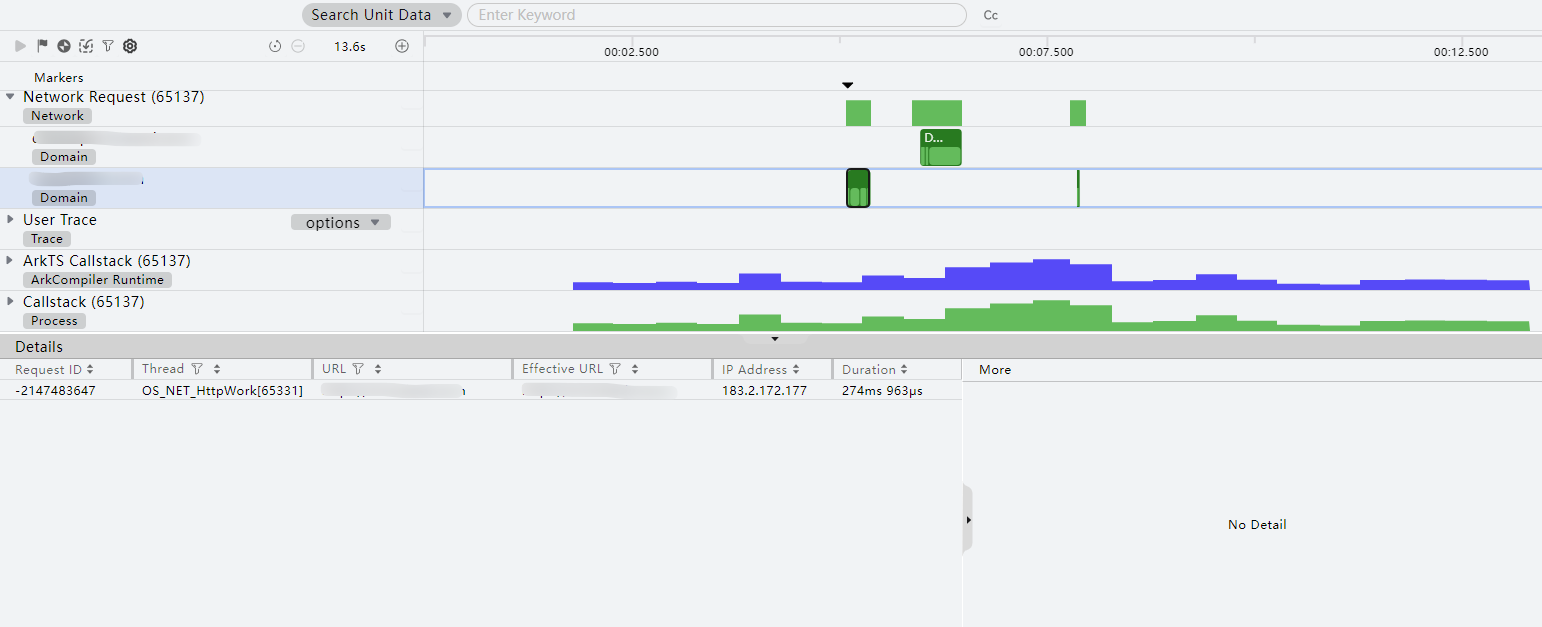
- Select a domain. The Details panel displays the durations of all network requests for that domain, including the request ID, thread name, request URL, redirect URL, IP address, total duration, DNS resolution duration, TCP connection duration, TLS connection duration, request waiting duration, response receiving duration, request type, status code, and version used.
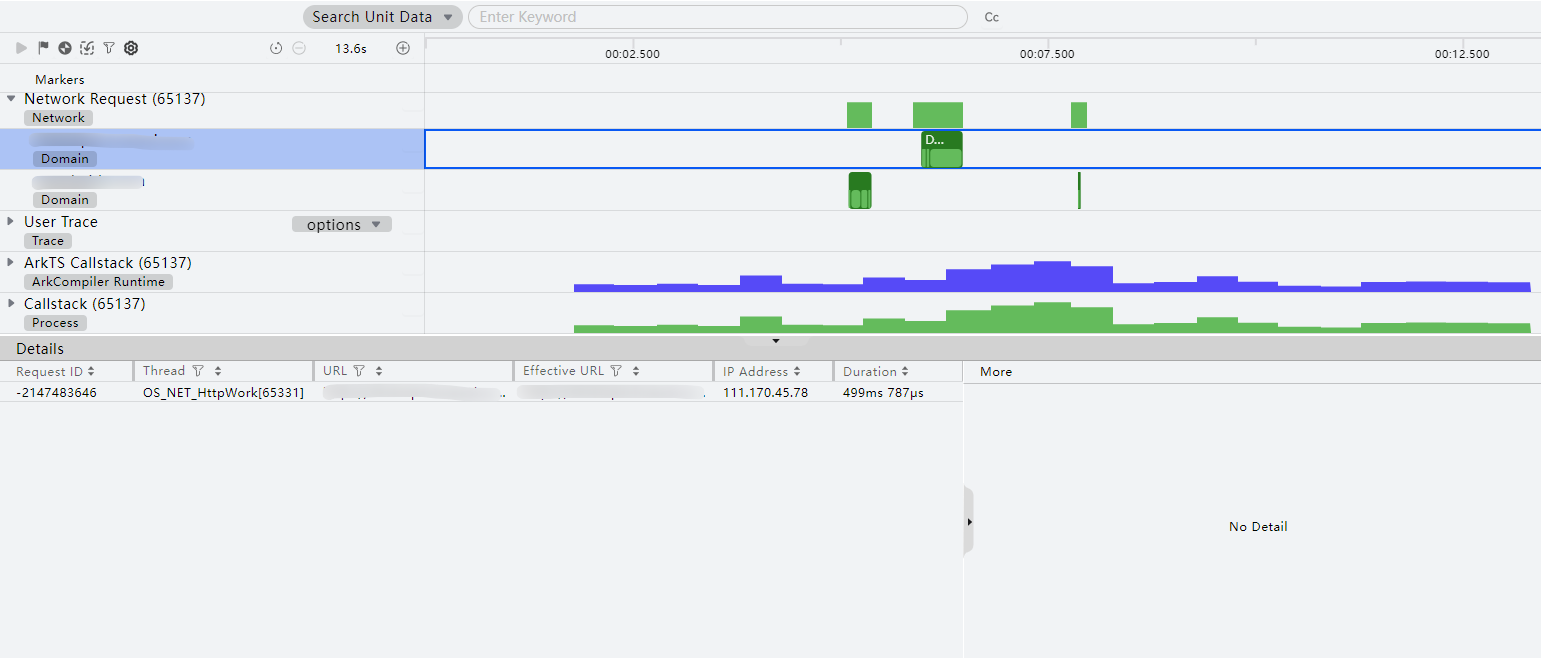
Select an entry in Details. The lane area highlights its duration block with a dashed box. The More area on the right displays Request Headers, Response Headers, and Response Body of the request.
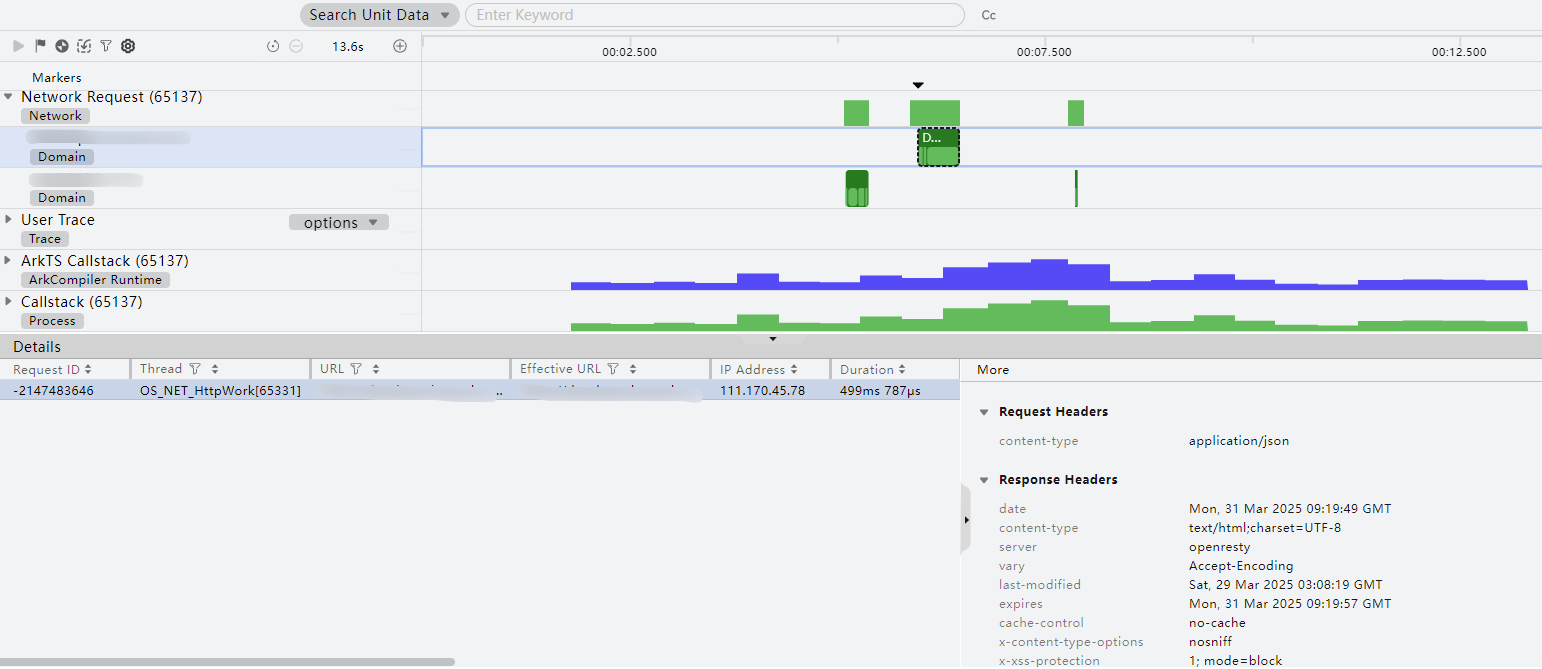
Locate network requests that may cause network stuttering, and select its duration block to view the duration of each phase of the request.
Analyzing Network-related Issues During Startup
You can use network analysis tasks in DevEco Profiler to identify and resolve network-related issues that occur during app startup.
- If you select an app that is not started yet, DevEco Profiler automatically starts the app to capture data when the task starts. After the capture is complete, the task enters the parsing phase.
- If the app is running, DevEco Profiler stops it first when the analysis task starts, and then starts it again to capture data. Once data capture is complete, the task enters the parsing phase.
To start an analysis task, click  next to the desired task in the task list.
After the analysis is complete, the data types displayed and processing methods used are consistent, regardless of the app's initial state (running or not).