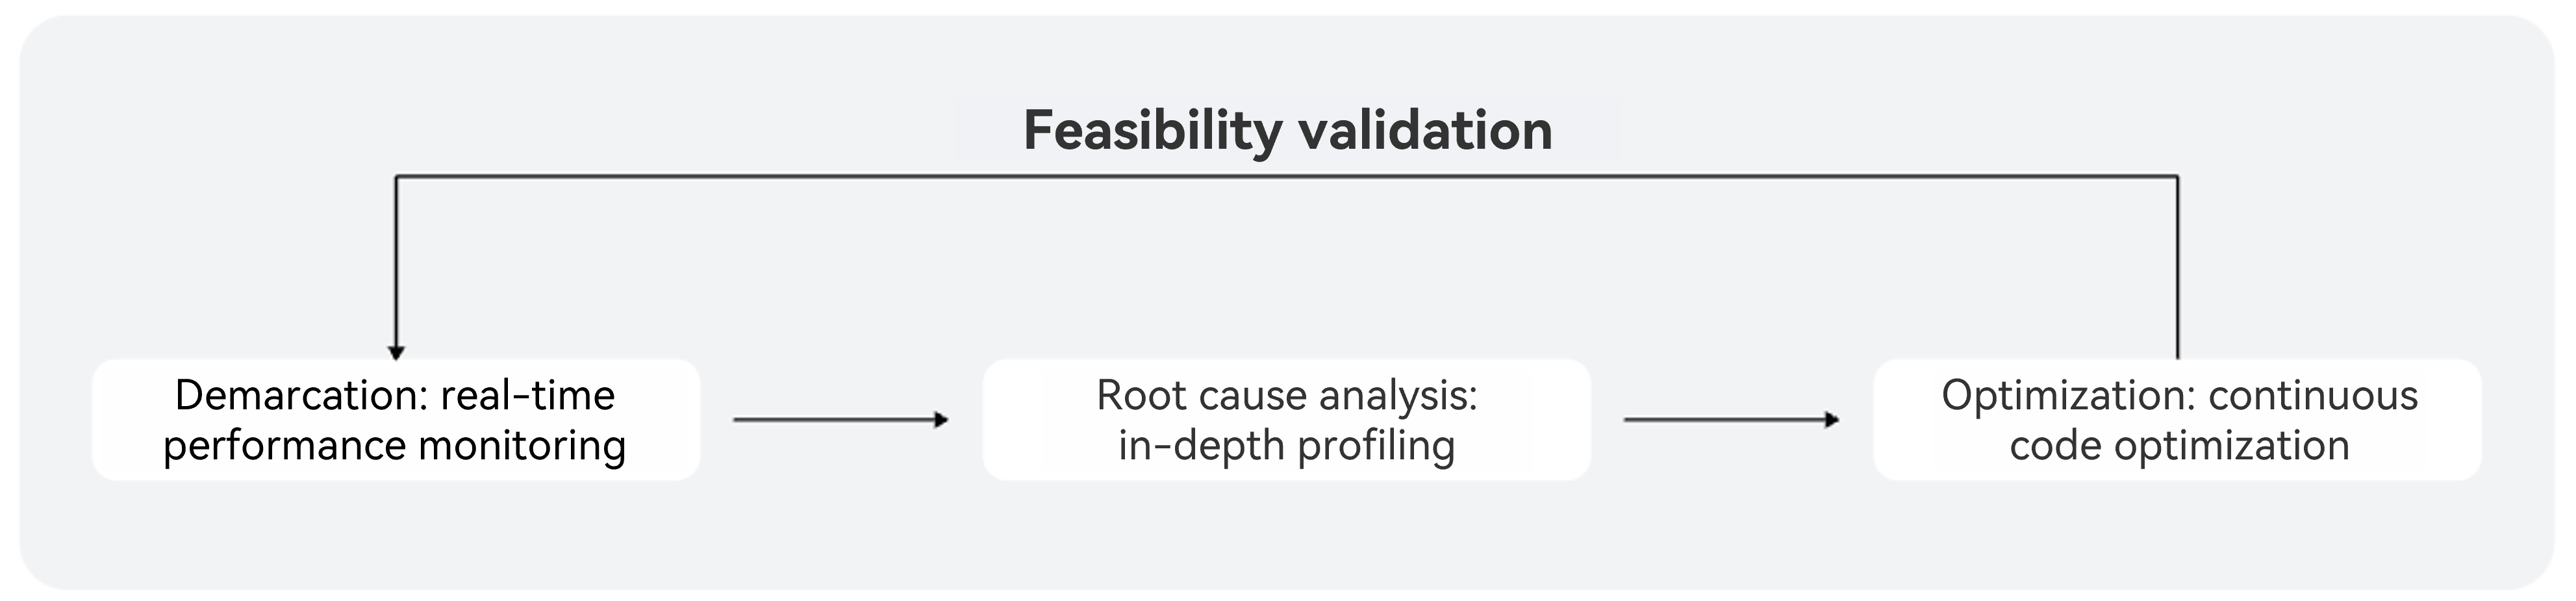
Your app may have performance issues if its running status cannot meet expectations. App performance optimization is a continuous process. During app development, you need to observe the app's runtime behavior to identify performance bottlenecks, locate performance issues with runtime data, fix the code after finding the root cause, and verify the effectiveness of optimization measures. Repeat the cycle until the app meets your performance metrics.
This procedure also applies to DevEco Profiler. When using DevEco Profiler, follow the procedure below:
- Use Realtime Monitor to track resource usage and identify potential performance bottlenecks and hotspots, such as high CPU usage or unexpected memory usage increase.
- Use deep recording to analyze detailed runtime data including function calls and memory objects, so as to pinpoint root causes of performance issues.
- Optimize the code based on the analysis result.
- Use Realtime Monitor again to check whether the usage of each resource meets the expectation, thereby verifying the effectiveness of the code modifications.