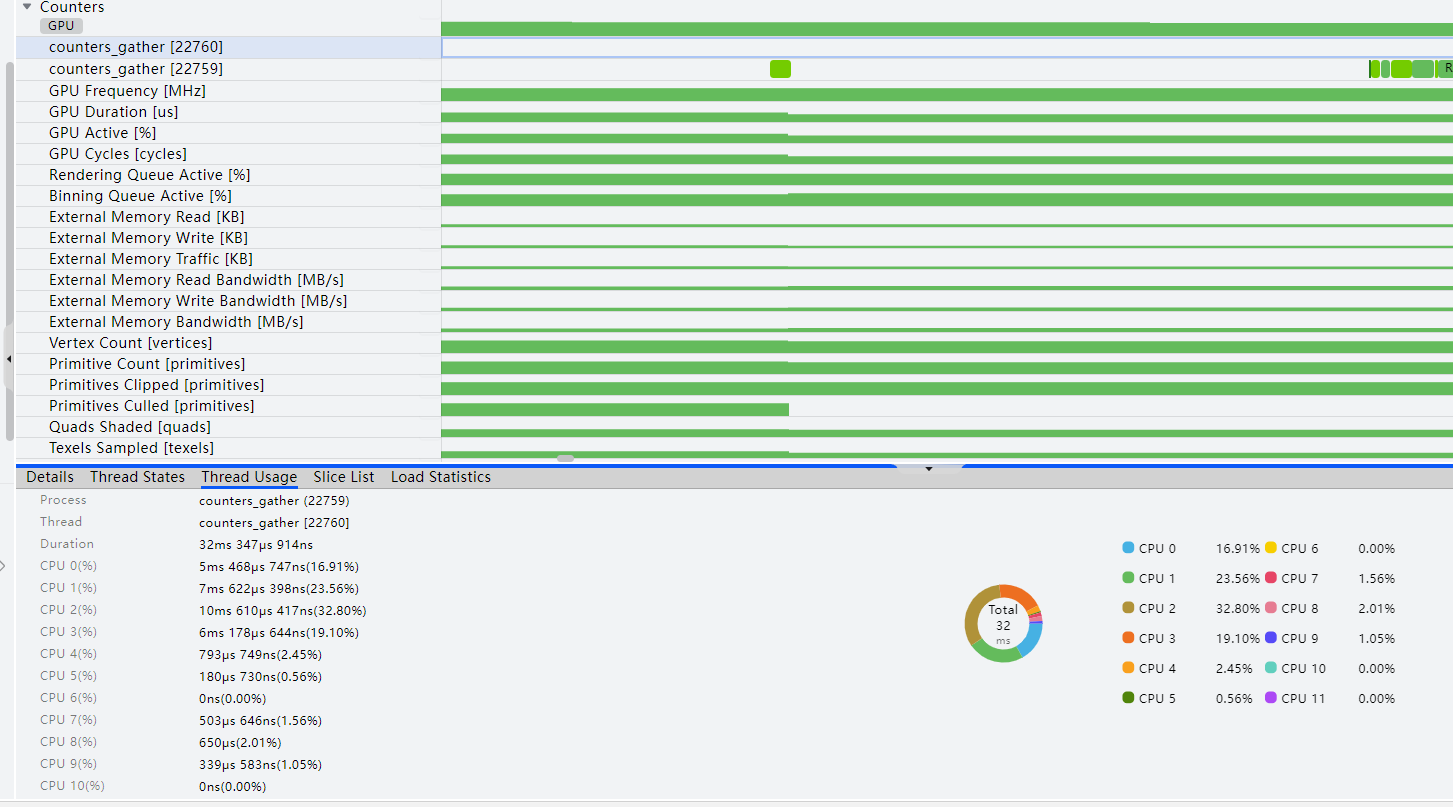
Since DevEco Studio 6.0.0 Beta3, DevEco Profiler provides a GPU template to display detailed information about the usage of GPU hardware modules. This information helps identify the root causes of low GPU utilization and performance bottlenecks in executing graphical and computational workloads.
The GPU template supports the following lanes: Counters, ArkTS Callstack, Callstack, CPU Core, and Process. This section describes the Counters lane. For details about other lanes, see the corresponding template.
- For details about the ArkTS Callstack and Callstack lanes, see Basic Time Analysis: Time.
- For details about the CPU Core and Process lanes, see CPU Activity Analysis.
Procedure
- Create a GPU analysis task and capture related data. For details, see In-depth Capture for Problem Locating.
For the GPU analysis task, click
 to select the lane to capture before starting the capture. Click
 on the toolbar to set the sampling interval, ranging from 1 ms to 1000 ms. The default interval is 10 ms.
- The Counters lane displays the GPU usage of the current device.
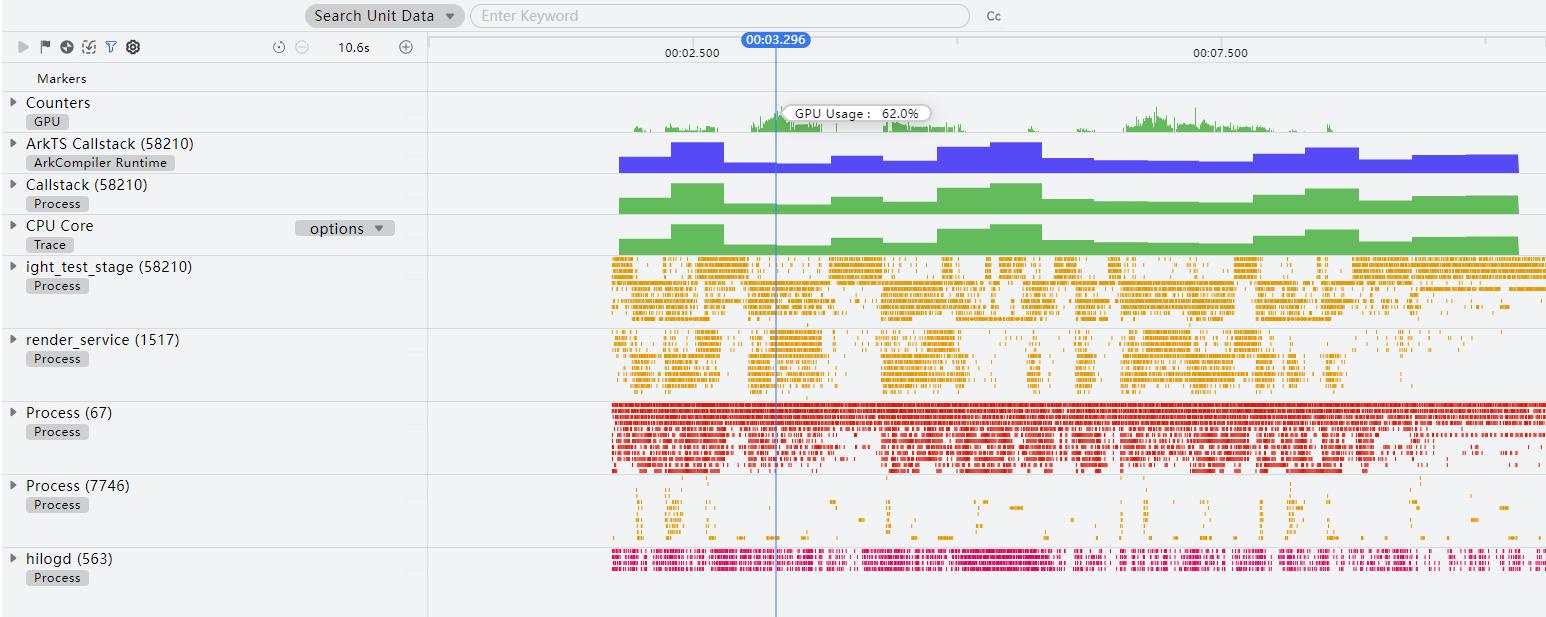
- Expand the Counters lane. The sub-lanes display GPU activity information, including counters_gather, the frequency of executing commands on the GPU, and the duration of command execution. For details about the sub-lanes except counters_gather, see GPU Counters.
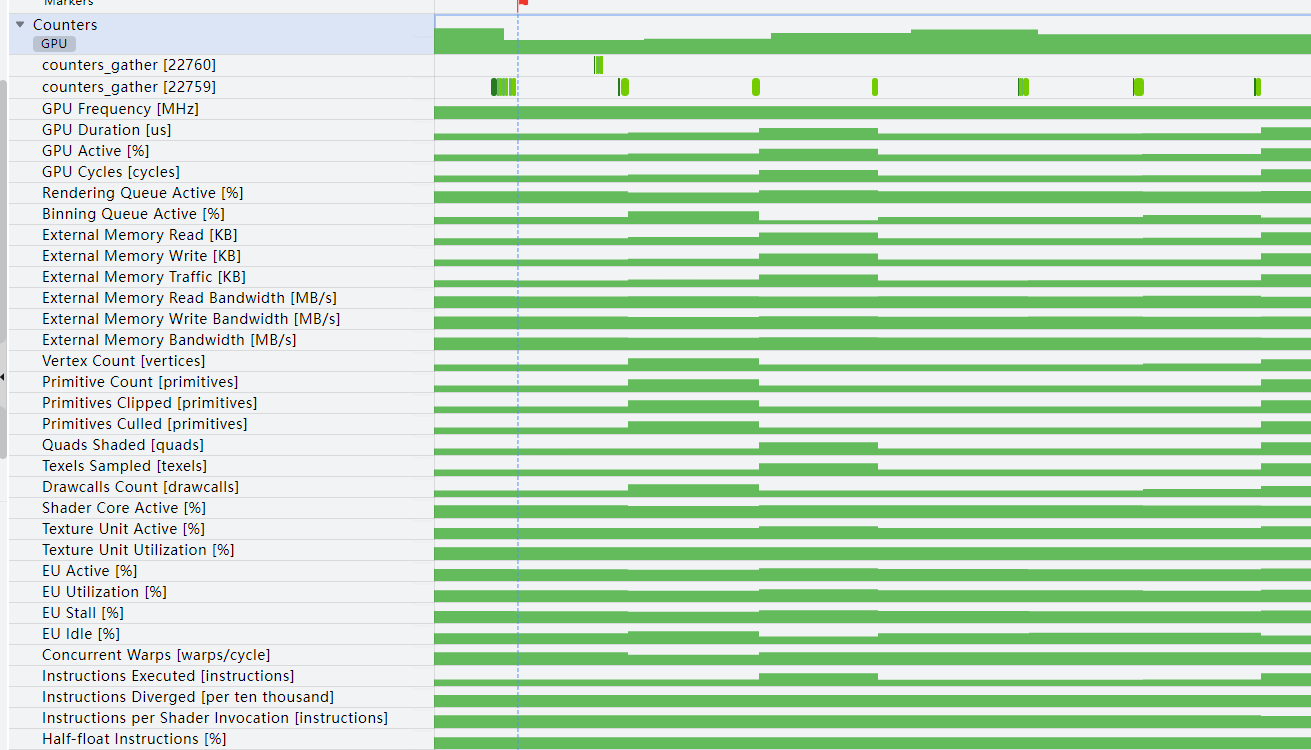
- The counters_gather sub-lane displays the usage of each CPU core by the thread. Click a time slice in the running status. The running details of the thread in the time slice are displayed, including the start time, duration, running status, frequency, thread priority, process to which the thread belongs, thread to which the thread belongs, thread's previous runtime status, and thread's next runtime status. You can navigate to the thread's previous or next runtime status.
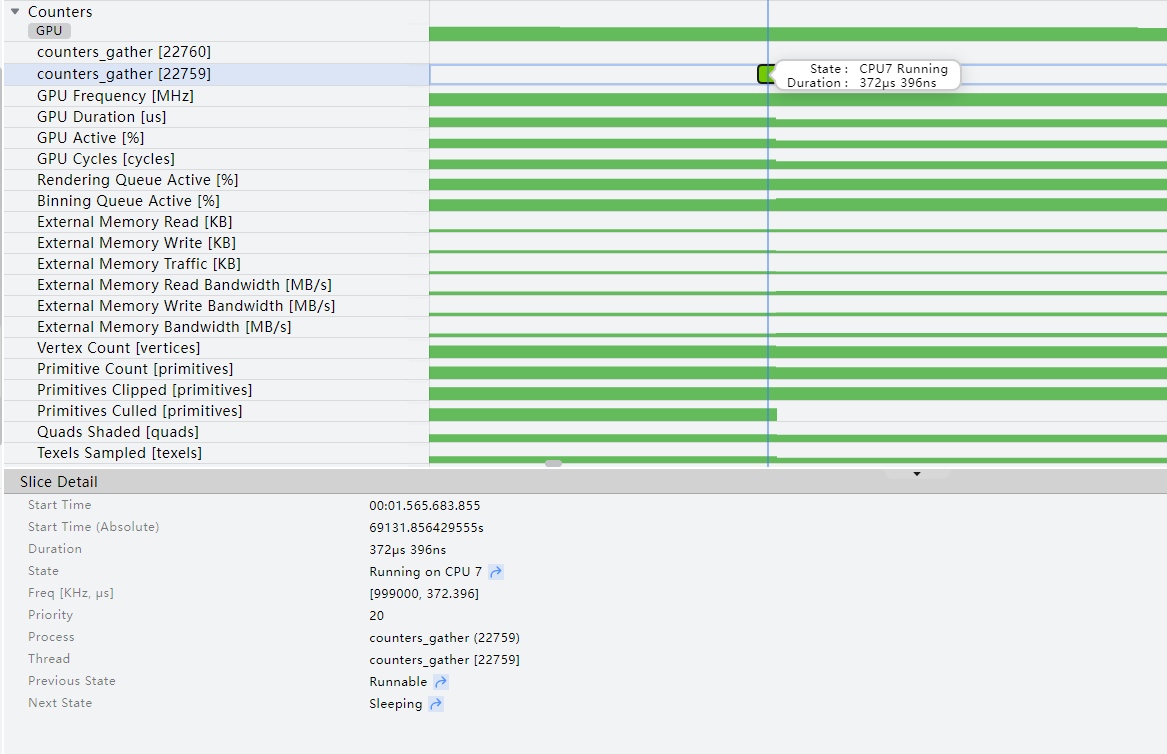
- Drag to select the counters_gather sub-lane to view the statistics for the selected time range, including thread status statistics, CPU single-thread usage, and thread load data.