Function Description
DevEco Profiler provides memory snapshot analysis for ARK virtual machines (VMs). Based on the real-time memory usage, DevEco Profiler analyzes the memory usage and differences of ARK VMs at different time points.
The Snapshot analysis template supports the Memory and ArkTS Snapshot lanes. This section describes the ArkTS Snapshot lane. For details about the Memory lane, see en-us_topic_0000002731541423.html#EN-US_TOPIC_0000002731541423__li6600547121414.
Constraints
Due to privacy and security policies, memory snapshot analysis is not available for apps that have been released on AppGallery.

Before analysis, create a Snapshot analysis task and capture related data. For details, see In-depth Capture for Problem Locating. Alternatively, click Open File in the session area and import historical data.
Viewing Snapshot Details
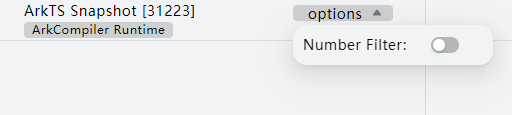
- Click the options drop-down menu for the ArkTS Snapshot lane to set whether to capture data of the number type. By default, such data is not captured.
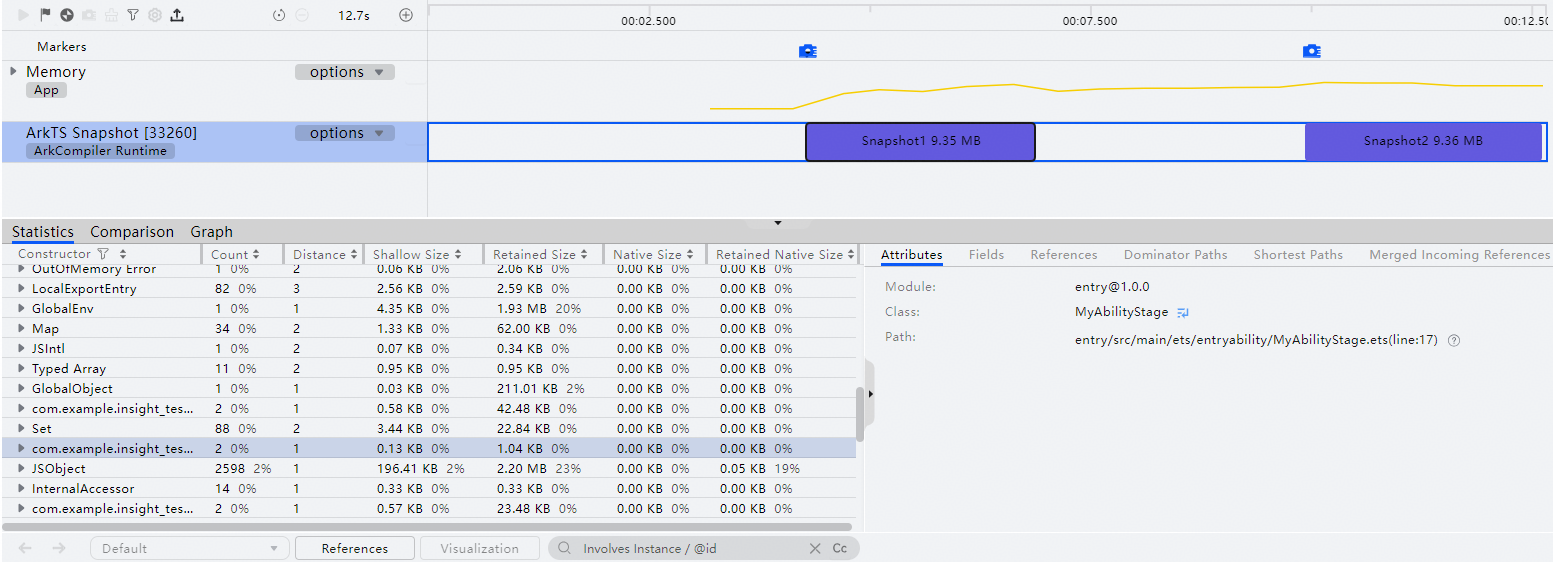
- After the capture starts, observe memory usage in the Memory lane. Click
 in the upper-left corner of the task to start a snapshot. Once the snapshot is complete, a purple block appears in the ArkTS Snapshot lane.
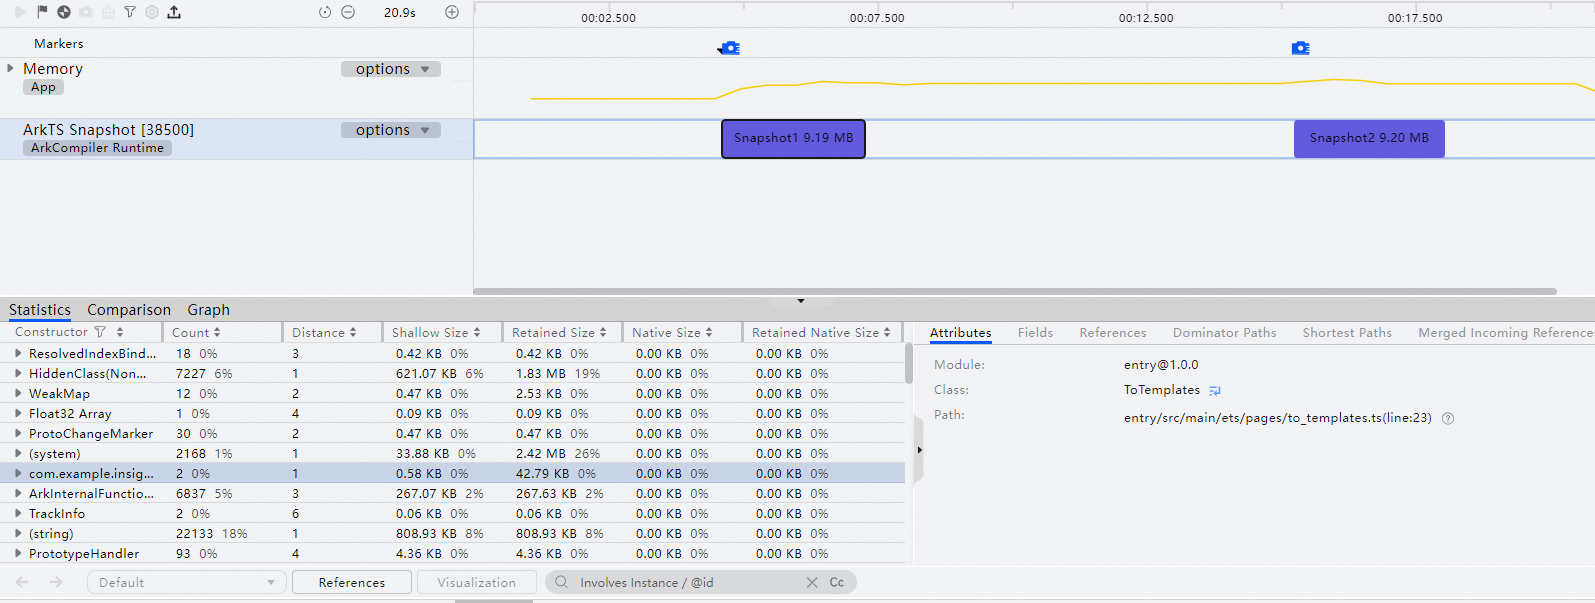
Click the purple block in the ArkTS Snapshot lane. The Statistics tab displays details for the current snapshot.
- Constructor: constructor.
- Count: number of objects.
- Distance: distance from the Garbage Collection (GC) root to this object.
- Shallow Size: actual size of the object itself.
- Retained Size: total amount of memory that can be freed when the current object is released.
- Native Size: size of the native memory that is referenced by this object.
- Retained Native Size: total amount of native memory that can be freed when the current object is released.
- Objects marked with
 are global objects, which can be accessed through the global window object.

- During capture, you can click
 in the upper-left corner of the analysis task window to start memory reclamation.
- When a segment of memory occupied by a program or process of the ArkVM tuning target is no longer accessed by the target in subsequent operations, the garbage collection mechanism automatically releases this memory back to the system, lowering the probability of program exceptions and eliminating redundant memory overhead.
Comparing Snapshots
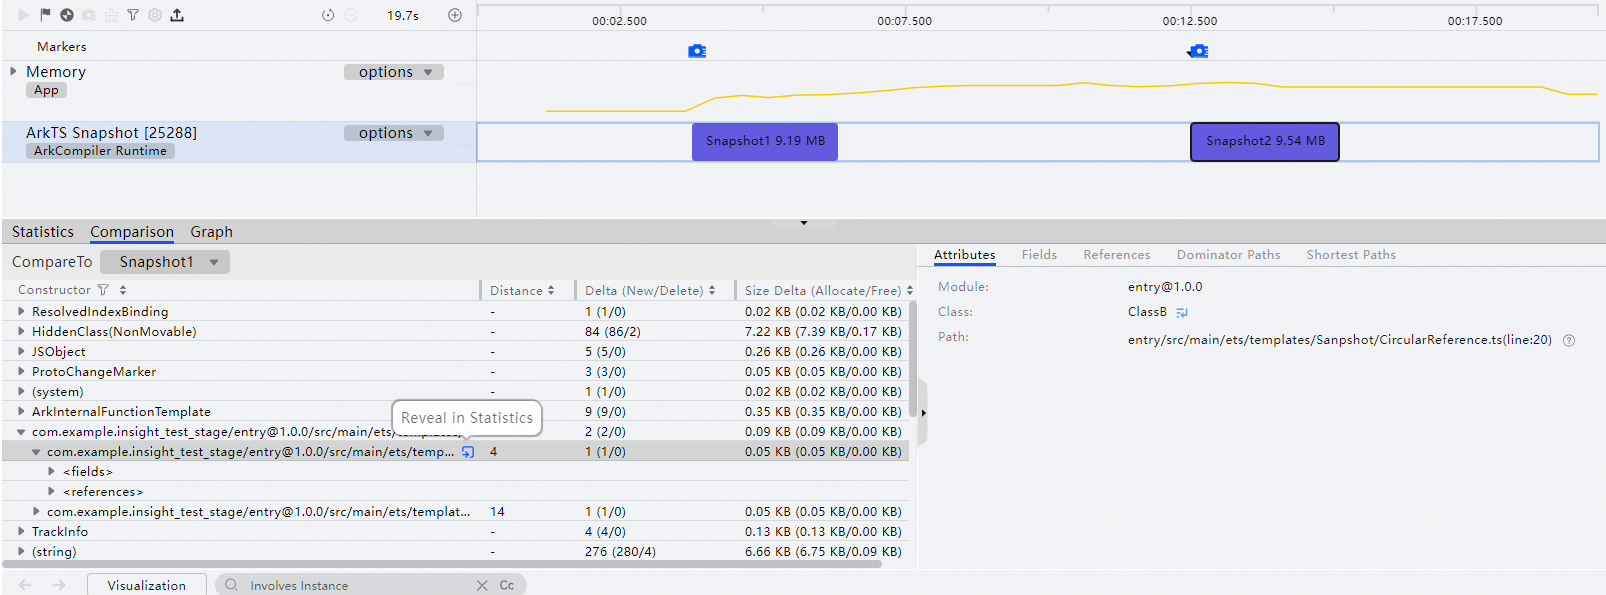
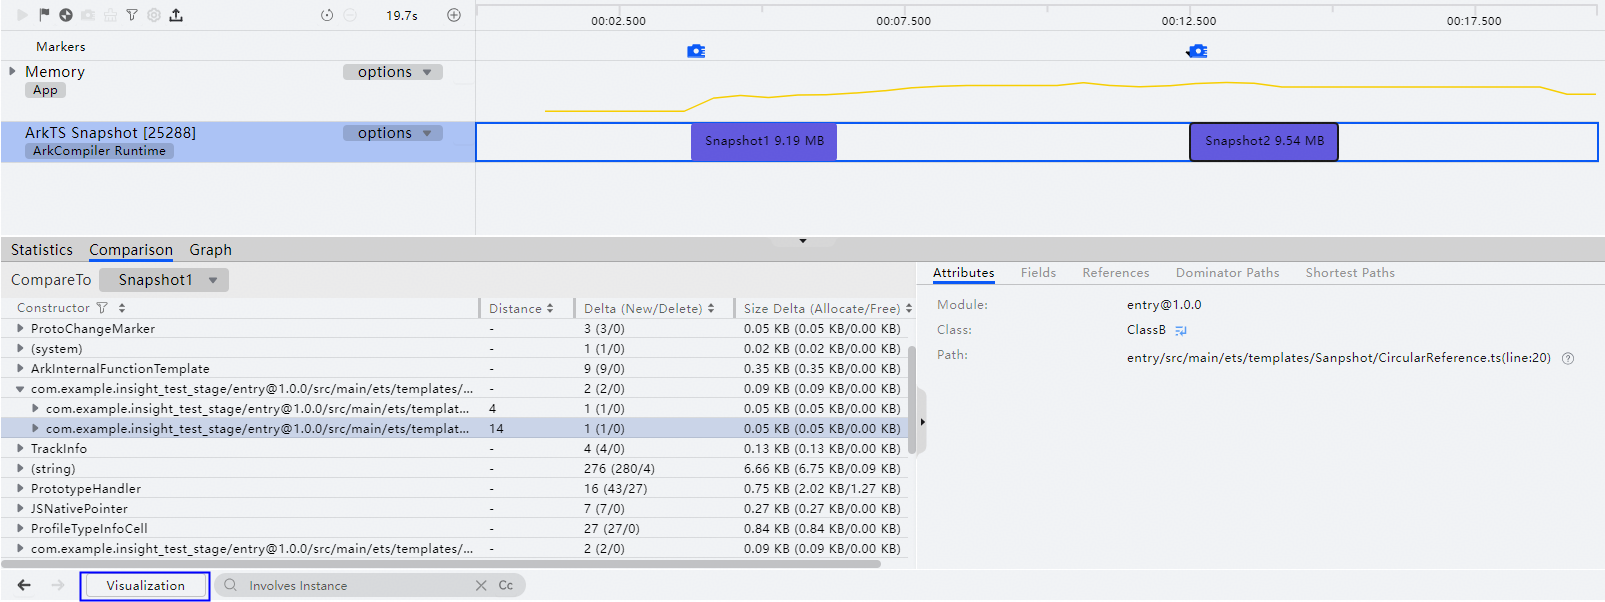
In the Comparison tab of the ArkTS Snapshot lane, click any snapshot as the base snapshot and select another snapshot from the CompareTo drop-down list as the target. The comparison result of the two snapshots is displayed. The comparison covers the number of added and deleted items, number of incremental items, allocated size, released size, size increment, and more. Through iterative comparison, you can quickly pinpoint specific memory issues.

Parsing App Object Name
The Ark runtime currently includes three categories of objects: Ark app objects, internal framework objects, and other JS objects. Since DevEco Studio 6.0.0 Beta1, the ArkTS Snapshot lane supports parsing of app object class names, helping you quickly locate the corresponding source code and improving troubleshooting efficiency.
- System internal framework objects: core objects used to describe the HarmonyOS underlying framework, providing basic system capabilities. To facilitate viewing, such objects are currently classified under the constructor node (framework) in Statistics. All such objects start with _GLOBAL.
- Ark app objects: objects used to represent specific components, modules, or resources in HarmonyOS applications. These objects must be named in the following format:
com.example.app/MainModule@1.0.0/src/main/ets/MainPage.ets#MainPage(line: 10)[MainModule] // The format is BundleName/SelfModule@Version/FilePath/File#Class(line: xx)[RefModule].
- Other JS objects: objects used to describe those related to the JavaScript engine in Ark Runtime, providing basic capabilities at the JavaScript language level. For example, JSArray and JSSharedObject.
In the Snapshot template, you can click the name of an Ark App Object on the Attributes tab to view its parsing result, helping you locate the problem. The parameters are described as follows:
- Module: module information
- Class: attribute name
- Path: path of the compiled source code You can click
 next to the attribute name to navigate to the corresponding code in the project, facilitating debugging.

If the app is built in release mode with source code obfuscation enabled, the obfuscated data of Ark app objects will be displayed. You can view the source code information of the selected app object on the Attributes tab.


- Ensure that the project code path matches the parsing information. Otherwise, the navigation may fail.
- System internal framework objects (framework) provide only basic information and do not support navigation.
- line=0 after an object name indicates an invalid line number and cannot be used for navigation.
Checking Node Attributes and Reference Chains
In the Statistics and Comparison tabs of the ArkTS Snapshot lane, expand all instance object nodes to view Fields and References, which represent the attributes and reference chain information of the instance object, respectively. Alternatively, click an instance object and search for Fields and References in the More area on the right.

Redirecting to a Node
When viewing memory objects, object attributes, and reference chains on the Comparison tab of the ArkTS Snapshot lane, click the redirection icon at the end of the row containing the target object to navigate to the object on the Statistics tab for detailed information.
Switching Between Historical Nodes
In the ArkTS Snapshot lane, after you perform node redirection between Comparison and Statistics, click the left or right arrow in the lower-left corner of the Details panel to move forward or backward to the next or previous historical node. This feature is available only when the left or right arrow is not dimmed.
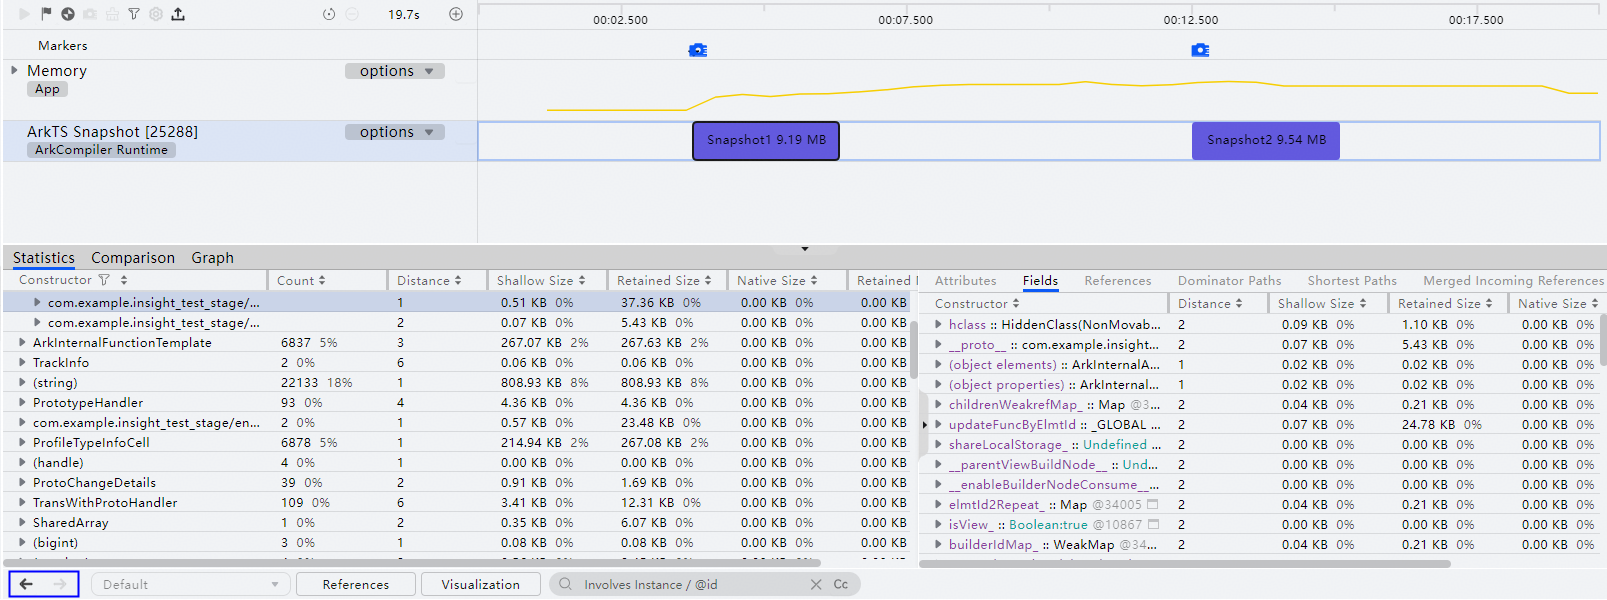
Obtaining the Dominator Tree of a Node
Since version 26.0.0, the ArkTS Snapshot lane supports one-click retrieval of the dominator tree. The system constructs a dominator tree of memory objects with GC Roots as the root nodes. After selecting an instance node, you can view its dominator tree in the Dominator Paths tab on the right pane.
In a dominator tree structure, a node is defined as the dominator of a target object if every path to the target object must pass through this node. By displaying the dominator chain from GC Roots to the target instance on the dominator tree, the system strips complex redundancies and cross-references, and directly locates the dominator responsible for the memory leak. Breaking the dominator on this path frees the associated memory, enabling more accurate and efficient resolution of memory leak issues.

Expanding a Reference Chain Towards Minimum Reference Distance
The ArkTS Snapshot lane supports one-click expansion of reference chains towards the minimum reference distance. The minimum reference distance refers to the shortest path from GC Roots to the selected instance object. Each step along this path decrements the Distance value by 1, ultimately reaching a node with Distance = 1. This provides clear visibility of which objects hold references to the target instance, enabling rapid root cause analysis.
[h2]DevEco Studio 6.1.0 Beta2 or Later
Select an instance node. The system calculates the shortest reference path from the GC Roots to the selected object and displays it in the Shortest Paths tab on the right pane.
In version 26.0.0 or later, clicking  on the left of the Shortest Paths tab exports the data on the tab to the local side.
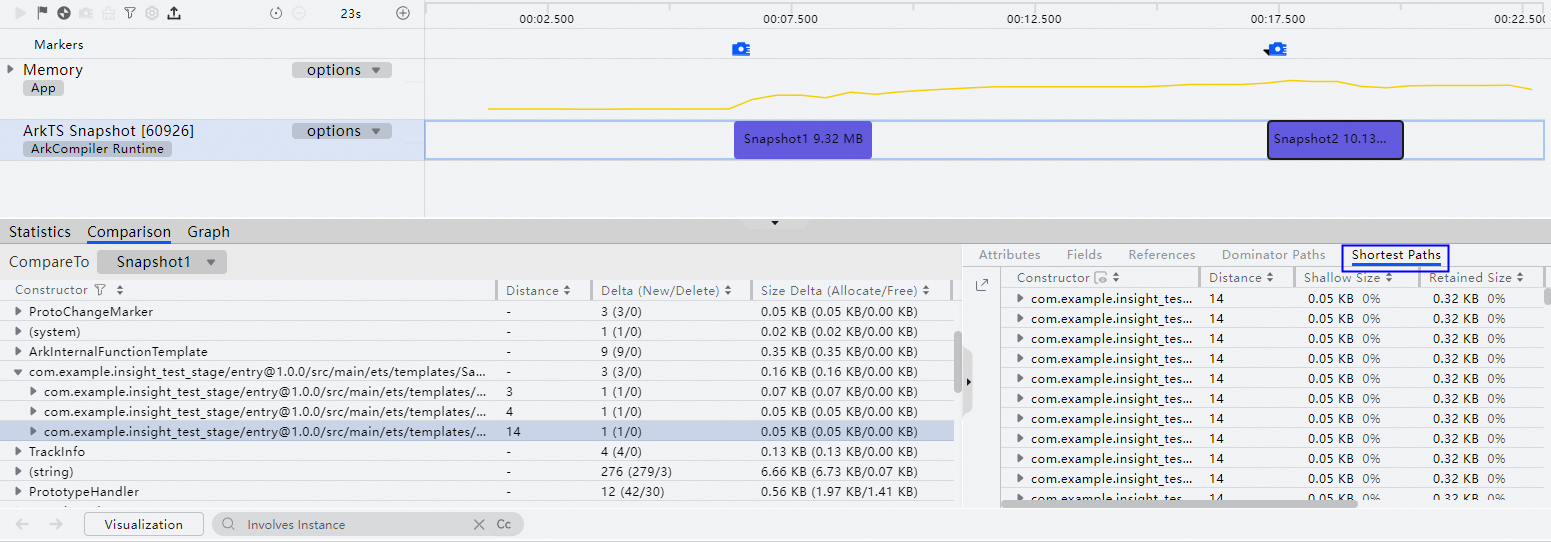
Since version 26.0.0, when an app is built in release mode and source code obfuscation is enabled, Constructor displays obfuscated source file paths. If the debug app has the corresponding nameCache file, click the Show SourceClassName button to display the original unobfuscated source paths. Otherwise, import the nameCache file corresponding to the debug app before clicking the button.
In addition, if the debug app has the corresponding SourceMap file, click the  icon next to the source path to jump directly to the code location within the project for quick debugging. If no SourceMap file exists, import the SourceMap file for the debug app first, and then click the icon.
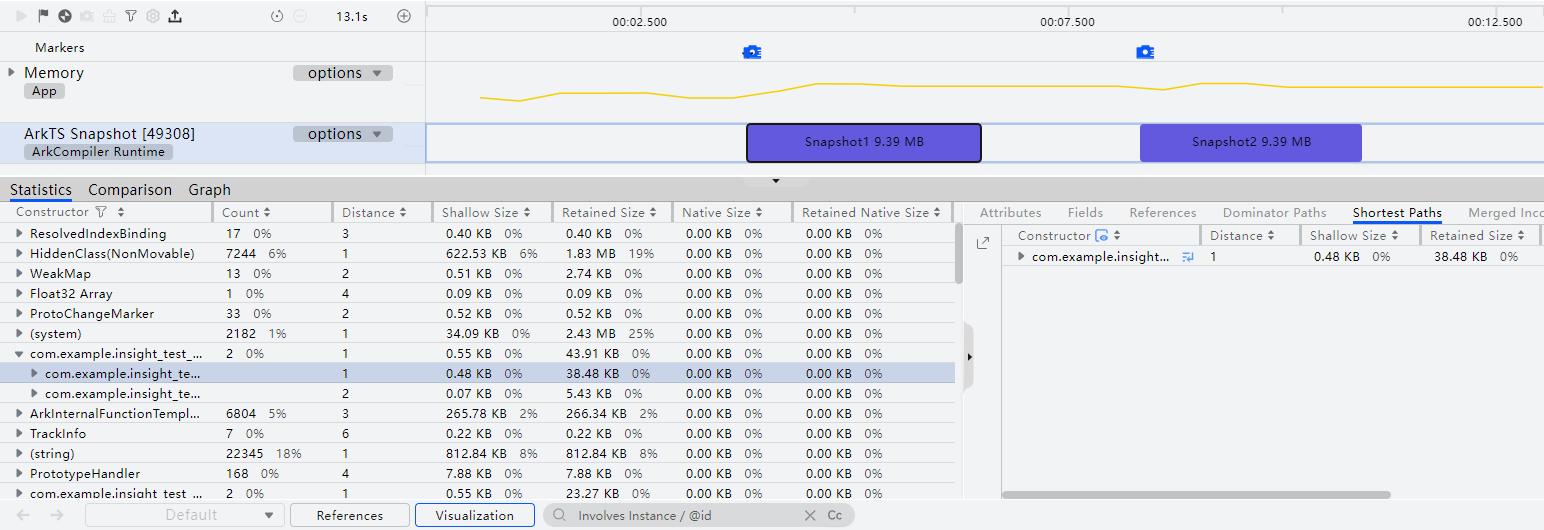
[h2]Versions Earlier Than DevEco Studio 6.1.0 Beta2
Select a problematic instance node. When the Path to GC Root button in the bottom search bar becomes available, click it to enable the system to calculate the shortest reference path from the GC Roots to the selected node and display it in the Shortest Paths tab on the right.
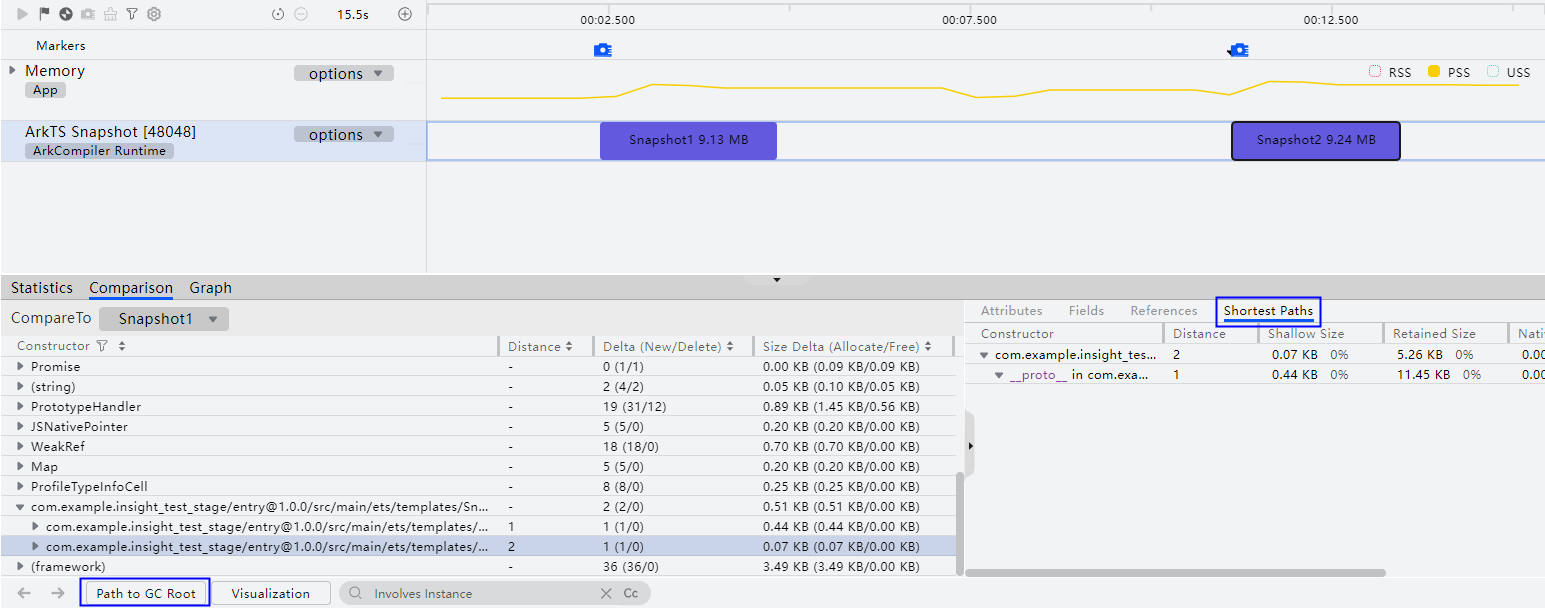
Currently, the single-root path search (default), search with a specified number of root paths, and all-root path search are supported.

Once you set the search mode and click OK, the More area on the right automatically switches to the Shortest Paths tab to display the search results.

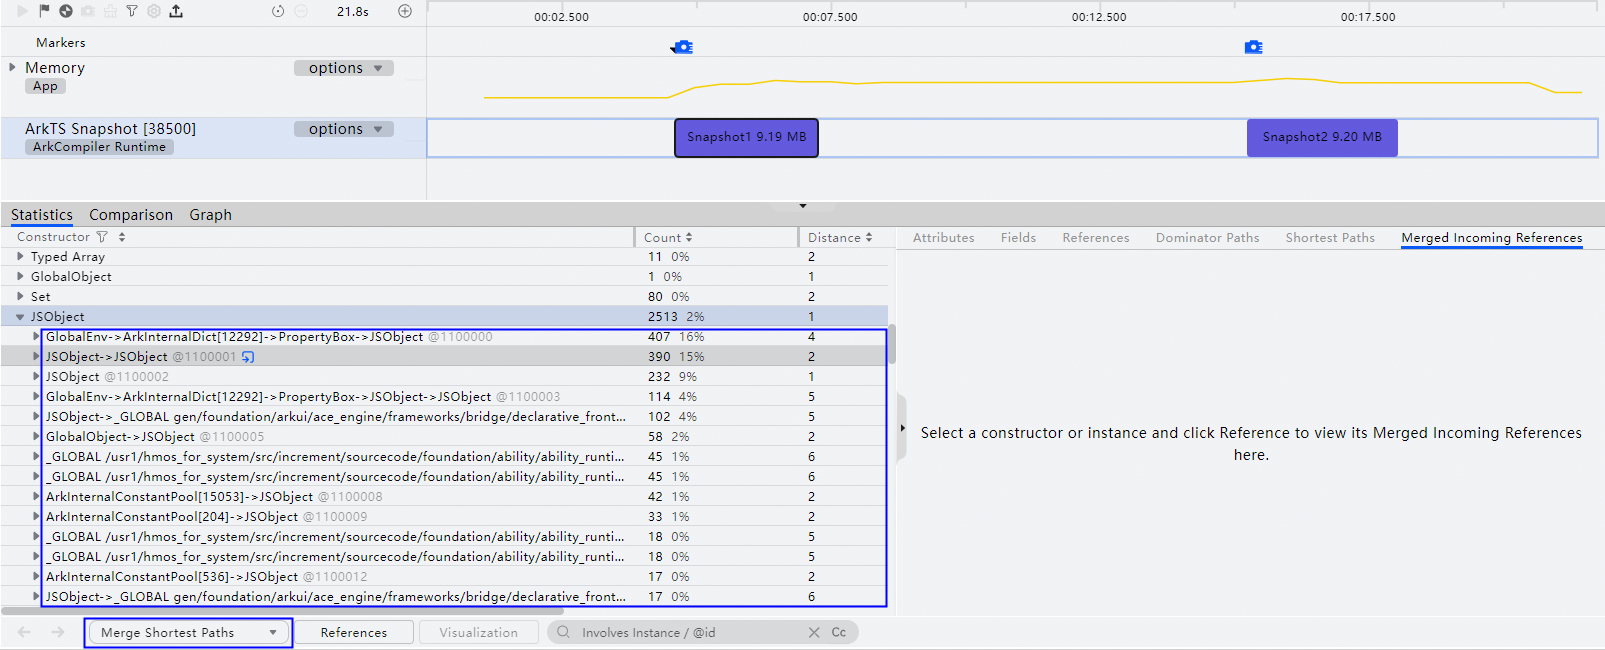
Since DevEco Studio 6.1.1 Beta1, on the Statistics tab of the ArkTS Snapshot lane, you can select a constructor or an instance node, click References in the search bar at the bottom, and confirm the operation. The Merged Incoming References tab on the right displays the shortest paths from all instances under the selected constructor to GC Roots.

Cluster Display
Since version 26.0.0, the Statistics area in the ArkTS Snapshot lane supports displaying constructors and objects using different clustering rules.
Currently, supported constructor types include JSObject, JSSharedObject, JSArray, Proxy, and (string), and supported object types include LocalHandleRoot and GlobalHandleRoot.
Available clustering rules include: Merge Shortest Paths, Merge Same Property, Merge Same Property and Shortest Paths, ClassName, NativeList, and Merge ClassName and NativeList.
- Merge Shortest Paths: shortest reference chain clustering. Objects are clustered by their shortest reference chain to GC Roots, with segments joined by "->".
- Merge Same Property: property-based clustering.
- JSObject and JSSharedObject: clustered in "property name :: property value" format, with segments joined by ",".
- JSArray: clustered by property name, with segments joined by ",".
- Proxy: clustered by the value of the target property, with segments joined by ",".
- Merge Same Property and Shortest Paths: property-based clustering + shortest reference chain clustering. Results from property-based clustering and shortest reference chain clustering are concatenated with "|".
- ClassName: class name-based clustering. Groups entries with identical property names under fileIds.
- NativeList: native list-based clustering. Instance objects are clustered based on native stack information from the Native List area on the right.
- If the Native List area does not exist or contains no data, items are clustered under NoNativeCallTree.
- If the Native List area contains only system code, items are clustered under the group representing all call stacks and concatenated using "->".
- If the Native List area contains both custom code and system code, items are clustered under the group representing custom code and concatenated using "->".
- Merge ClassName and NativeList: class name-based clustering + native list-based clustering. Results from class name-based clustering and native list-based clustering are concatenated with "|".
The following table lists the clustering rules applicable to constructors or objects.
Constructor/Object | Supported Clustering Rules |
|---|---|
JSObject | Merge Shortest Paths, Merge Same Property, and Merge Same Property and Shortest Paths |
JSSharedObject | Merge Shortest Paths, Merge Same Property, and Merge Same Property and Shortest Paths |
JSArray | Merge Shortest Paths, Merge Same Property, and Merge Same Property and Shortest Paths |
Proxy | Merge Shortest Paths, Merge Same Property, and Merge Same Property and Shortest Paths |
(string) | Merge Shortest Paths |
LocalHandleRoot | ClassName, NativeList, and Merge ClassName and NativeList |
GlobalHandleRoot | ClassName, NativeList, and Merge ClassName and NativeList |

For LocalHandleRoot and GlobalHandleRoot objects, supported clustering rules vary across templates:
- The Allocation template supports three clustering rules: ClassName, NativeList, and Merge ClassName and NativeList.
- The Snapshot and Commemory templates support only the ClassName clustering rule.
After you select a constructor or an object, the button in the bottom search bar becomes clickable. Click this button and configure the clustering rule. When you expand a constructor, contents will be displayed following the configured rule.
Visualizing Reference Chains
Since DevEco Studio 6.0.0 Beta1, the ArkTS Snapshot lane displays all reference chains in graph form. The system calculates the reference nodes around the target node and clearly presents the object's reference relationship in a relationship graph, making it easy to locate the root cause of issues.
Select an instance node or a reference node. When the Visualization button in the bottom search bar becomes available, click it and configure the search mode to enable the system to calculate the reference nodes around the selected node and display the reference relationship on the Graph tab.
A maximum of 30 reference nodes can be displayed. By default, 20 reference nodes are displayed. Currently, the following two reference chain expansion modes are supported:
- Retained Size: displays reference nodes by retained size in descending order.
- Distance: displays reference nodes by distance in ascending order.

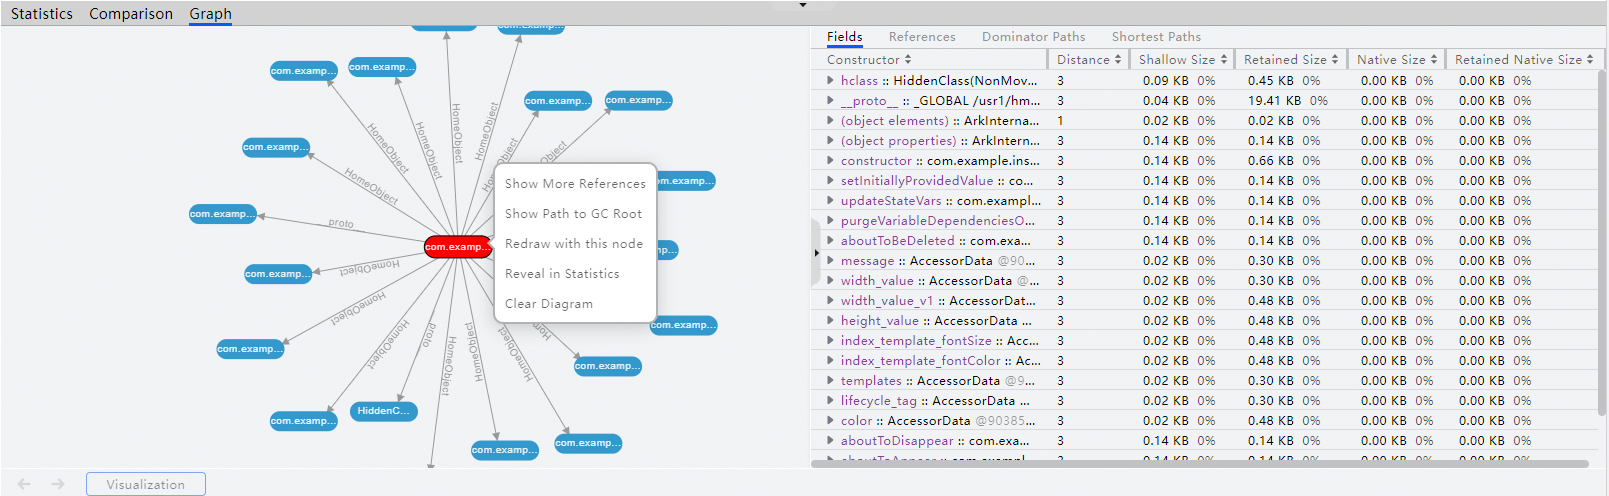
Once you set the search mode and click OK, the bottom tab will automatically navigate to the Graph tab to display the search results. The central node is marked in red, and the line segments indicate the reference relationship between the two connected nodes.

You can select a node to display its details on the More pane on the right, which includes the Fields, References, and Shortest Paths tabs. When you hover the pointer over a node or line segment in the graph, a tooltip will display the corresponding detailed information. The graph area supports dragging to pan and zooming via Ctrl + mouse wheel.
When you right-click a node, the displayed context menu includes the following options:
- Show More References: displays more reference chains of the current node. After this search mode is configured, the reference chain graph centered on the node is regenerated.
- Show Path to GC Root: displays the path from the current node to the GC root. After this search mode is selected, the reference chain graph centered on the node to the GC root is regenerated.
- Redraw with this node: redraws the reference chain graph centered on the node.
- Reveal in Statistics: displays the node on the Statistics tab.
- Clear Diagram: clears all content in the current graph and the activation status in the bottom bar.
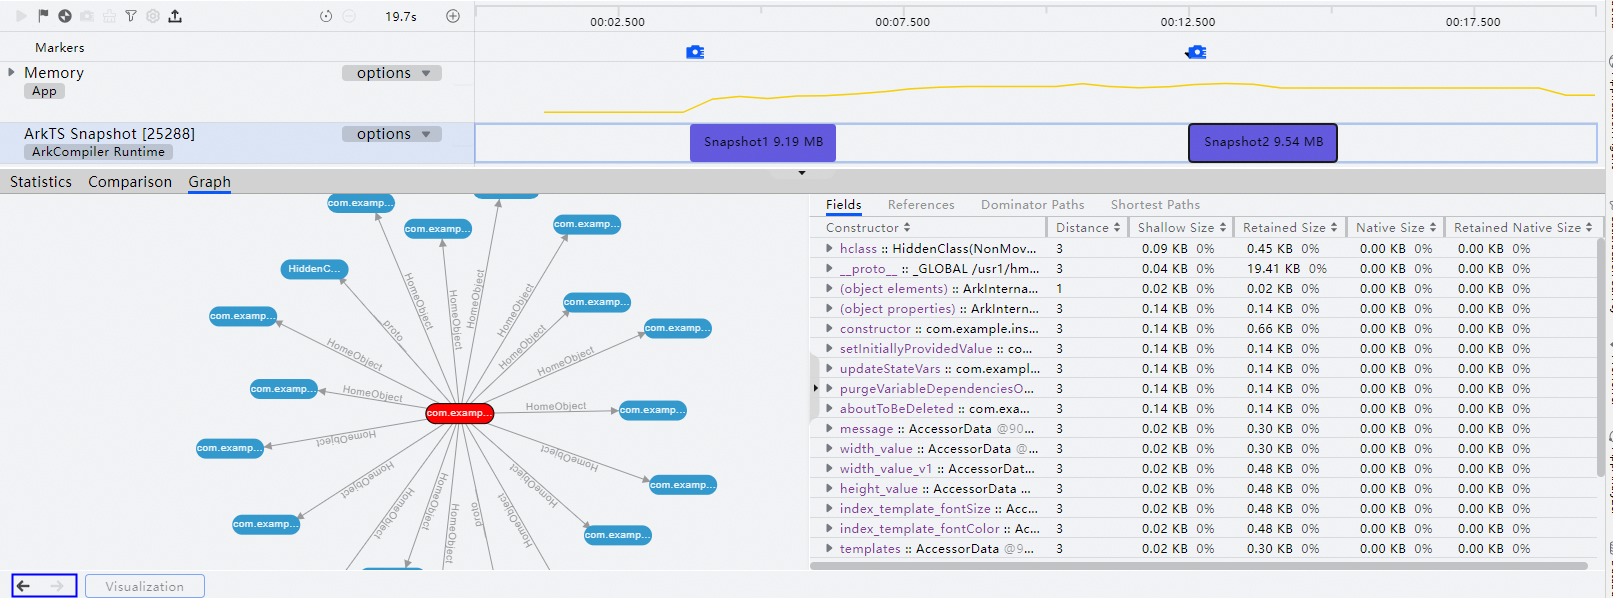
After selecting Show More References, Show Path to GC Root, or Redraw with this node, you can click the left or right arrow in the lower-left corner of the details area to navigate back to the previous graph or forward to the next graph, respectively. In this way, you can switch between multiple (a maximum of three) graphs. This feature is available only when the left or right arrow is not dimmed.
The Statistics and Comparison areas of the ArkTS Snapshot lane support memory object search by object name. You can enter an object name in the bottom search box to perform a fuzzy search.
In version 26.0.0 and later, the search box at the bottom of the Statistics area allows you to locate the target object by object ID in the format of "@id".

Importing Memory Snapshot Files Offline
For version 26.0.0 and later, you can import one or more .rawheap files separately. The tool will automatically import the matching .jsleaklist files. The import fails if the matching .jsleaklist file cannot be found. You can also import one or more .jsleaklist files, and the tool will automatically import the matching .rawheap files. Alternatively, import one or more .heapsnapshot or .rawheap files first, and then manually import the matching .jsleaklist files.
For versions earlier than 26.0.0, you can import one or more .heapsnapshot or .rawheap files first, and then manually import the matching .jsleaklist files.

- When importing files, ensure that the selected .rawheap file and the matching .jsleaklist file are in the same folder.
- The size of a single .heapsnapshot or .rawheap file cannot exceed 1.5 GB, and the size of a single .jsleaklist file cannot exceed 30 MB.
- A maximum of 10 files can be imported in batches.
- Simultaneous import of .rawheap and .jsleaklist files is supported.
- For files generated by JSLeakWatcher, a .rawheap file and a .jsleaklist file are considered matching if they share the same file name. The .jsleaklist file and the .heapsnapshot file are matched by the hash value contained in the files.
- Click Open File in the Create Session area on the DevEco Profiler main page to import .heapsnapshot, .rawheap, or .jsleaklist files.
- After the offline import succeeds, memory leak objects collected by JSLeakWatcher are displayed on the Leaks pane.

Parsing Memory Objects
Since DevEco Studio 6.1.0 Beta2, DevEco Profiler allows you to import nameCache files (code obfuscation products) and sourceMap files (ArkTS debugging products) to restore the file names and paths. The nameCache file is used as an example.
Before the file is imported, the Class field shows d8.
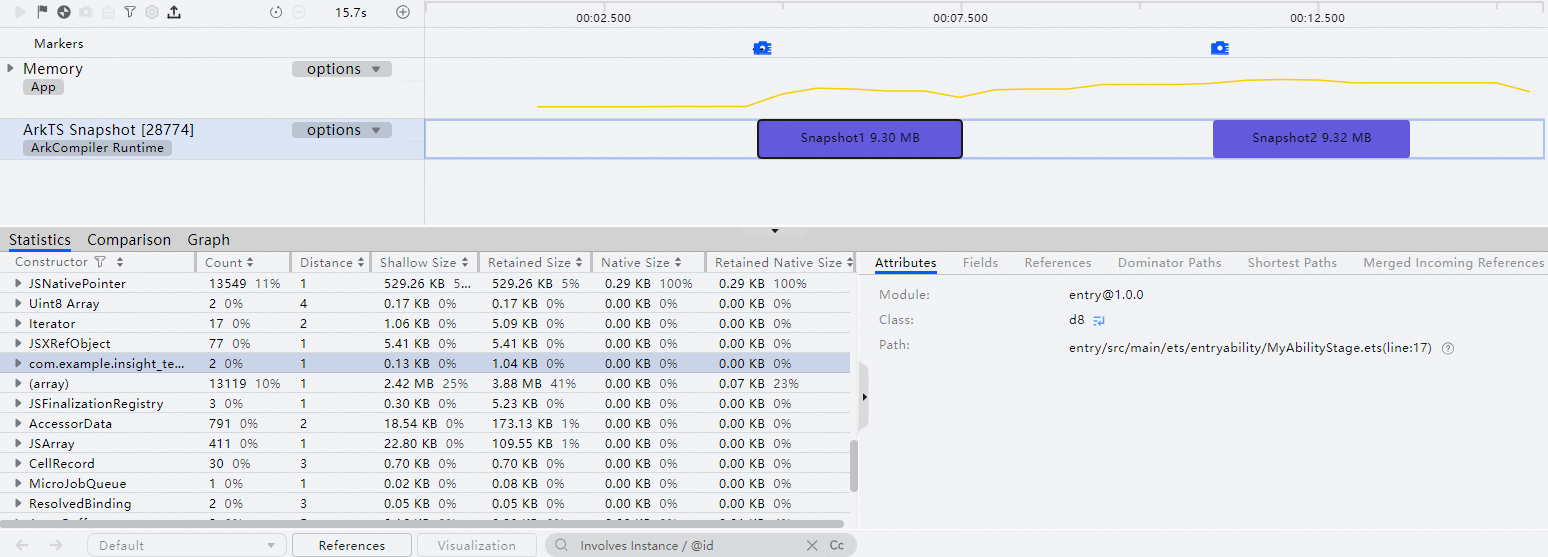
After the nameCache file is imported by clicking  on the toolbar, the Class field shows the file name MyAbilityStage.