In addition to basic debugging capabilities, DevEco Studio provides reverse debugging to help you better understand code and quickly locate faults in C/C++ development.
Reverse debugging, also called time travel debugging, allows you to roll back to historical lines and breakpoints during debugging to view historical debugging information of threads, stacks, and variables. DevEco Studio supports the following debugging operations:
- Enter/Exit the reverse debugging mode.
- Reversely step over to a historical line.
- Reversely resume execution to a historical breakpoint.
- View the values of global, static, and local variables at the record points of the app execution history.
Prerequisites
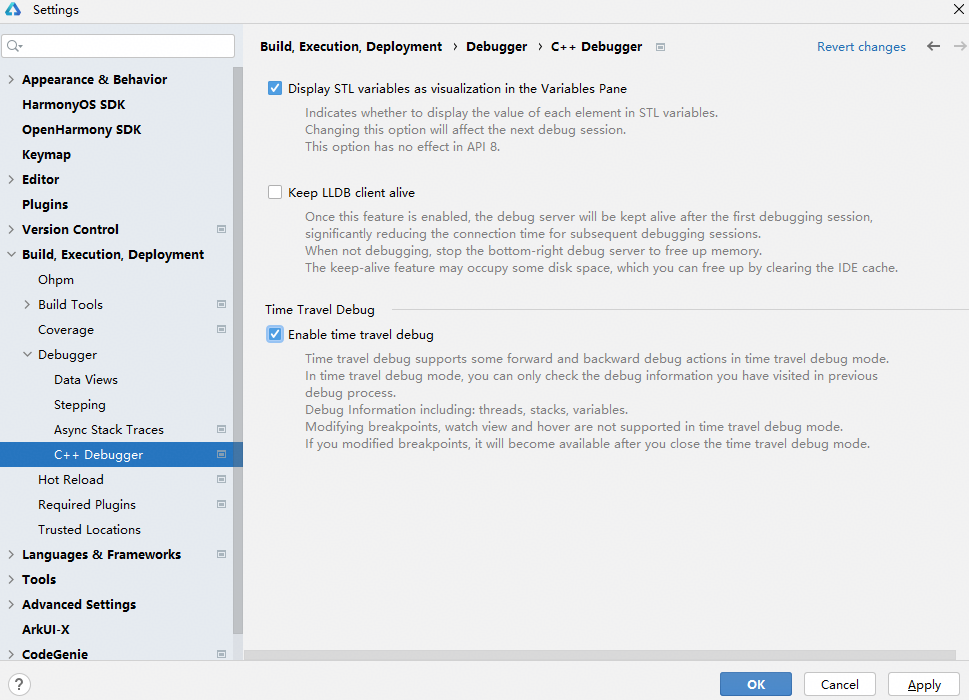
Before you start reverse debugging, ensure that reverse debugging is enabled as follows: choose File > Settings (DevEco Studio > Preferences/Settings on macOS) > Build,Execution,Deployment > Debugger > C++ Debugger, and select Enable time travel debug.
Procedure
- Set breakpoints and enter the debugging mode.
- Click the reverse debugging buttons in Debugger to perform reverse debugging.

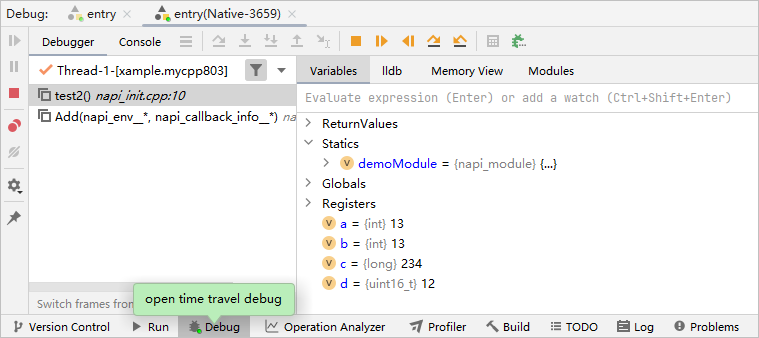
To view historical debugging information, click
 Open Time Travel Debug to enter the reverse debugging mode.
You can use:
 to exit the reverse debugging mode.
 to go to the next historical breakpoint from the current highlighted line and display the breakpoint information.
 to go to the previous historical breakpoint from the current highlighted line and display the breakpoint information.
 to go to the next historical line from the current highlighted line and display the code information.
 to go to the previous historical line from the current highlighted line and display the code information.

For the features that cannot be used in reverse debugging mode, a message will be displayed based on your behavior.