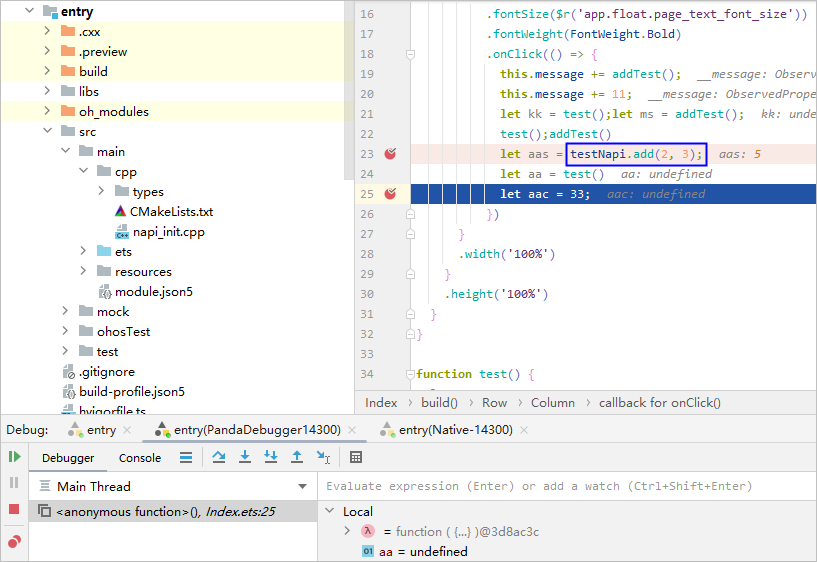
DevEco Studio supports cross-language debugging for both C++ and ArkTS, allowing you to debug these two languages simultaneously. The overall operation experience is consistent with single-language debugging, eliminating the need to add breakpoints in the respective languages.
- Connect DevEco Studio to a device. If the device to connect is a real device, sign your app/atomic service first. For details, see Signing Your App/Atomic Service.
- On the menu bar, choose Run > Edit Configurations, select the module (for example, entry) under Application in the left pane, select the Debugger tab in the right pane, and then set Debug type to Dual (ArkTS/JS + Native).

- When the code debugging execution reaches the point where ArkTS calls a C++ method, click Step Into to navigate to the first line of the corresponding C++ method.


- After stepping into the C++ code, you can view the C++ call stack in the Frames pane. To view the corresponding ArkTS call stack, right-click within the Frames pane and check Show ArkTS Stack Frame. Clicking any stack entry will then navigate you directly to the corresponding code line.

DevEco Studio 6.0.0 Beta3 and later support ArkTS variable viewing. Other operations related to variables are not currently supported.

- If there is a breakpoint in the code after the ArkTS call the C++ method, clicking Resume will return you to the next ArkTS breakpoint, allowing you to continue debugging the ArkTS code.