There are three tab pages on the Debug page: entry, entry(PandaDebugger), and entry(Native).
The entry tab page displays the HAP push and installation process.
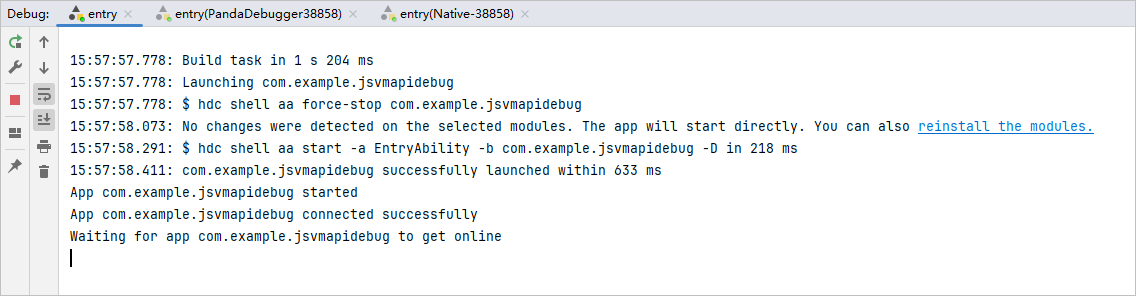
The second tab entry(PandaDebugger) and the third tab entry(Native) are debuggers. The entry(Native) is started only when native debugging is involved. The debugger contains two pages, Debugger and Console.
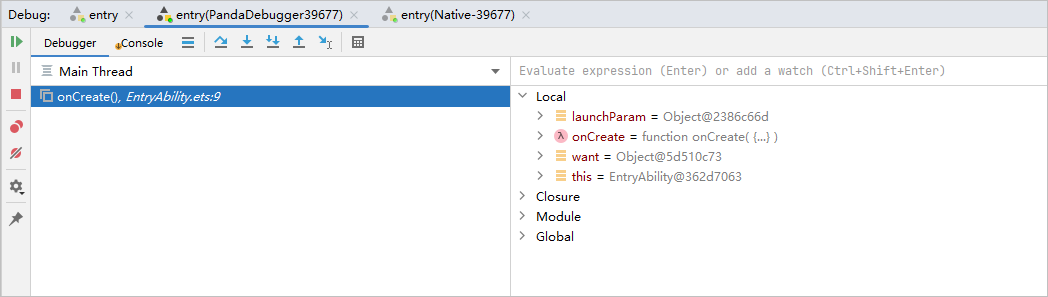
Debugger Page
The Debugger page provides two panes:
- Left Frames pane: displays the location of the code referenced by the current code when a breakpoint is hit during app debugging.
- Right Variables pane: displays the current variables.
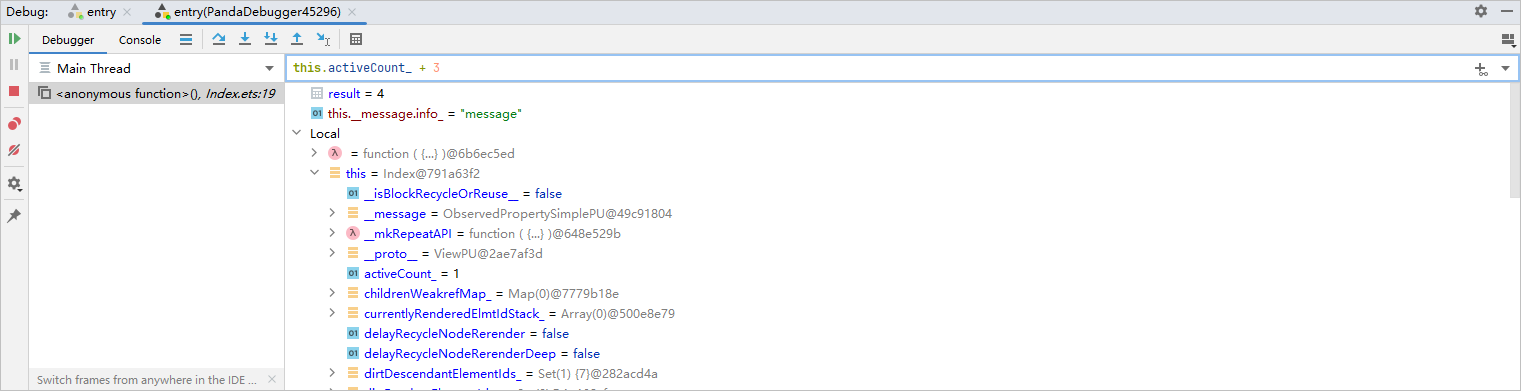
Button | Name | Shortcut Keys | Description |
|---|---|---|---|
| Resume Program | F9 (Option+Command+R for macOS) | Resumes execution. |
| Step Over | F8 | Proceeds to the next line of code without entering any function on that line. If the line contains a function, the debugger will execute the entire function as a step. |
| Step Into | F7 | Executes code one line at a time. If the current line contains a function, the debugger will enter that function and continue single-stepping within it. |
| Smart Step Into | Shift+F7 (Shift+F7 for macOS) | When multiple functions are nested or invoked in a single line of code, you can use the Smart Step Into feature to step into the desired function. |
| Step Out | Shift+F8 | Executes the rest of the current function and then returns to the calling function. |
| Stop | Ctrl+F2 (Command+F2 for macOS) | Stops debugging. |
| Run To Cursor | Alt+F9 (Option+F9 for macOS) | Continues the execution until it reaches the location of the cursor. |
| JSVM Debug Port | None | Forwards JSVM debugging requests. After the forwarding, you can perform JSVM-API Debugging in DevTools via the browser. NOTE: This button is available only in the Native debugger. |


[h2]Resume Program
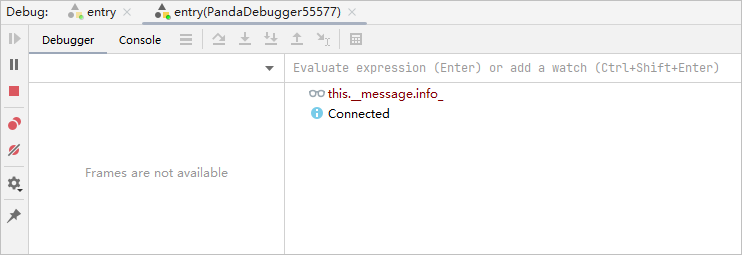
To resume execution of the app, click  Resume Program. If the next breakpoint is hit, the corresponding Frames and Variables are displayed. If no breakpoints exist, the app runs normally on the device and Frames and Variables disappear.


[h2]Step Into
To step into a function from the current code, click  Step Into.
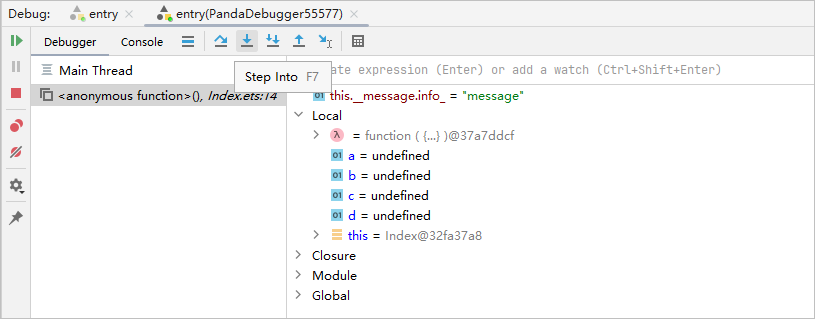
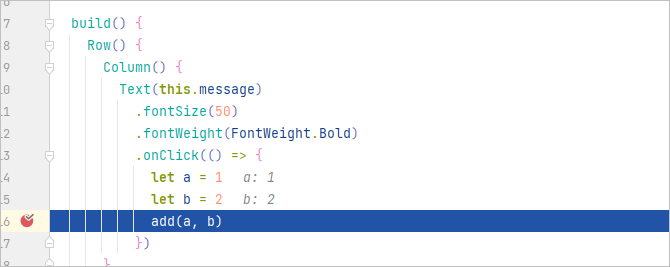
For example, step into add().



[h2]JSVM Debug Port
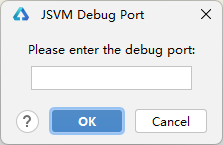
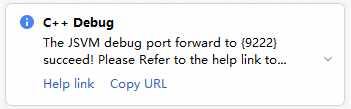
Click  JSVM Debug Port. The page for entering the forwarding port is displayed. Enter the port number and click OK. After the forwarding is successful, a dialog box is displayed. Debug the JS code as prompted. For details about the debugging method, see JSVM-API Debugging.
This feature is supported since DevEco Studio 5.1.0 Release.