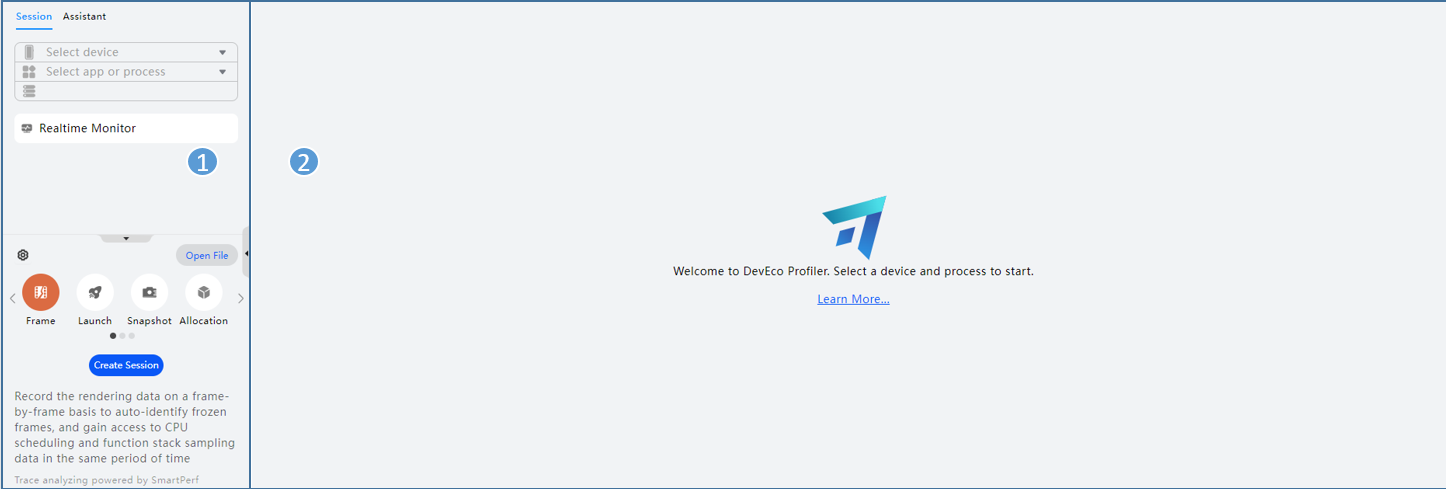
The UI of DevEco Profiler is divided into two areas:
① Session area: manages profiling sessions. This area provides the Realtime Monitor to help you identify problem scenarios and preliminarily demarcate the problem. In this area, you can select the target device, app, and process. The created analysis tasks are displayed in a list in the lower part.
A session is an independent and complete performance data unit, which is obtained through one-shot capture. Data in the same session can be associated with each other after being processed by the tool. Data in different sessions cannot be associated because they are collected in different time periods. Realtime Monitor is a session in essence, which is created by the real-time monitoring scenario template. When collecting data in a session, ensure that the scenario is completely reproduced before ending the capture.
The session area also provides scenario-specific analysis task types, such as Frame and Launch, to help you collect and display more detailed data. The collected data reflects the app running status in the corresponding scenario.
② Data area: displays performance data in a visualized manner. The data area contains the toolbar, timeline, lanes, and details, and displays tuning details in lanes.