The Web component supports using Crashpad to record process crash information. Crashpad is a process crash information processing tool provided by the Chromium kernel. After a process (Web rendering process) crash caused by the app using the Web component occurs, Crashpad writes a dmp file to the app main process sandbox directory. This file is in binary format with the dmp suffix, and records the cause of the process crash, thread information, register information, and so on. The app can use this file to analyze crash issues related to Web component processes. The Web component supports the onRenderExited and onRenderProcessNotResponding APIs starting from API version 9 and API version 12, respectively. You can use these Web APIs to detect rendering process exit and rendering process unresponsiveness, and add app processing logic in these APIs.
Procedure:
-
After a process crash caused by the app using the Web component occurs, Crashpad receives the signal, and the corresponding Hilog log (excerpt) is as follows:
pid-30069             I     [crashpad_ohos.cc:254] crashpad SandboxedHandler::HandleCrash, received signo = 6
pid-30069             I     [crashpad_ohos.cc:182] crashpad SandboxedHandler::HandleCrashNonFatal, connect to handler successfully, need to request dump
...
arkweb_cr..._handler  I     [crash_report_database.cc:91] crash dmp path : /data/storage/el2/log/crashpad/new/xxx.dmp
At this point, Crashpad starts requesting a dump. After the dump succeeds, a corresponding dmp file is generated in the sandbox directory of the application's main process. The corresponding sandbox path is as follows:
/data/storage/el2/log/crashpad
-
Refer to Accessing Files on the Native Side to access the dmp file in the app sandbox. You can also copy the file from the sandbox path where the dmp file is stored to a path that can be viewed. The example is as follows:
import { fileIo } from '@kit.CoreFileKit'
import { BusinessError } from '@kit.BasicServicesKit'
import { webview } from '@kit.ArkWeb'

@Entry
@Component
struct Index {
  controller: webview.WebviewController = new webview.WebviewController();
  uiContext: UIContext = this.getUIContext();
  build() {
    RelativeContainer() {
      Web({src:'chrome://memory-exhaust/', controller:this.controller})
      Button('file')
        .onClick(() => {
          let pathDir = this.uiContext.getHostContext()?.filesDir;
          console.info("pathdir=" + pathDir);
          fileIo.copyDir("/data/storage/el2/log/crashpad/pending/", pathDir, 0)
            .then(()=>{
              console.info("copy files success");
            })
            .catch((err: BusinessError)=>{
              console.error("copy failed with error message: " + err.message + ", error code: " + err.code);
            })
        })
    }
    .height('100%')
    .width('100%')
  }
}
The preceding example copies all dmp files to a viewable sandbox path. You can also search for ".dmp" in Hilog logs to obtain the dmp file name, and then copy a specific dmp file to another sandbox path. The specific path is
/data/app/el2/100/base/com.example.myapplication/haps/entry/files/
This path can be viewed using DevEco Studio.
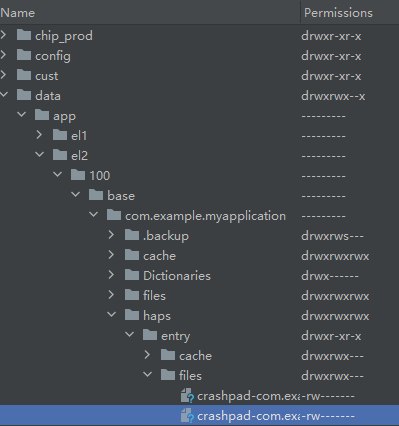
-
Parse the DMP file as follows:
-
Use the minidump_stackwalk tool to parse the DMP file, and then you can obtain the process crash information (crash cause, thread information, and register information). The example is as follows (Linux environment):
./minidump_stackwalk b678e0b5-894b-4794-9ab3-fb5d6dda06a3.dmp > parsed_stacktrace.txt
minidump_stackwalk is obtained by compiling the source code of the Breakpad project. For the compilation method, see the project repository: Breakpad repository address.
-
Sample of the parsed file is as follows:
Crash reason: SIGSEGV /SEGV_MAPERR The signal that causes the process crash, which is a segment error. Crash address: 0x0 Process uptime: 12 seconds Thread 0 (crashed) The Thread 0 crashes. 0 libweb_engine.so + 0x2e0b340 Call stack of layer 0. 0x2e0b340 is the offset address of the .so file, which can be used to decompile and parse the crash source code (depending on the unstripped .so file). x0 = 0x00000006a5719ff8 x1 = 0x000000019a5a28c0 x2 = 0x0000000000020441 x3 = 0x00000000000001b6 x4 = 0x0000000000000018 x5 = 0x0000000000008065 x6 = 0x0000000000008065 x7 = 0x63ff686067666d60 x8 = 0x0000000000000000 x9 = 0x5f129cf9e7bf008c x10 = 0x0000000000000001 x11 = 0x0000000000000000 x12 = 0x000000069bfcc6d8 x13 = 0x0000000009a1746e x14 = 0x0000000000000000 x15 = 0x0000000000000000 x16 = 0x0000000690df4850 x17 = 0x000000010c0d47f8 x18 = 0x0000000000000000 x19 = 0x0000005eea827db8 x20 = 0x0000005eea827c38 x21 = 0x00000006a56b1000 x22 = 0x00000006a8b85020 x23 = 0x00000020002103c0 x24 = 0x00000006a56b8a70 x25 = 0x0000000000000000 x26 = 0x00000006a8b84e00 x27 = 0x0000000000000001 x28 = 0x0000000000000000 fp = 0x0000005eea827c10 lr = 0x000000069fa4b33c sp = 0x0000005eea827c10 pc = 0x000000069fa4b340 Found by: given as instruction pointer in context 1 libweb_engine.so + 0x2e0b338 fp = 0x0000005eea827d80 lr = 0x000000069fa48d44 sp = 0x0000005eea827c20 pc = 0x000000069fa4b33c Found by: previous frame's frame pointer 2 libweb_engine.so + 0x2e08d40 fp = 0x0000005eea827e50 lr = 0x00000006a385cef8 sp = 0x0000005eea827d90 pc = 0x000000069fa48d44 Found by: previous frame's frame pointer 3 libweb_engine.so + 0x6c1cef4 fp = 0x0000005eea828260 lr = 0x00000006a0f11298 sp = 0x0000005eea827e60 pc = 0x00000006a385cef8 ...... -
Use the LLVM toolchain to parse the crash source code location. Note that the so file to be parsed must be an so file with a symbol table. If the stack shows that it is related to the web so, you can submit an issue or IR ticket in the community. The example is as follows (Linux environment):
./llvm-addr2line -Cfpie libweb_engine.so 0x2e0b340
The llvm-addr2line toolchain is located in the SDK.
-