To verify how an atomic service looks and behaves, you can run and debug it.
Running Atomic Services on Local Real Devices
The procedure for running HarmonyOS atomic services on a phone is the same as that on a tablet. You can use either USB or wireless debugging for connection.
For details, see Running Your App on a Local Real Device.
Debugging with Hot Reload
Hot reload allows code changes to take effect in real time. After this feature is enabled in DevEco Studio, the debug device will automatically apply changes upon modification of page files (CSS, HXML, JS, or JSON) without additional steps. This significantly reduces recompilation and execution time while delivering a dramatic boost to development efficiency.

[h2]System Requirements
The following conditions should be met to use hot reload:
- The ASCF runtime version must be 1.0.10 or later.
- The ASCF Toolkit version must be 1.0.5 or later.
- The ASCF Plugin version must be 1.0.4.300 or later.
[h2]Enabling Hot Reload
- Connect to a device and select the device where the atomic service is running in DevEco Studio.
- Select an entry with
 from the run/debug configuration menu to enter the hot reload mode.
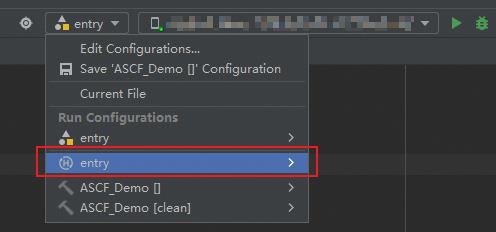
- Click the run button to enable hot reload. Wait until hot reload is enabled.
- After the CSS, HXML, JS, and JSON files are modified and saved, you can view the modified effects on the device in real time.
- Click the stop button to disable hot reload.


Debugging and Running ASCF Source Code
ASCF runtime includes the view layer (Webview) and the logic layer (V8 engine), with both supporting local debugging.
To debug an ASCF project, run the following commands in the root directory of the ASCF project.
Enabling Webview debugging and V8 engine debugging:
ascf debugger start
After the command is executed successfully, open the debugging tool page in Chrome based on the log information.
Disabling Webview debugging and V8 engine debugging:
ascf debugger stop
Enabling Webview debugging:
ascf debugger start-view
Disabling Webview debugging:
ascf debugger stop-view
Enabling V8 engine debugging:
ascf debugger start-service
Disabling V8 engine debugging:
ascf debugger stop-service
Checking the current debugging status.
ascf debugger status
[h2]Opening the Debugging Page in Chrome
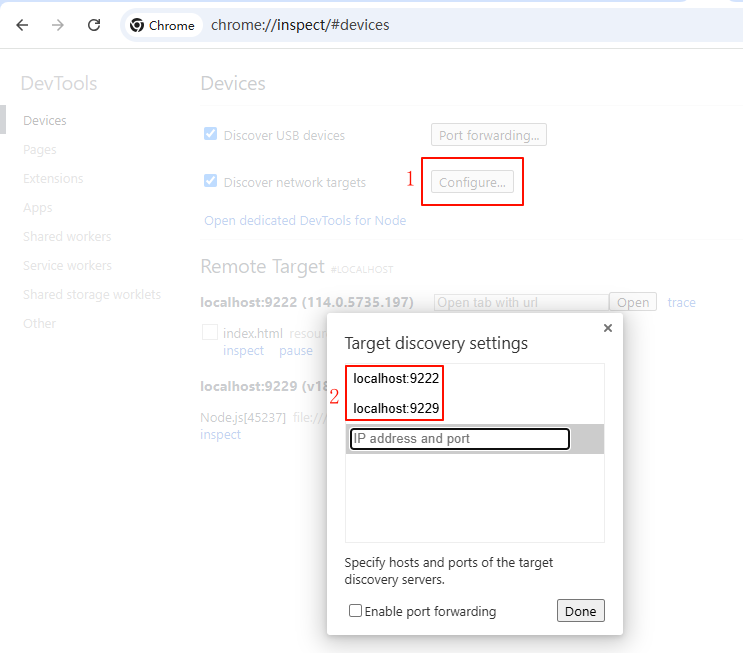
- Input chrome://inspect/#devices in the address box of Chrome on the PC and open the page.
- Configure the Chrome debugging tool.
The web page to be debugged needs to be discovered from the local TCP ports 9222 and 9229. Therefore, ensure that Discover network targets is selected. Then, configure the network. Port 9222 corresponds to the Webview debugging window, and port 9229 corresponds to the V8 engine debugging window.
(1) Click the Configure button.
(2) Add localhost:9222 and localhost:9229 to Target discovery settings.
[h2]Parameters Supported by the Toolchain Debugging Function
You can run the following command to obtain the help information about the parameters of the CLI tool debugging function:
ascf debugger start --help
Category | Option | Description |
|---|---|---|
Debug | --bundleName | Name of the ASCF package to debug. Example: ascf debugger start --bundleName com.atomicservice.1234568789 |
--deviceId | ID of the device for debugging when the PC is connected to multiple devices. Example: ascf debugger start --deviceId 123456789 You can run the hdc list targets command to query all connected target devices. |
If the preceding commands are not supported, upgrade ASCF Toolkit to 1.0.5 or later, or perform the following operations:
- For details about how to enable Webview debugging, see Debugging Frontend Pages by Using DevTools.
- To enable V8 engine debugging, set debug=true in manifest.json.
- After running the hdc fport tcp:9229 tcp:9225 command locally, visit http://localhost:9229/json, and use the URL in the devtoolsFrontendUrl field to open the debugging page.