Introduction
SmartPerf Device is a reliable, easy-to-use performance and power consumption test tool. In this tool, you can monitor the performance and power consumption of your application and device with quantitative metrics, such as FPS, CPU, GPU, RAM, and Temp.
Targeted at devices with or without screens, SmartPerf Device provides two modes: Device-hap and Device-daemon. Device-hap is applicable to devices with screens and provides a visualized, intuitive UI that simplifies your operations. You can start and pause a test with a floating window, view performance data in real time, and save the test results for further analysis. Device-daemon is applicable to devices with and without screens and works with shell commands.
[h2]Metrics
- CPU: The tool reads the frequencies and usage of CPU cores on the test device on a per second basis to measure the CPU usage of the target application. Sustained high CPU may lead to overheating.
- GPU: The tool reads the GPU frequency and load information of the test device on a per second basis to measure the GPU usage of the target application. High GPU usage can lead to performance drops and application slowdowns.
- FPS: The tool reads the frame rate, in frames per second (FPS), of the target application to measure the smoothness of the application image. A higher FPS generally means smoother visuals.
- TEMP: The tool reads the temperature information of the test device on a per second basis, including the GPU temperature and system chip temperature.
- RAM: The tool reads the RAM usage of the target application on a per second basis.
- snapshot: The tool takes a screenshot of the application UI every 2 seconds.
Implementation Principles
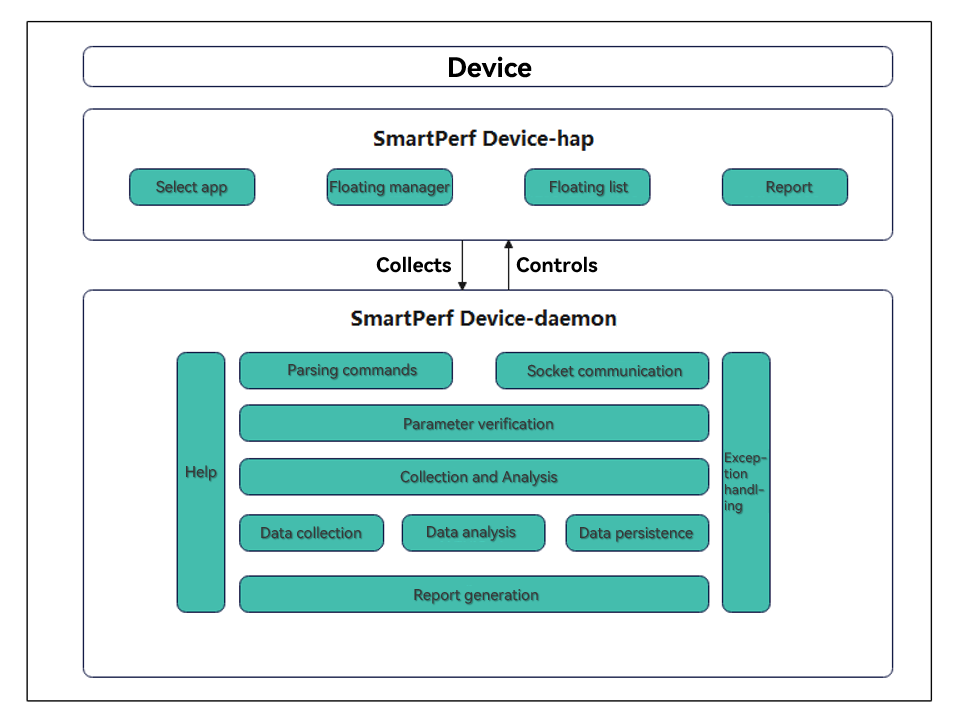
The figure below demonstrates the main functions of SmartPerf Device. Set data collection items and parameters on Device-hap, start the application, and then send data requests for KPIs (such as FPS, RAM, and Trace) from Device-hap to Device-daemon through messages. Device-daemon collects, persists, and analyzes data as requested, and then sends the data to Device-hap for display.
Constraints
Device-daemon and are pre-installed since API version 9.
Device-daemon must be connected to a hardware device, and Device-hap can only be used on devices with a screen.
Before using Device-Daemon, configure the hdc environment.
[h2]Obtaining the Application List
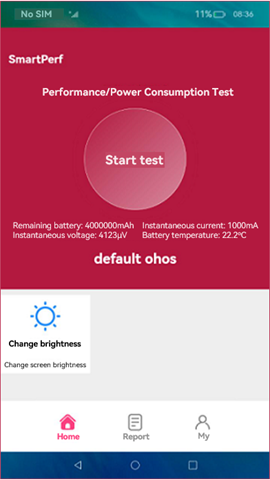
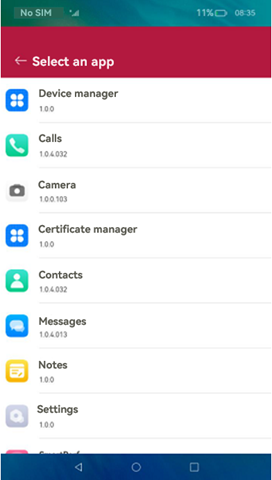
Start SmartPerf Device-hap. On the home screen, touch Select an app.
[h2]Setting Collection Parameters
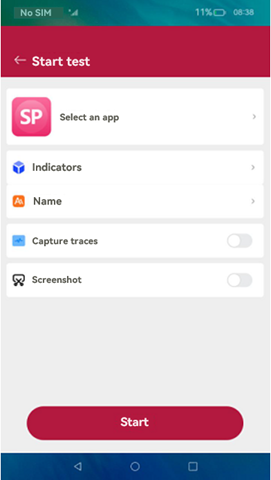
After the target application is selected, return to the start page and set the test metrics. You can also change the test name (which includes the name of the target application and the test time and will be displayed in the report), and specify whether to capture traces and whether to enable the screenshot feature. When you are done, touch the Start button at the bottom.
[h2]Using the Floating Window to Manage Data Collection
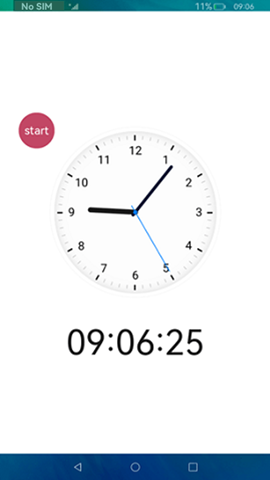
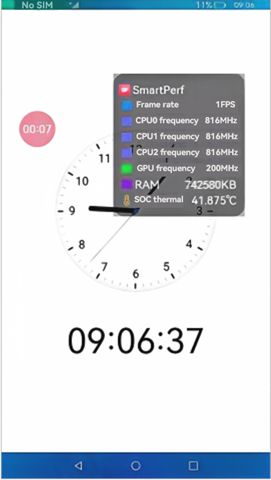
To start collection, touch Start in the floating window. To pause, touch the timer in the floating window. To resume, touch the timer again. To view the collected data in real time, double-touch the timer. To stop, touch and hold the timer.
You can drag the floating window to anywhere you like.


[h2]Collection Prerequisites
Switch to shell.
C:\Users\issusser>hdc shell
$
Start and view the daemon process.
C:\Users\issusser>hdc shell
// Start the daemon process.
$ SP_daemon
// Check whether the daemon process is running.
$ ps -ef | grep SP_daemon
shell          1584     1 0 21:50:05 ?     00:00:00 SP_daemon
shell          1595  1574 3 21:51:02 pts/0 00:00:00 grep SP_daemon
$
View the help information.
$ SP_daemon --help
HarmonyOS performance testing tool SmartPerf command-line version
 Usage: SP_daemon [options] [arguments]

 options:
  -N              set the collection times(default value is 0) range[1,2147483647], for example: -N 10
  -PKG            set package name, must add, for example: -PKG ohos.samples.ecg
  -PID            set process pid, must add, for example: -PID 3568
  -threads        get threads, must add -PID or -PKG for example:
                  -threads -PID 3568 or -threads -PKG ohos.samples.ecg
  -fds            get file descriptor, must add -PID or -PKG for example:
                  -fds -PID 3568 or -fds -PKG ohos.samples.ecg
  -c              get device CPU frequency and CPU usage, process CPU usage and CPU load ..
  -ci             get cpu instructions and cycles
  -g              get device GPU frequency and GPU load
  -f              get app refresh fps(frames per second) and fps jitters and refreshrate
  -profilerfps    get refresh fps and timestamp
  -sections       set collection time period(using with profilerfps)
  -t              get remaining battery power and temperature..
  -p              get battery power consumption and voltage(Not supported by some devices)
  -print          start mode print log
  -r              get process memory and total memory
  -snapshot       get screen capture
  -net            get uplink and downlink traffic
  -start          collection start command
  -stop           collection stop command
  -VIEW           set layler, for example: -VIEW DisplayNode
  -OUT            set csv output path.
  -d              get device DDR information
  -screen         get screen resolution
  -deviceinfo     get device information
  -server         start a process to listen to the socket message of the start and stop commands
  -clear          clear the process ID
  -ohtestfps      used by the validator to obtain the fps, the collection times can be set
  -editorServer   start a process to listen to the socket message of the editor
  -recordcapacity get the battery level difference
  --version       get version
  --help          get help
  -editor         scenario-based collection identifier, parameter configuration items can be added later
  responseTime   get the page response delay after an application is operated
  completeTime   get the page completion delay after an application is operated
  fpsohtest      used by the validator to obtain the fps
  example1:
  SP_daemon -N 20 -c -g -t -p -r -net -snapshot -d
  SP_daemon -N 20 -PKG ohos.samples.ecg -c -g -t -p -f -r -net -snapshot -d
  SP_daemon -start -c
  SP_daemon -stop
  example2: These parameters need to be used separately
  SP_daemon -screen
  SP_daemon -deviceinfo
  SP_daemon -server
  SP_daemon -clear
  SP_daemon -ohtestfps 10
  SP_daemon -editorServer
  SP_daemon -recordcapacity
  example3: These parameters need to be used separately
  SP_daemon -editor responseTime ohos.samples.ecg app name
  SP_daemon -editor completeTime ohos.samples.ecg app name
  SP_daemon -editor fpsohtest


  command exec finished!
 $
[h2]Basic Collection
This feature collects GPU, FPS, CPU, DDR, and memory metrics for the entire device or specific applications. It supports the following operations:
1. Per-second sampling
| Command | Mandatory | Description |
|---|---|---|
| -N | Yes | Sets the number of collection times (once per second). |
| -PKG | No | Sets the bundle name. |
| -PID | No | Sets the process ID or thread ID. |
| -threads | No | Collects the number of child threads of an application. |
| -fds | No | Collects application file descriptors. This option is available only for the root user. |
| -c | No | Collects the CPU frequency and usage. When the application bundle name is set, the system and application CPU information is collected. Otherwise, only the system CPU information is collected. |
| -ci | No | Collects the number of CPU instructions. When the application bundle name is set, the number of CPU instructions of the system and application is collected. Otherwise, the number of CPU instructions of the system is collected. |
| -g | No | Collects the GPU frequency and load information. |
| -f | No | Collects the screen refresh rate and frame rate of the target application. The application bundle name must be specified. |
| -t | No | Collects the temperature of GPU and system chip. |
| -r | No | Collects the memory. When the application bundle name is set, the system and application memory information is obtained. Otherwise, only the system memory information is obtained. |
| -snapshot | No | Takes a screenshot. |
| -net | No | Collects the network speed. |
| -VIEW | No | Sets the view layer. You must obtain the layer name first. |
| -d | No | Collects the DDR data. |
| -sections | No | Sets segment-based collection. |
Collect the number of application threads once based on the bundle name.
  $ SP_daemon -N 1 -PKG ohos.samples.ecg -threads

  order:0 timestamp=1741415592481
  order:1 threadsNum=18847:113|
  order:2 tids=18847:43411 43409 43350 43236 25783 25622 25384 25381 19423 19170 19167 19166 19165 19163 19162 19159 19157 19156 19154 19153 19152 19151 19150 19149 19147 19146 19145 19142 19141 19140 19139 19136 19135 19134 19120 19112 19111 19088 19083 19081 19077 19076 19075 19074 19073 19072 19071 19070 19055 19044 19040 19039 19034 19033 19032 19031 19030 19029 19028 19027 19019 19017 19016 19015 19014 19013 19012 19011 19009 19007 19006 19005 19004 19003 19001 19000 18999 18998 18997 18996 18995 18994 18993 18992 18991 18990 18989 18988 18987 18986 18985 18984 18983 18982 18981 18980 18977 18974 18946 18942 18936 18934         18933 18931 18930 18929 18928 18927 18926 18925 18924 18923 18847|

  command exec finished!
  $
Collect the frequency and usage of CPU cores twice.
  $ SP_daemon -N 2 -c

  order:0 timestamp=1501839064260
  order:1 TotalcpuUsage=0.502513
  order:2 TotalcpuidleUsage=99.497487
  order:3 TotalcpuioWaitUsage=0.000000
  order:4 TotalcpuirqUsage=0.000000
  order:5 TotalcpuniceUsage=0.000000
  order:6 TotalcpusoftIrqUsage=0.000000
  order:7 TotalcpusystemUsage=0.251256
  order:8 TotalcpuuserUsage=0.251256
  order:9 cpu0Frequency=1992000
  order:10 cpu0Usage=1.000000
  order:11 cpu0idleUsage=99.000000
  order:12 cpu0ioWaitUsage=0.000000
  order:13 cpu0irqUsage=0.000000
  order:14 cpu0niceUsage=0.000000
  order:15 cpu0softIrqUsage=0.000000
  order:16 cpu0systemUsage=0.000000
  order:17 cpu0userUsage=1.000000
  order:18 cpu1Frequency=1992000
  order:19 cpu1Usage=0.000000
  order:20 cpu1idleUsage=100.000000
  order:21 cpu1ioWaitUsage=0.000000
  order:22 cpu1irqUsage=0.000000
  order:23 cpu1niceUsage=0.000000
  order:24 cpu1softIrqUsage=0.000000
  order:25 cpu1systemUsage=0.000000
  order:26 cpu1userUsage=0.000000
  order:27 cpu2Frequency=1992000
  order:28 cpu2Usage=1.000000
  order:29 cpu2idleUsage=99.000000
  order:30 cpu2ioWaitUsage=0.000000
  order:31 cpu2irqUsage=0.000000
  order:32 cpu2niceUsage=0.000000
  order:33 cpu2softIrqUsage=0.000000
  order:34 cpu2systemUsage=1.000000
  order:35 cpu2userUsage=0.000000
  order:36 cpu3Frequency=1992000
  order:37 cpu3Usage=0.000000
  order:38 cpu3idleUsage=100.000000
  order:39 cpu3ioWaitUsage=0.000000
  order:40 cpu3irqUsage=0.000000
  order:41 cpu3niceUsage=0.000000
  order:42 cpu3softIrqUsage=0.000000
  order:43 cpu3systemUsage=0.000000
  order:44 cpu3userUsage=0.000000

  ...

  command exec finished!
  $
Collect the frequency and usage of CPU cores and CPU usage and load of processes twice based on the bundle name.
  $ SP_daemon -N 2 -PKG ohos.samples.ecg -c


  order:0 timestamp=1741415021814
  order:1 ChildProcCpuLoad=NA
  order:2 ChildProcCpuUsage=NA
  order:3 ChildProcId=NA
  order:4 ChildProcSCpuUsage=NA
  order:5 ChildProcUCpuUsage=NA
  order:6 ProcAppName=ohos.samples.ecg
  order:7 ProcCpuLoad=2.742330
  order:8 ProcCpuUsage=7.825508
  order:9 ProcId=18847
  order:10 ProcSCpuUsage=2.014652
  order:11 ProcUCpuUsage=5.810856
  order:12 TotalcpuUsage=22.527016
  order:13 TotalcpuidleUsage=77.472984
  order:14 TotalcpuioWaitUsage=0.000000
  order:15 TotalcpuirqUsage=0.083126
  order:16 TotalcpuniceUsage=0.000000
  order:17 TotalcpusoftIrqUsage=0.000000
  order:18 TotalcpusystemUsage=7.148795
  order:19 TotalcpuuserUsage=15.295096
  order:20 cpu0Frequency=1430000
  order:21 cpu0Usage=52.475248
  order:22 cpu0idleUsage=47.524752
  order:23 cpu0ioWaitUsage=0.000000
  order:24 cpu0irqUsage=0.000000

  ...

  command exec finished!
  $
Collect the frequency and usage of CPU cores and CPU usage and load of processes twice based on the process ID.
  $ SP_daemon -N 2 -PID 18847 -c


  order:0 timestamp=1741415133211
  order:1 ChildProcCpuLoad=NA
  order:2 ChildProcCpuUsage=NA
  order:3 ChildProcId=NA
  order:4 ChildProcSCpuUsage=NA
  order:5 ChildProcUCpuUsage=NA
  order:6 ProcAppName=ohos.samples.ecg
  order:7 ProcCpuLoad=2.510634
  order:8 ProcCpuUsage=7.005678
  order:9 ProcId=18847
  order:10 ProcSCpuUsage=2.697061
  order:11 ProcUCpuUsage=4.308617
  order:12 TotalcpuUsage=24.979114
  order:13 TotalcpuidleUsage=75.020886
  order:14 TotalcpuioWaitUsage=0.000000
  order:15 TotalcpuirqUsage=0.083542
  order:16 TotalcpuniceUsage=0.000000
  order:17 TotalcpusoftIrqUsage=0.000000
  order:18 TotalcpusystemUsage=8.270677
  order:19 TotalcpuuserUsage=16.624896
  order:20 cpu0Frequency=1430000
  order:21 cpu0Usage=50.000000
  order:22 cpu0idleUsage=50.000000
  order:23 cpu0ioWaitUsage=0.000000
  order:24 cpu0irqUsage=0.000000
  ...
  command exec finished!
  $

- Make sure you are on the application screen when running this command.
Collect the GPU frequency and load of the system once.
  $ SP_daemon -N 1 -g

  order:0 timestamp=1503078740268
  order:1 gpuFrequency=200000000
  order:2 gpuLoad=38.000000

  command exec finished!
  $
Collect the system temperature twice.
  $ SP_daemon -N 2 -t

  order:0 timestamp=1502720711191
  order:1 gpu-thermal=42500.000000
  order:2 soc-thermal=43.125000


  order:0 timestamp=1502720712191
  order:1 gpu-thermal=41875.000000
  order:2 soc-thermal=42.500000

  command exec finished!
  $
Collect the memory information of the system twice.
  $ SP_daemon -N 2 -r
  order:0 timestamp=1705041562521
  order:1 memAvailable=7339224
  order:2 memFree=7164708
  order:3 memTotal=11641840

  order:0 timestamp=1705041563527
  order:1 memAvailable=7339136
  order:2 memFree=7164684
  order:3 memTotal=11641840

  command exec finished!
  $
Collect the memory of the system and specified application process once based on the bundle name.
  $ SP_daemon -N 1 -PKG ohos.samples.ecg -r


  order:0 timestamp=1741415257059
  order:1 arktsHeapPss=44835
  order:2 childCarktsHeapPss=NA
  order:3 childGpuPss=NA
  order:4 childGraphicPss=NA
  order:5 childHeapAlloc=NA
  order:6 childHeapFree=NA
  order:7 childHeapSize=NA
  order:8 childNativeHeapPss=NA
  order:9 childPrivateClean=NA
  order:10 childPrivateDirty=NA
  order:11 childPss=NA
  order:12 childSharedClean=NA
  order:13 childSharedDirty=NA
  order:14 childStackPss=NA
  order:15 childSwap=NA
  order:16 childSwapPss=NA
  order:17 gpuPss=222377
  order:18 graphicPss=184276
  order:19 heapAlloc=154696
  order:20 heapFree=780
  order:21 heapSize=163208
  order:22 memAvailable=4612096
  order:23 memFree=1240924
  order:24 memTotal=11692696
  order:25 nativeHeapPss=85290
  order:26 privateClean=195816
  order:27 privateDirty=418973
  order:28 pss=693349
  order:29 sharedClean=146848
  order:30 sharedDirty=71056
  order:31 stackPss=2492
  order:32 swap=25360
  order:33 swapPss=25356

  command exec finished!
  $
Collect the memory of the system and specified application process once based on the process ID.
  $ SP_daemon -N 1 -PID 18847 -r


  order:0 timestamp=1741415293198
  order:1 arktsHeapPss=45011
  order:2 childCarktsHeapPss=NA
  order:3 childGpuPss=NA
  order:4 childGraphicPss=NA
  order:5 childHeapAlloc=NA
  order:6 childHeapFree=NA
  order:7 childHeapSize=NA
  order:8 childNativeHeapPss=NA
  order:9 childPrivateClean=NA
  order:10 childPrivateDirty=NA
  order:11 childPss=NA
  order:12 childSharedClean=NA
  order:13 childSharedDirty=NA
  order:14 childStackPss=NA
  order:15 childSwap=NA
  order:16 childSwapPss=NA
  order:17 gpuPss=222381
  order:18 graphicPss=184276
  order:19 heapAlloc=154588
  order:20 heapFree=757
  order:21 heapSize=163184
  order:22 memAvailable=4612096
  order:23 memFree=1238420
  order:24 memTotal=11692696
  order:25 nativeHeapPss=85274
  order:26 privateClean=195996
  order:27 privateDirty=418977
  order:28 pss=693440
  order:29 sharedClean=146848
  order:30 sharedDirty=71056
  order:31 stackPss=2492
  order:32 swap=25360
  order:33 swapPss=25356

  command exec finished!
  $

- Make sure you are on the application screen when running this command.
- This command integrates the -m command of earlier version, which obtains data such as arktsHeapPss, gpuPss, graphicPss.
Collect the number of CPU instructions of the system once.
  $ SP_daemon -N 1 -ci

  order:0 cycles per instruction=4.098151
  order:1 hw-cpu-cycles=190604622.000000
  order:2 hw-instructions=46509906.000000
  order:3 timestamp=1609502927840
  command exec finished!
  $
Collect the number of CPU instructions of the system and specified application once based on the bundle name.
  $ SP_daemon -N 1 -PKG ohos.samples.ecg -ci

  order:0 cycles per instruction=4.121963
  order:1 hw-cpu-cycles=190092457.000000
  order:2 hw-instructions=46116973.000000
  order:3 timestamp=1609502995191
  command exec finished!
  $

- Make sure you are on the application screen when running this command.
Take two screenshots.
  $ SP_daemon -N 2 -snapshot

  order:0 timestamp=1501837609657
  order:1 capture=data/local/tmp/capture/screenCap_1501837609657.png


  order:0 timestamp=1501837610657
  order:1 capture=NA

  command exec finished!
  $

Screenshots are obtained every 2 seconds.
When the collection is complete, you can view the screenshots in data/local/tmp/capture.
To export the screenshots to drive D, open a new CLI and run the hdc file recv data/local/tmp/capture/screenCap_1700725192774.png D:\\ command.
Collect the network speeds twice.
  $ SP_daemon -N 2 -net

  order:0 timestamp=1705041904832
  order:1 networkDown=0
  order:2 networkUp=0

  order:0 timestamp=1705041905870
  order:1 networkDown=22931
  order:2 networkUp=2004

  command exec finished!
  $
Collect the frame rate of a specified application five times based on the bundle name.
  $ SP_daemon -N 5 -PKG ohos.samples.ecg -f

  order:0 timestamp=1705306472232
  order:1 fps=43
  order:2 fpsJitters=602261688;;8352083;;8267708;;8305209;;8298437;;8308854;;8313542;;8569271;;8061458;;8300521;;8308333;;8309896;;8429167;;8241667;;8258333;;8318229;;8312500;;8304167;;41760937;;16418750;;8298959;;8319270;;8308334;;8313541;;8302605;;8320312;;8298958;;8326042;;8321354;;8301042;;8310417;;8309895;;8308855;;8331250;;8286458;;8343229;;8278125;;8311458;;8306250;;8312500;;8320834;;8346875;;8283333
  order:3 refreshrate=69

  order:0 timestamp=1705306473234
  order:1 fps=40
  order:2 fpsJitters=674427313;;8191145;;8310417;;8319271;;8301562;;8318750;;8302084;;8314062;;8333334;;8283854;;8307812;;8311979;;8310417;;8307813;;8309375;;8323958;;8306250;;8308333;;8317709;;8296875;;8721875;;7895833;;8320833;;8340625;;8276563;;8409896;;8216145;;8310938;;8301042;;8362500;;8252604;;8317708;;8376042;;8256250;;8292187;;8303125;;8313542;;8310417;;8520312
  order:3 refreshrate=69
  ...

  command exec finished!
  $
Collect the frame rate of the specified view layer 10 times.
  $ SP_daemon -N 10 -VIEW DisplayNode -f
  order:0 timestamp=1705306822850
  order:1 fps=15
  order:2 fpsJitters=876291843;;8314062;;8308334;;8314583;;8310417;;8308333;;8326042;;8314583;;8292708;;8492709;;8143750;;8340104;;8294271;;8302604;;8297396
  order:3 refreshrate=69

  order:0 timestamp=1705306823852
  order:1 fps=12
  order:2 fpsJitters=906667363;;8279167;;8311458;;8315625;;8291146;;8313021;;8323438;;8293750;;8303125;;8313541;;8301563;;8317708
  order:3 refreshrate=69
  ...

  command exec finished!
  $

DisplayNode indicates the name of the specified layer.
When using this command to collect data, you need to operate the page on the specified layer.
This command cannot be used together with the commands used to collect frame rate of a specified application, such as the SP_daemon -N 20 -PKG ohos.samples.ecg -f or SP_daemon -N 20 -VIEW DisplayNode -f commands.
Collect DDR information once.
  $ SP_daemon -N 1 -d

  order:0 timestamp=1710916175201
  order:1 ddrFrequency=1531000000

  command exec finished!
  $
Example 1: Collect the full information of the system, including the CPU, GPU, temperature, memory, DDR, network speed, and screenshot information.
  $ SP_daemon -N 10 -c -g -t -r -d -net -snapshot

  order:0 timestamp=1501837838664
  order:1 TotalcpuUsage=0.751880
  order:2 TotalcpuidleUsage=99.248120
  order:3 TotalcpuioWaitUsage=0.000000
  order:4 TotalcpuirqUsage=0.000000
  order:5 TotalcpuniceUsage=0.000000
  order:6 TotalcpusoftIrqUsage=0.000000
  order:7 TotalcpusystemUsage=0.501253
  order:8 TotalcpuuserUsage=0.250627
  order:9 cpu0Frequency=1992000
  order:10 cpu0Usage=0.000000
  order:11 cpu0idleUsage=100.000000
  order:12 cpu0ioWaitUsage=0.000000
  order:13 cpu0irqUsage=0.000000
  order:14 cpu0niceUsage=0.000000
  order:15 cpu0softIrqUsage=0.000000
  order:16 cpu0systemUsage=0.000000
  order:17 cpu0userUsage=0.000000
  order:18 cpu1Frequency=1992000
  order:19 cpu1Usage=0.000000
  order:20 cpu1idleUsage=100.000000
  order:21 cpu1ioWaitUsage=0.000000
  order:22 cpu1irqUsage=0.000000
  order:23 cpu1niceUsage=0.000000
  order:24 cpu1softIrqUsage=0.000000
  order:25 cpu1systemUsage=0.000000
  order:26 cpu1userUsage=0.000000
  order:27 cpu2Frequency=1992000
  order:28 cpu2Usage=1.000000
  order:29 cpu2idleUsage=99.000000
  order:30 cpu2ioWaitUsage=0.000000
  order:31 cpu2irqUsage=0.000000
  order:32 cpu2niceUsage=0.000000
  order:33 cpu2softIrqUsage=0.000000
  order:34 cpu2systemUsage=1.000000
  order:35 cpu2userUsage=0.000000
  order:36 cpu3Frequency=1992000
  order:37 cpu3Usage=0.000000
  order:38 cpu3idleUsage=100.000000
  order:39 cpu3ioWaitUsage=0.000000
  order:40 cpu3irqUsage=0.000000
  order:41 cpu3niceUsage=0.000000
  order:42 cpu3softIrqUsage=0.000000
  order:43 cpu3systemUsage=0.000000
  order:44 cpu3userUsage=0.000000
  order:45 gpuFrequency=200000000
  order:46 gpuLoad=0.000000
  order:47 gpu-thermal=40000.000000
  order:48 soc-thermal=40.625000
  order:49 memAvailable=1142820
  order:50 memFree=687988
  order:51 memTotal=1935948
  order:52 ddrFrequency=800000000
  order:53 networkDown=0
  order:54 networkUp=0
  order:55 capture=data/local/tmp/capture/screenCap_1501837838669.png

  ...

  command exec finished!
  $
Example 2: Collect the full information of the specified application based on the bundle name, including the CPU, GPU, temperature, frame rate, memory, DDR, network speed, and screenshot information.
  $ SP_daemon -N 10 -PKG ohos.samples.ecg -c -g -t -f -r -d -net -snapshot -threads

  order:0 timestamp=1741415955626
  order:1 ChildProcCpuLoad=NA
  order:2 ChildProcCpuUsage=NA
  order:3 ChildProcId=NA
  order:4 ChildProcSCpuUsage=NA
  order:5 ChildProcUCpuUsage=NA
  order:6 ProcAppName=ohos.samples.ecg
  order:7 ProcCpuLoad=2.641511
  order:8 ProcCpuUsage=6.026481
  order:9 ProcId=18847
  order:10 ProcSCpuUsage=1.747202
  order:11 ProcUCpuUsage=4.279279
  order:12 TotalcpuUsage=26.021798
  order:13 TotalcpuidleUsage=73.978202
  order:14 TotalcpuioWaitUsage=0.000000
  order:15 TotalcpuirqUsage=0.068120
  order:16 TotalcpuniceUsage=0.000000
  order:17 TotalcpusoftIrqUsage=0.000000
  order:18 TotalcpusystemUsage=10.762943
  order:19 TotalcpuuserUsage=15.190736
  ...
  order:123 gpuFrequency=279000000
  order:124 gpuLoad=0.000000
  order:125 Battery=35.000000
  order:126 cluster0=51.000000
  order:127 gpu=47.000000
  order:128 npu_thermal=35.000000
  order:129 shell_back=36.627000
  order:130 shell_frame=35.627000
  order:131 shell_front=35.652000
  order:132 soc_thermal=59.259000
  order:133 system_h=37.000000
  order:134 fps=30
  order:135 fpsJitters=33501562;;50251042;;33522396;;16743750;;33482812;;33505730;;33507291;;33505209;;33502604;;50258854;;33518229;;33501563;;16753125;;50247916;;16751563;;33507812;;16740104;;16792188;;33464583;;33497917;;50261458;;33493750;;33511459;;33502083;;16744271;;16756250;;33505729;;50254687;;33507292;;50286979
  order:136 refreshrate=60
  order:137 arktsHeapPss=29564
  order:138 gpuPss=254647
  order:139 graphicPss=215796
  order:140 heapAlloc=174032
  order:141 heapFree=1232
  order:142 heapSize=187924
  order:143 memAvailable=3437568
  order:144 memFree=780152
  order:145 memTotal=11697880
  order:146 nativeHeapPss=91244
  order:147 privateClean=162560
  order:148 privateDirty=488739
  order:149 pss=761908
  order:150 sharedClean=225060
  order:151 sharedDirty=48740
  order:152 stackPss=2596
  order:153 swap=62024
  order:154 swapPss=62024
  order:155 ddrFrequency=1531000000
  order:156 networkDown=215
  order:157 networkUp=0
  ...
  order:180 capture=data/local/tmp/capture/screenCap_1741415955811.png
  order:181 threadsNum=18847:111|
  order:182 tids=18847:45862 45700 25783 25622 25384 25381 19423 19170 19167 19166 19165 19163 19162 19159 19157 19156 19154 19153 19152 19151 19150 19149 19147 19146 19145 19142 19141 19140 19139 19136 19135 19134 19120 19112 19111 19088 19083 19081 19077 19076 19075 19074 19073 19072 19071 19070 19055 19044 19040 19039 19034 19033 19032 19031 19030 19029 19028 19027 19019 19017 19016 19015 19014 19013 19012 19011 19009 19007 19006 19005 19004 19003 19001 19000 18999 18998 18997 18996 18995 18994 18993 18992 18991 18990 18989 18988 18987 18986 18985 18984 18983 18982 18981 18980 18977 18974 18946 18942 18936 18934 18933 18931 18930 18929 18928 18927 18926 18925 18924 18923 18847|
  ...

  command exec finished!
  $
Example 3: Collect the full information of the specified application based on the process ID, including the CPU, GPU, temperature, frame rate, memory, DDR, network speed, and screenshot information.
  $ SP_daemon -N 10 -PID 18847 -c -g -t -f -r -d -net -snapshot -threads

  order:0 timestamp=1741416084766
  order:1 ChildProcCpuLoad=NA
  order:2 ChildProcCpuUsage=NA
  order:3 ChildProcId=NA
  order:4 ChildProcSCpuUsage=NA
  order:5 ChildProcUCpuUsage=NA
  order:6 ProcAppName=ohos.samples.ecg
  order:7 ProcCpuLoad=2.857003
  order:8 ProcCpuUsage=5.932203
  order:9 ProcId=18847
  order:10 ProcSCpuUsage=1.765537
  order:11 ProcUCpuUsage=4.166667
  order:12 TotalcpuUsage=28.442728
  order:13 TotalcpuidleUsage=71.557272
  order:14 TotalcpuioWaitUsage=0.000000
  order:15 TotalcpuirqUsage=0.000000
  order:16 TotalcpuniceUsage=0.000000
  order:17 TotalcpusoftIrqUsage=0.000000
  order:18 TotalcpusystemUsage=9.716860
  order:19 TotalcpuuserUsage=18.725869
  ...
  order:123 gpuFrequency=279000000
  order:124 gpuLoad=0.000000
  order:125 Battery=35.000000
  order:126 cluster0=51.000000
  order:127 gpu=47.000000
  order:128 npu_thermal=35.000000
  order:129 shell_back=36.627000
  order:130 shell_frame=35.627000
  order:131 shell_front=35.652000
  order:132 soc_thermal=59.259000
  order:133 system_h=37.000000
  order:134 fps=30
  order:135 fpsJitters=33501562;;50251042;;33522396;;16743750;;33482812;;33505730;;33507291;;33505209;;33502604;;50258854;;33518229;;33501563;;16753125;;50247916;;16751563;;33507812;;16740104;;16792188;;33464583;;33497917;;50261458;;33493750;;33511459;;33502083;;16744271;;16756250;;33505729;;50254687;;33507292;;50286979
  order:136 refreshrate=60
  order:137 arktsHeapPss=29564
  order:138 gpuPss=254647
  order:139 graphicPss=215796
  order:140 heapAlloc=174032
  order:141 heapFree=1232
  order:142 heapSize=187924
  order:143 memAvailable=3437568
  order:144 memFree=780152
  order:145 memTotal=11697880
  order:146 nativeHeapPss=91244
  order:147 privateClean=162560
  order:148 privateDirty=488739
  order:149 pss=761908
  order:150 sharedClean=225060
  order:151 sharedDirty=48740
  order:152 stackPss=2596
  order:153 swap=62024
  order:154 swapPss=62024
  order:155 ddrFrequency=1531000000
  order:156 networkDown=215
  order:157 networkUp=0
  ...
  order:180 capture=data/local/tmp/capture/screenCap_1741416084923.png
  order:181 threadsNum=18847:113|
  order:182 tids=18847:46736 46734 46731 46663 25783 25622 25384 25381 19423 19170 19167 19166 19165 19163 19162 19159 19157 19156 19154 19153 19152 19151 19150 19149 19147 19146 19145 19142 19141 19140 19139 19136 19135 19134 19120 19112 19111 19088 19083 19081 19077 19076 19075 19074 19073 19072 19071 19070 19055 19044 19040 19039 19034 19033 19032 19031 19030 19029 19028 19027 19019 19017 19016 19015 19014 19013 19012 19011 19009 19007 19006 19005 19004 19003 19001 19000 18999 18998 18997 18996 18995 18994 18993 18992 18991 18990 18989 18988 18987 18986 18985 18984 18983 18982 18981 18980 18977 18974 18946 18942 18936 18934 18933 18931 18930 18929 18928 18927 18926 18925 18924 18923 18847|
  ...

  command exec finished!
  $

- Make sure you are on the application screen when running this command.
2. On-demand start and stop
Run the start command to start the collection. After operating the device or application, run the stop command to stop the collection.
| Command | Mandatory | Description |
|---|---|---|
| -start | Yes | Starts collection. You can add a basic collection command after this command parameter. The collection is performed every second. |
| -stop | Yes | Stops collection and generates a report. |
| No | Prints the collection start and stop information every second. |
Start and stop collecting the frequency and usage of CPU cores.
# Start data collection
$ SP_daemon -start -c
SP_daemon Collection begins


command exec finished!
$

# Stop data collection
$ SP_daemon -stop
SP_daemon Collection ended
Output Path: data/local/tmp/smartperf/1/t_index_info.csv


command exec finished!
$
Start and stop collecting the frequency and usage of CPU cores and print the information.
 # Start data collection
 # Start printing the collection information
 $ SP_daemon -start -c -print
 SP_daemon Collection begins

 order:0 TotalcpuUsage=20.860927
 order:1 TotalcpuidleUsage=79.139073
 order:2 TotalcpuioWaitUsage=0.000000
 order:3 TotalcpuirqUsage=0.082781
 order:4 TotalcpuniceUsage=0.000000
 order:5 TotalcpusoftIrqUsage=0.000000
 order:6 TotalcpusystemUsage=8.029801
 order:7 TotalcpuuserUsage=12.748344
 order:8 cpu0Frequency=1430000
 order:9 cpu0Usage=44.554455
 order:10 cpu0idleUsage=55.445545
 order:11 cpu0ioWaitUsage=0.000000
 order:12 cpu0irqUsage=0.000000
 order:13 cpu0niceUsage=0.000000
 order:14 cpu0softIrqUsage=0.000000
 order:15 cpu0systemUsage=17.821782
 order:16 cpu0userUsage=26.732673
 order:17 cpu10Frequency=1239000
 order:18 cpu10Usage=0.000000
 order:19 cpu10idleUsage=100.000000
 order:20 cpu10ioWaitUsage=0.000000
 order:21 cpu10irqUsage=0.000000
 order:22 cpu10niceUsage=0.000000
 order:23 cpu10softIrqUsage=0.000000
 order:24 cpu10systemUsage=0.000000
 order:25 cpu10userUsage=0.000000
 order:26 cpu11Frequency=1239000
 order:27 cpu11Usage=0.000000
 order:28 cpu11idleUsage=100.000000
 order:29 cpu11ioWaitUsage=0.000000
 order:30 cpu11irqUsage=0.000000
 order:31 cpu11niceUsage=0.000000
 order:32 cpu11softIrqUsage=0.000000
 order:33 cpu11systemUsage=0.000000
 order:34 cpu11userUsage=0.000000
 ...
 command exec finished!
 $

 # Stop data collection
 # To stop printing, you need to open the CLI and run the following command:
 $ SP_daemon -stop
 SP_daemon Collection ended
 Output Path: data/local/tmp/smartperf/1/t_index_info.csv

 command exec finished!
 $

Example 1: Run the SP_daemon -start -c -g -t -r -d -net -snapshot command to collect the CPU, GPU, temperature, frame rate, memory, DDR, network rate, and screenshot information of the system.
Example 2: Run the SP_daemon -start -PKG ohos.samples.ecg -c -g -t -f -r -d -net -snapshot -threads -fds command to collect the CPU load, GPU, temperature, frame rate, memory, DDR, network rate, screenshot, number of threads, and file descriptor information of the system and processes.
Example 3: Run the SP_daemon -start -PID 18847 -c -g -t -f -r -d -net -snapshot -threads -fds command to collect the CPU load, GPU, temperature, frame rate, memory, DDR, network rate, screenshot, number of threads, and file descriptor information of the system and processes.
Example 4: Run the SP_daemon -start -c -g -t -r -d -net -snapshot -threads -fds -print command to collect and print the CPU, GPU, temperature, frame rate, memory, DDR, network rate, screenshot, number of threads, and file descriptor information of the system.
Example 5: Run the SP_daemon -start -PID 18847 -c -g -t -f -r -d -net -snapshot -threads -fds -print command to collect and print the CPU load, GPU, temperature, frame rate, memory, DDR, network rate, screenshot, number of threads, and file descriptor information of the system and processes.
The service start and stop file is stored in data/local/tmp/smartperf/1/t_index_info.csv. You can run the hdc file recv command to export the report. For details, see CSV output.
3. CSV output
If the collection result is saved in a CSV file, perform the following steps to export and view the result:
By default, the collection results are saved to /data/local/tmp/data.csv.
Check the path to the result file.
C:\Users\issusser>hdc shell
$ cd data/local/tmp
# ls
data.csv
$
Export the file to the specified path.
C:\Users\issusser>hdc file recv data/local/tmp/data.csv D:\
[I][2023-11-08 16:16:41] HdcFile::TransferSummary success
FileTransfer finish, Size:429, File count = 1, time:6ms rate:71.50kB/s

C:\Users\issusser>
Open the data.csv file to view the collected data.
The table below describes the data fields in the data.csv file.
Data Field Description Remarks threadsNum Total number of threads. - tids Thread ID. - fdTotal Total number of file descriptors. - fds File descriptor. Unit: Hz cpuFrequency CPU core frequency. Unit: Hz cpuUsage CPU core usage. % cpuidleUsage CPU usage in idle state. % cpuioWaitUsage CPU usage of I/O wait. % cpuirqUsage CPU usage of hardware interrupts. % cpuniceUsage CPU usage of user level processes with lower scheduling priority. % cpusoftIrqUsage CPU usage of software interrupts. % cpusystemUsage CPU usage in kernel mode. % cpuuserUsage CPU usage in user mode. % ProcId Process ID. - ChildProcId Child process ID. - ProcAppName Application bundle name. - ProcCpuLoad Process CPU load. % ChildProcCpuLoad CPU load of the child process. % ProcCpuUsage CPU usage of the process. % ChildProcCpuUsage CPU usage of the child process. % ProcUCpuUsage CPU usage of the process in user mode. % ChildProcCpuUsage CPU usage of the child process in user mode. % ProcSCpuUsage CPU usage of the process in kernel mode. % ChildProcSCpuUsage CPU usage of the child process in kernel mode. % gpuFrequency GPU frequency of the system. % gpuLoad GPU load of the system. % hw-instructions Number of executed instructions. - cycles per instruction Average number of cycles per instruction. Unit: ns hw-cpu-cycles Number of CPU clock cycles. Unit: ns currentNow Current value. Unit: mA voltageNow Voltage value. Unit: μV fps Number of frames per second. Unit: FPS fpsJitters Frame interval. Unit: ns refreshrate Screen refresh rate. Unit: Hz networkDown Downstream rate. Unit: byte/s networkUp Uplink rate. Unit: byte/s ddrFrequency DDR frequency. Unit: Hz gpu-thermal GPU temperature. Unit: °C soc-thermal SoC temperature. Unit: °C memAvailable Available memory of the system. Unit: KB memFree Free memory of the system. Unit: KB memTotal Total memory of the system. Unit: KB pss Proportional set size (PSS) of the process. Unit: KB Childpss Proportional set size (PSS) of the child process. Unit: KB sharedClean Shared unwritten pages of the process. Unit: KB ChildsharedClean Shared unwritten pages of the child process. Unit: KB sharedDirty Shared rewritten pages of the process. Unit: KB ChildsharedDirty Shared rewritten pages of the child process. Unit: KB privateClean Private unwritten pages of the process. Unit: KB ChildprivateClean Private unwritten pages of the child process. Unit: KB privateDirty Private rewritten pages of the process. Unit: KB ChildprivateDirty Private rewritten pages of the child process. Unit: KB swapTotal Total swap memory of the process. Unit: KB ChildswapTotal Total swap memory of the child process. Unit: KB swapPss Swapped PSS of the process. Unit: KB ChildswapPss Swapped PSS of the child process. Unit: KB HeapSize Heap size of the process. Unit: KB ChildHeapSize Heap size of the child process. Unit: KB HeapAlloc Heap size that can be allocated of the process. Unit: KB ChildHeapAlloc Heap size that can be allocated of the child process. Unit: KB HeapFree Remaining heap size of the process. Unit: KB ChildHeapFree Remaining heap size of the child process. Unit: KB gpuPss Used GPU size of the process. Unit: KB ChildgpuPss Used GPU size of the child process. Unit: KB graphicPss Used graphics memory size of the process. Unit: KB ChildgraphicPss Used graphics memory size of the child process. Unit: KB arktsHeapPss Used ArkTS memory size of the process. Unit: KB ChildarktsHeapPss Used ArkTS memory size of the child process. Unit: KB nativeHeapPss Used native memory size of the process. Unit: KB ChildnativeHeapPss Used native memory size of the child process. Unit: KB stackPss Used stack memory size of the process. Unit: KB ChildstackPss Used stack memory size of the child process. Unit: KB timeStamp Timestamp. Collection time.
[h2]Scenario Collection
In addition to basic collection, the response and completion latency can be collected. The scenario collection result is displayed in the CLI instead of being written into the data.csv file.
| Command | Mandatory | Description |
|---|---|---|
| -editor | Yes | Identifies scenario collection. Parameter options can be added after. |
| -responseTime | No | Collects the response latency. |
| -completeTime | No | Collects the completion delay. |
| -fpsohtest | No | Collects the frame rate every second. The frame rate is collected 10 times by default. |
Collect the application response latency. (This command supports only the RK3568 device.)
 $ SP_daemon -editor responseTime ohos.samples.ecg ohtest
 time:544ms

 command exec finished!

- Open the application before collection, press Enter in the CLI, switch to the application page, and wait for the collection result to be printed.
Collect the application completion latency. (This command supports only the RK3568 device.)
 $ SP_daemon -editor completeTime ohos.samples.ecg ohtest
 time:677ms

 command exec finished!

- Open the application before collection, press Enter in the CLI, switch to the application page, and wait for the collection result to be printed.
Use the validator to obtain the application page frame rate.
 $ SP_daemon -editor fpsohtest
 set num:10 successfps:0|1726909713442fps:97|1726909714442fps:113|1726909715442fps:116|1726909716442fps:116|1726909717442fps:118|1726909718442fps:114|1726909719442fps:114|1726909720442fps:115|1726909721442fps:118|1726909722442SP_daemon exec finished!

- You need to swipe or switch the current page after running the command, and the collection result will be printed after 10s.
[h2]Other Collection
The power collection result of the current device can be written into the data.csv file. Other data is collected separately and the collection result is displayed only in the command box.
| Command | Mandatory | Description |
|---|---|---|
| -screen | No | Collects the screen resolution and refresh rate. |
| -deviceinfo | No | Obtains device information. |
| -server | No | Starts a daemon process by starting or stopping collection. |
| -clear | No | Clears all the SP_daemon processes. |
| -ohtestfps | No | Obtains the frame rate. You can set the number of collection times (collection is performed every second). |
| -editorServer | No | Starts a daemon process by using an editor. |
| -recordcapacity | No | Obtains the battery level of the current device. |
| -profilerfps | No | Collects the frame rate of the current page. |
Obtain the screen resolution.
 $ SP_daemon -screen
 activeMode: 720x1280, refreshrate=69


 command exec finished!
 $

- activeMode indicates the current screen resolution, and refreshrate indicates the screen refresh rate.
Obtain the device information.
 $ SP_daemon -deviceinfo
 abilist: default
 activeMode: 720x1280
 board: hw
 brand: default
 cpu_c1_cluster: 0 1 2 3
 cpu_c1_max: 1992000
 cpu_c1_min: 408000
 cpu_cluster_name: policy0
 daemonPerfVersion: 1.0.5
 deviceTypeName: rk3568
 fullname: HarmonyOS-5.1.0.46
 gpu_max_freq: 800000000
 gpu_min_freq: 200000000
 model: ohos
 name: HarmonyOS 3.2
 sn: 150100424a5444345209d941bec6b900
 version: HarmonyOS 5.1.0.46

 command exec finished!
 $
Start a process to listen for the socket messages of the start and stop commands.
 $ SP_daemon -server
 $
 $ pidof SP_daemon
 7024
 $

- You can run the pidof SP_daemon command to view the process ID.
Clear the SP_daemon process ID.
 $ pidof SP_daemon
 2725
 $ SP_daemon -clear


 command exec finished!
 $
 $ pidof SP_daemon
 $

- You can run the pidof SP_daemon command to view the process ID.
Obtain the frame rate of the current page using a validator.
 $ SP_daemon -ohtestfps 10
 set num:10 success
 fps:1|1501926684532
 fps:18|1501926685532
 fps:37|1501926686532
 fps:41|1501926687532
 fps:42|1501926688532
 fps:16|1501926689532
 fps:40|1501926690532
 fps:40|1501926691532
 fps:42|1501926692532
 fps:41|1501926693532
 SP_daemon exec finished!
 $

- In this command, 10 indicates the number of collection times (collection is performed every second). You can set it to a positive integer.
Start a process to listen for the socket messages of the editor tool.
 $ SP_daemon -editorServer


 command exec finished!
Obtain the battery level.
 $ SP_daemon -recordcapacity
 recordTime: 1726903063
 recordPower: 5502

recordTime indicates the timestamp, and recordPower indicates the current battery level.
This command needs to be executed separately. The collection result is written into the /data/local/tmp/powerLeftRecord.csv file and can be exported to the local PC by running the hdc file recv command. For details, see CSV output.
Collect the frame rate of the current page.
  $ SP_daemon -profilerfps 10
  set num:10 success
  fps:0|1711692357278
  fps:0|1711692358278
  fps:1|1711692359278
  fps:0|1711692360278
  fps:0|1711692361278
  fps:0|1711692362278
  fps:0|1711692363278
  fps:0|1711692364278
  fps:26|1711692365278
  fps:53|1711692366278
  SP_daemon exec finished!
  $

- In this command, 100 indicates the number of collection times (collection is performed every second). You can set it to a positive integer.
Collect the frame rate by time segment.
  $ SP_daemon -profilerfps 100 -sections 10
  set num:100 success
  fps:0|1711692393278
  fps:0|1711692394278
  fps:0|1711692395278
  fps:44|1711692396278
  sectionsFps:0|1711692396278
  sectionsFps:0|1711692396378
  sectionsFps:40|1711692396478
  sectionsFps:60|1711692396578
  sectionsFps:60|1711692396678
  sectionsFps:60|1711692396778
  sectionsFps:60|1711692396878
  sectionsFps:40|1711692396978
  sectionsFps:60|1711692397078
  sectionsFps:60|1711692397178
  fps:51|1711692397278

  ...

  SP_daemon exec finished!
  $

- In this command, 100 indicates the number of collection times (collection is performed every second) and can be set to a positive integer. 10 indicates collection by segment. Currently, the number of collection segments can be set to a positive integer ranging from 1 to 10.