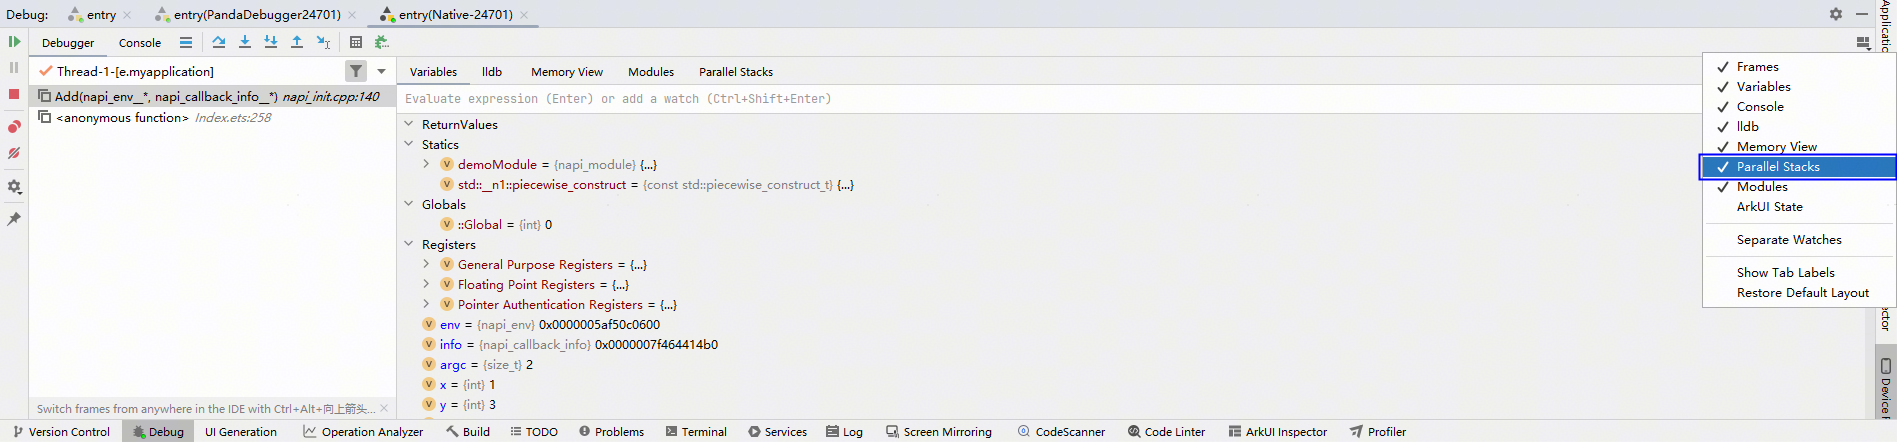
In the native code debugging window, click Layout Settings  and select Parallel Stacks to open the Parallel Stacks pane.
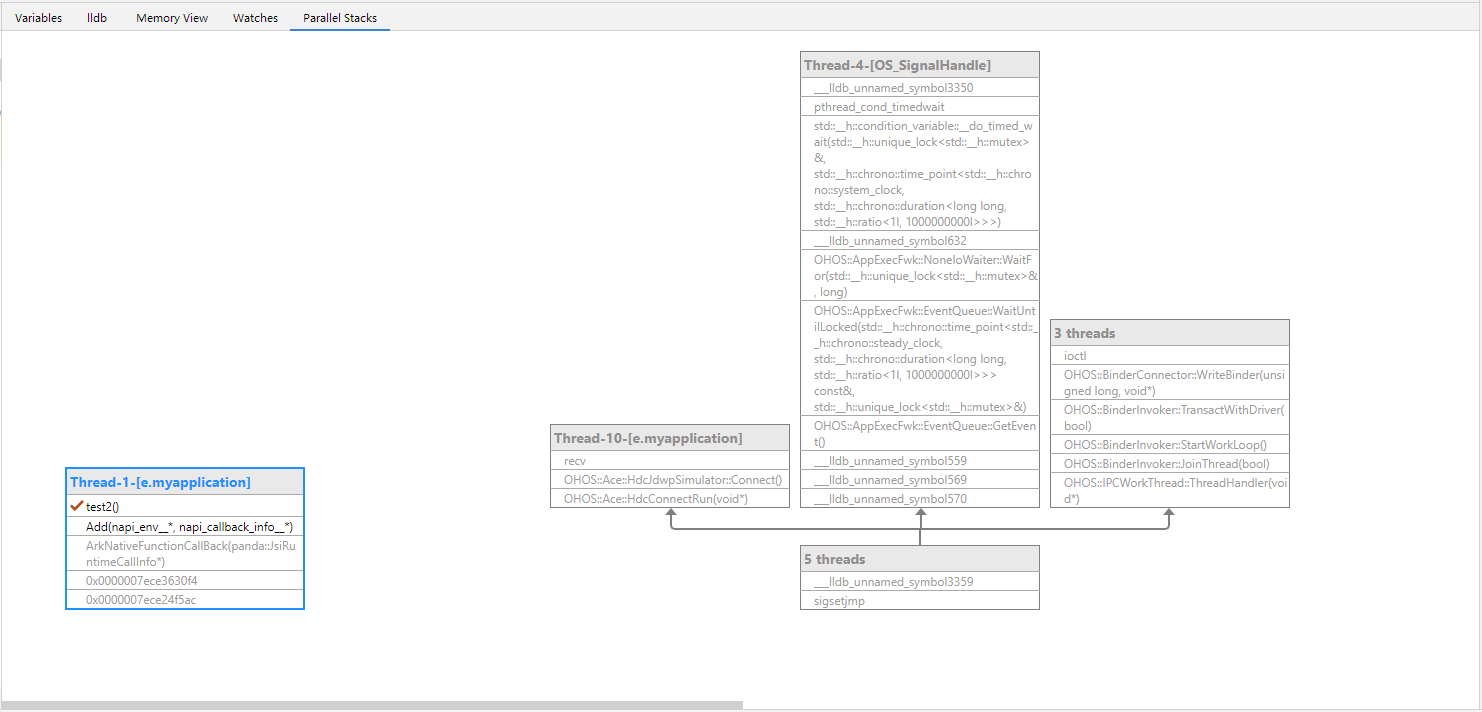
When an app is paused, the Parallel Stacks pane can display the call stack information of multiple threads and merge duplicate call stacks, which helps you better understand the concurrent execution of the app and identify potential multi-thread issues.