Symptom 1
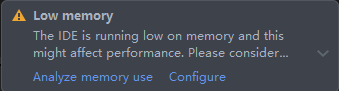
During Profiler data analysis, DevEco Studio freezes or stops responding, and "Low Memory" is displayed.
Symptom 2
During Profiler data analysis, Profiler cannot be used, and "The IDE is running low on memory" is displayed.

Solution
Modify the maximum memory that can be used by the VM in the DevEco Studio configuration file.
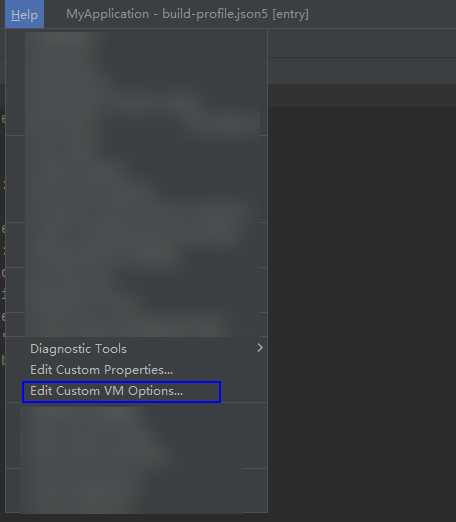
- On the DevEco Studio toolbar, choose Help > Edit Custom VM Options to open the configuration file.
- Adjust the value after the -Xmx parameter according to your actual needs. If the -Xmx parameter is not present in the configuration file, add it manually. For example: -Xmx2048m. 2048m represents the amount of memory the virtual machine can use. You can increase this value as needed.